

Abstract
The endometrium is a dynamic tissue that exhibits remarkable resilience to repeated episodes of differentiation, breakdown, regeneration, and remodeling. Endometrial physiology relies on a complex interplay between the stromal and epithelial compartments with the former containing a mixture of fibroblasts, vascular, and immune cells. There is evidence for rare populations of putative mesenchymal progenitor cells located in the perivascular niche of human endometrium, but the existence of an equivalent cell population in mouse is unclear. We used the Pdgfrb‐BAC‐eGFP transgenic reporter mouse in combination with bulk and single‐cell RNA sequencing to redefine the endometrial mesenchyme. In contrast to previous reports we show that CD146 is expressed in both PDGFRβ + perivascular cells and CD31 + endothelial cells. Bulk RNAseq revealed cells in the perivascular niche which express the high levels of Pdgfrb as well as genes previously identified in pericytes and/or vascular smooth muscle cells (Acta2, Myh11, Olfr78, Cspg4, Rgs4, Rgs5, Kcnj8, and Abcc9). scRNA‐seq identified five subpopulations of cells including closely related pericytes/vascular smooth muscle cells and three subpopulations of fibroblasts. All three fibroblast populations were PDGFRα+/CD34 + but were distinct in their expression of Ngfr/Spon2/Angptl7 (F1), Cxcl14/Smoc2/Rgs2 (F2), and Clec3b/Col14a1/Mmp3 (F3), with potential functions in the regulation of immune responses, response to wounding, and organization of extracellular matrix, respectively. Immunohistochemistry was used to investigate the spatial distribution of these populations revealing F1/NGFR + cells in most abundance beside epithelial cells. We provide the first definitive analysis of mesenchymal cells in the adult mouse endometrium identifying five subpopulations providing a platform for comparisons between mesenchymal cells in endometrium and other adult tissues which are prone to fibrosis.
Keywords: CD146, chondroitin sulfate proteoglycan 4, endometrium, fibroblast, pericyte, platelet‐derived growth factor beta
Abbreviations
- CD146
cluster of differentiation 146/melanoma cell adhesion molecule/MUC18
- CD31
platelet endothelial adhesion molecule/cluster of differentiation 31
- CD90
cluster of differentiation 90/Thy1
- CSPG4/NG2
chondroitin sulfate proteoglycan 4/neuron‐glial antigen 2
- GFP
green fluorescent protein
- LRC
label retaining cell
- PDGFRα
platelet‐derived growth factor receptor alpha
- PDGFRβ
platelet‐derived growth factor receptor beta
- scRNA‐seq
single‐cell RNA sequencing
- SUSD2
sushi domain‐containing protein 2
- VSMC
vascular smooth muscle cell
1. INTRODUCTION
The endometrium of women and mice share a similar architecture with epithelial cells lining the glands and lumen supported on a complex stroma containing fibroblasts and a well‐developed vasculature. In both species stromal fibroblasts transform into decidual secretory cells capable of supporting an implanting blastocyst in response to the action of the sex steroid hormones estrogen and progesterone. Decidualization, either spontaneous (as in women) or requiring additional blastocyst‐derived signals (as in mice), results in irreversible changes in stromal cell function. 1 , 2 In species with spontaneous decidualization in the absence of a viable blastocyst the region of tissue containing the decidual cells breaks down and is shed during menstruation. 3 , 4 , 5 Menstruation only occurs in women, and a few other species including higher primates and the Spiny mouse (Acomys cahirinus) 6 ; and is characterized by spontaneous transformation/decidualization of stromal fibroblasts. A menstrual‐like event can be simulated in other mouse species following artificial induction of decidualization. 7 , 8
In both natural and induced menstrual cycles the surface of the endometrium resembles a bloody wound during tissue breakdown but repair is both rapid and scar‐free with evidence of epithelial cell proliferation, mobilization of stromal cells, and evidence of mesenchymal to epithelial cell transformation. 3 , 8 It has been postulated that the rapid restoration of endometrial tissue integrity is in part due to mobilization and differentiation of tissue‐resident endometrial progenitor cells. 9 Many studies have searched for candidate endometrial progenitor cells using in vitro assays based on clonogenicity and self‐renewal as well as whole tissue analysis including recovery of side population cells (SP) and those labeled with BrdU in label retention assays. 10 , 11 In 2004, Chan et al, reported the existence of small populations of epithelial and stromal cells in human endometrium that were able to form colonies from single‐cell suspensions in vitro (0.22% and 1.25%, respectively. 12 These cells also exhibited key features of stem‐like cells including self‐renewal, a high proliferative potential, and the capacity for multilineage differentiation. 13 A population of perivascular cells from human endometrium with clonogenic and multi‐lineage differentiation potential in vitro was initially isolated based on the co‐expression of PDGFRβ and CD146 12 , 14 but in further studies sushi domain‐containing protein 2 (SUSD2), recognized by the W5C5 monoclonal antibody has emerged as a definitive candidate marker for putative endometrial mesenchymal progenitors. 9 This antibody reacts with human and primate proteins but not ovine 15 or mouse. Human SUSD2+ cells exhibited clonogenicity, multilineage differentiation, and self‐renewal, representing ~4% of endometrial stromal cells with a perivascular location. 9 , 16
Studies in mice have tried to identify tissue‐resident endometrial progenitor cells. For example, labeling of endometrial tissue with BrdU injections in 3‐day‐old mice resulted in detection of LRCs in the stromal compartment into adulthood, falling from 8% of all stromal cells on day 49 to ~2% on day 112 post injection. Some of the LRCs expressed putative “stem cell” markers Oct4 and c‐kit/CD117 17 as well as CD44, CD90, PDGFRβ, CD146, and Sall4. 18 Stromal LRC have a close association with CD31+ endothelial cells and expression of α‐SMA appears consistent with a vascular smooth muscle cell and/or pericyte phenotype. 18 , 19 Although putative endometrial mesenchymal progenitor cells in the mouse are reported to co‐express PDGFRβ and CD146 18 , 20 to date no single marker equivalent to human SUSD2 has been described.
In summary, studies on human endometrial tissue suggest the stroma contains one or more populations of tissue‐resident progenitor cells that contribute to resilience of the tissue. While candidate cells adjacent to the vasculature have been identified in human endometrium the evidence for their existence in mouse endometrium is less robust. The current study used the Pdgfrb‐BAC‐eGFP transgenic reporter mouse in combination with single‐cell transcriptomics to generate a definitive set of cell‐specific markers for mesenchyme‐derived cell populations. Not only did these studies identify and characterize a population of perivascular cells in the mouse endometrium but novel findings revealed evidence of unexpected complexity in the fibroblast populations that make up the bulk of the endometrial stromal mesenchyme.
2. MATERIALS AND METHODS
2.1. Animals
In Pdgfrb‐BAC‐eGFP reporter mice (C57BL/6 background), eGFP expression is driven by the regulatory sequences of the Pdgfrb gene and is, therefore, expressed by all cells in which this promoter is active. The use of this transgenic mouse for studies on liver mesenchymal cells has previously been described 21 : these mice were originally obtained from GENSAT and deposited in MMRRC‐STOCK Tg (Pdgfrb‐EGFP) JN169Gsat/Mmucd, 031796‐UCD. All mice were genotyped at weaning as described previously. 21 Uterine tissue samples were collected from cycling adult female mice (8‐10 weeks old) with estrous stage confirmed by vaginal smears as described in. 22 Unless stated otherwise, uterine tissue samples from across the estrus cycle were examined and any notable differences were discussed.
2.2. Tissue fixation
To preserve eGFP fluorescent signal in downstream immunohistochemical analysis, Pdgfrb‐BAC‐eGFP uterine tissue samples were fixed in 4% (w/v) PFA for 2 hours at 4°C, rinsed thoroughly in PBS, and stored overnight in 18% (w/v) sucrose at 4°C. Approximately 24 hours later samples were embedded in OCT medium and stored at −80°C. Frozen tissue sections (5µm) were cut and mounted onto Xtra adhesive pre‐cleaned micro slides (Surgipath, Leica Biosystems) and air‐dried at room temperature for 30 minutes prior to staining (minimum of two sections of each uterine horn per mouse). Additional C57BL/6 uterine tissue samples were fixed in NBF overnight at room temperature then stored in 70% ethanol and processed into paraffin wax for use in IHC detection of multiple proteins.
2.3. Immunohistochemistry
Hematoxylin and eosin (H&E) staining was performed according to the standard methods. For immunofluorescence, tissue sections were washed in PBS to remove residual OCT and incubated with 3% (v/v) hydrogen peroxide solution in methanol for 30 minutes at room temperature, washed (unless stated otherwise, all wash steps included one 5 minutes wash in PBS containing 0.05% (v/v) Tween20 and two 5 minutes washes in PBS), and further incubated with 20% (v/v) normal goat serum (NGS: PBS containing 20% goat serum and 0.05% (w/v) bovine serum albumin (BSA)) for 30 minutes at room temperature. For paraffin‐embedded tissues the above steps were preceded by dewaxing, rehydration, and heat‐mediated antigen retrieval using epitope retrieval buffer (pH6/pH9). Sections were washed and incubated overnight at 4°C with the primary antibody at an optimized dilution in NGS. Following a further wash, sections were incubated with an HRP‐conjugated secondary antibody at an optimized dilution in NGS for 1 hour at room temperature followed by a 10 minutes incubation with Tyramide solution (PerkinElmer) or Opal Polaris 480 solution (Akoya Biosciences).
For co‐staining, sections were washed and a second incubation with NGS was performed. Sections were blocked in streptavidin for 15 minutes, washed, and blocked in biotin for 15 minutes. The second primary antibody was added for an overnight incubation at 4°C. Following a further wash, sections were sequentially incubated with a biotinylated secondary antibody then streptavidin AF555 for 30 minutes at room temperature.
Primary and secondary antibodies and associated working dilutions are given in Table S1. Following both protocols above, sections were counterstained with DAPI (Sigma, D9542), overlaid with Permaflour (Immunotech), and mounted with coverslips (VWR Prolabo). Images were captured on a Zeiss LSM 510 Meta Confocal microscope using Zen 2009 software (Zeiss).
2.4. Flow cytometry and fluorescence‐activated cell sorting
Tissue processing for flow cytometry analysis and FACS was performed as previously described. 7 Briefly, whole uterine horns were minced then incubated with collagenase (10mg/ml) and DNase (10mg/ml) for 30 minutes at 37°C. Tissues were further dispersed using an 18G needle, washed in FACS buffer (PBS Ca2‐Mg2‐: 5% charcoal stripped fetal calf serum (CSFCS), 2mM EDTA), and subsequently strained through 70μm and 40μm cell strainers. Cell suspensions were centrifuged at 400rcf for 5 minutes and cell pellets were re‐suspended in 1 ml ACK lysing buffer (Gibco, Cat. No. A10492‐01) for 1 minute. Suspensions were then washed (as above) and incubated for 30 minutes on ice with optimized dilutions of fluorescently conjugated antibodies as detailed in Table S2. Cell suspensions were centrifuged at 400rcf for 5 minutes to wash. Cell pellets were re‐suspended in 500μl PBS at 4°C and analyzed using a BD 5L LSR Fortessa and BD FACSDiva software (BD Biosciences). To exclude dead cells, DAPI was added prior to flow cytometry analysis. Cells were sorted using a FACS Aria II instrument and BD FACSDiva software (BD Biosciences). Data analysis was performed using FlowJo analysis software (FlowJo LLC).
2.5. RNA and cDNA preparation for quantitative real‐time PCR
For RNA extraction of tissue, samples were added to TriReagent (Sigma, Cat. No. T9424) and processed as detailed in ref. 8. The total concentration and purity of resulting RNA were determined using a Nanodrop ND100 Spectrophotometer (Thermo Fisher Scientific). Reverse transcription of RNA to cDNA was performed with the Superscript VILOTM cDNA synthesis kit (Invitrogen, Cat. No. 11754‐250) according to the manufacturer's instructions and the following PCR settings: 25°C for 10 minutes, 42°C for 60 minutes, and 85°C for 5 minutes in a Peltier Thermal Cycler (PTC‐200).
RNA extraction of FACS‐isolated cells was carried out using the automated Maxwell® Instrument (Promega, Cat. No. AS2000). The SimplyRNA cells protocol was run using the Maxwell® 16 Instrument configured with the Maxwell® 16 High Strength LEV Magnetic Rod and Plunger Bar Adaptor (Promega, Cat. No. SP10790) and Maxwell® 16 firmware version 4.95. The total concentration and purity of resulting RNA were determined using the RNA Pico Sensitivity Assay (Perkin Elmer, Cat. No. CLS960012) as per the manufacturer's instructions and loaded onto the DNA 5K/RNA/Charge Variant Assay LabChip (Perkin Elmer, Cat. No. 760435) to be read using a LabChip GX Touch Nucleic Acid Analyzer (Perkin Elmer, Cat. No. CLS138162). Reverse transcription and amplification of RNA purified from isolated cells were performed with the NuGEN Ovation RNA‐Seq System V2 (NuGEN Cat. No. 7102‐32) according to the manufacturer's instructions. The integrity of resultant cDNA was assessed using a LabChip GX Touch 24 Nucleic Acid Analyzer as the per manufacturer's instructions (Perkin Elmer).
2.6. Quantitative RT‐PCR
The Applied Biosystems TaqMan method (Thermo Fisher Scientific) was used to detect specific PCR products. Primers for genes of interest were designed by the Universal Probe Library Assay Design Centre (Roche Applied Science, Penzberg, Germany) and purchased from Eurofins MWG Operon (Ebersberg, Germany) (sequences in Table S3). Reactions were prepared in duplicate and amplification performed at 95°C for 5 minutes and then, 30 cycles of 95°C for 1 minute, 58°C for 1 minute, and 72°C for 1 minute on a real time PCR system (Quantstudio5). Relative expression for each gene was calculated using the standard curve method in which the amount of target genes was normalized to beta‐actin (Actb) and relative expression between samples was calculated. Normalized expression values are displayed as a fold change in expression. Statistical analyses were performed using GraphPad Prism software. When data were normally distributed a student's t test was performed to determine the significance of a difference between two groups. When comparing the means of more than two groups a one‐way ANOVA was used followed by a multiple comparisons test such as Sidak's or Tukey's. All data are presented as mean ± SEM and criteria for significance is P < .05.
2.7. Illumina‐based mRNA sequencing
Endometrial mesenchymal cells (GFP+) were isolated from cycling Pdgfrb‐BAC‐eGFP mice by FACS and RNA was extracted using the Maxwell® SimplyRNA cells kit (Promega, Cat. No. AS1270). cDNA was amplified using the NuGEN Ovation V2 system and all purified samples were judged to be of high quality and sufficient quantity for next‐generation mRNA sequencing using the LabChip method (Perkin Elmer). TruSeq DNA Nano gel free libraries (350bp insert) were prepared for each sample and high‐throughput sequencing of library products was performed on the HiSeq 4000 75PE platform according to the standard protocols by Edinburgh Genomics (http://genomics.ed.ac.uk).
2.8. Bioinformatics analysis of mRNA sequencing
FASTQ files were used for genome alignment: Cutadapt was used to filter poor quality raw reads (threshold 30) and trim adapter sequences of the NuGen Ovation V2 Kit (AGATCGGAAGAGC). After trimming, reads were filtered to have a minimum length of 50 bases then aligned to the Mus musculus genome from Ensembl (assembly GRCm38, annotation version 84) using STAR2 version 2.5.2b. Reads were assigned to exon features and grouped by gene ID in the reference genome using featurecounts3. The raw counts table was filtered to remove the rows consisting predominantly of near‐zero counts, filtering on counts per million (CPM) to avoid artifacts due to library depth. Principal components analysis was undertaken on normalized and filtered expression data to explore the observed patterns with respect to experimental factors. The cumulative proportion of variance associated with each factor was used to study the level of structure in the data, while associations between continuous value ranges in principal components and categorical factors were assessed with an ANOVA test. Points were assigned as outliers in each component if they occurred outside the interquartile range + 1.5. If appropriate, problematic samples were excluded from downstream analysis. Differential analysis was carried out using EdgeR4 (version 3.16.5 23 ; and a quasi‐likelihood (QL) F‐test was performed using the desired contrasts. Gene set enrichment analysis of differentially expressed gene sets was carried out using the “clusterProfiler” R package 24 with R version 4.0.2.
Ten candidate genes were chosen based on their CPM and fold change between experimental groups for validation studies: expression was analyzed by qPCR using a new set of cell samples generated from Pdgfrb‐BAC‐eGFP mouse endometrial tissues. Fold changes were calculated by comparing the relative expression values to that of the housekeeper gene Actb.
The data discussed in this publication have been deposited in NCBI’s Gene Expression Omnibus (Edgar et al, 2002) and are accessible through GEO Series accession number GSE160386.
2.9. Chromium single‐cell gene expression analysis‐10x Genomics
Endometrial mesenchymal cells (GFP+) were isolated from cycling Pdgfrb‐BAC‐eGFP mice by FACS as previously described. Samples were pooled from uteri of four mice (estrus phase as determined by vaginal smearing, two horns pooled from each mouse: 25,000 GFP + cells/sample giving a total number of 100,000 GFP + cells for downstream application). Following the sort, isolated cell suspensions were counted, and viability confirmed to be >85% using a TC20TM Automated Cell Counter (BioRad, Cat. No. 1450102). Cells were partitioned into nanoliter‐scale Gel bead‐in‐Emulsions (GEMs) containing unique 10x barcodes using the 10x ChromiumTM Controller (10x Genomics, USA). cDNA libraries were generated and amplified using the ChromiumTM Single Cell 3’ Library & Gel Bead Kit V2 (10x Genomics, Cat. No. 120267) and the ChromiumTM Single Cell A Chip Kit 16 (10x Genomics, Cat. No. 1000009) following the manufacturer's instructions. cDNA concentration and quality were measured using the LabChip GX Touch Nucleic Acid Analyzer and confirmed to surpass the threshold values. Sequence data are generated on the Illumina NovaSeq platform using bespoke 10x parameters, according to the standard protocols at the facility (Edinburgh Genomics: http://genomics.ed.ac.uk/, Edinburgh).
2.10. Bioinformatics analysis of single‐cell mRNA sequencing
Pre‐processing of raw sequencing data files was performed using 10x Cell Ranger (version 2.0.1; https://www.10xgenomics.com). The “cellranger_mkfastq” command was used to demultiplex raw base call (BCL) files generated by the Illumina sequencer, specifying the SI‐GA indices associated with each sample to map individual reads back to the individual input cells. Resultant FASTQ files for each sample were fed into “cellranger_count” along with the transcriptome “refdata‐cellranger‐mm10‐1.2.0” as supplied by 10x genomics, to perform genome alignment, filtering, barcode counting, and UMI counting. Sequence saturation was 85.1% and 85.6% reads mapped confidently to the genome (Figure S5A). For downstream QC, clustering, and gene expression analysis the seurat R package (V3) was utilized 25 with R version 4.0.2. The “Read10x” function was used to read in the output of the Cell Ranger pipeline returning a unique molecular identified (UMI) count matrix representing the number of molecules for each gene detected in each cell. The “CreateSeuratObject” command was used to create the Seurat object used in all subsequent analyses.
The standard Seurat pre‐processing workflow was followed to filter the cells based on QC metrics, normalize, and scale the data and finally detect highly variable features in the data. Before analyzing the single‐cell gene expression data we ensured that all cellular barcode data corresponded to viable cells by assessing four QC covariates: number of unique genes detected in each cell (nFeature_RNA >200 & <5000), the total number of molecules detected within a cell (nCount_RNA), the percentage of reads that map to the mitochondrial genome (<5%), and the percentage of reads that map to ribosomal proteins (<5%). These QC covariates were used to identify nonviable cells or doublets which were filtered out by thresholding prior to downstream analysis (Figure S5B‐E). Resulting data were normalized by employing a global‐scaling normalization method “LogNormalize” that normalizes the feature expression measurements for each cell by the total expression, multiplies this by a scale factor, and log‐transforms the result. A linear transformation (scaling) was performed to give equal weight to genes in downstream analyses so that highly expressed genes did not dominate, before a principal component analysis was performed as the chosen linear dimensional reduction method. Unsupervised clustering based on the first 20 principal components of the most variably expressed genes was performed using a graph‐based approach (“FindNeighbours,” “FindClusters”; resolution = 0.2) which embeds cells in a K‐nearest neighbor (KNN) graph based on the Euclidean distance in PCA space with edges drawn between cells with similar feature expression patterns which is then partitioned into highly interconnected “quasi‐cliques” or “communities.” Resultant clusters were visualized using the manifold approximation and projection (UMAP) method.
Differential gene expression analysis was performed (“FindAllMarkers”) to identify genes expressed by each cell cluster when compared to all other clusters, using the nonparametric Wilcoxon rank‐sum test and P‐value threshold of <.05. Outputs were visualized using the “DoHeatmap,” “FeaturePlot,” and “VlnPlot” functions. Cluster identification was determined by analyzing the expression of canonical cell markers across the cell clusters. The “UpsetR” package 26 was used to analyze the co‐expression of upregulated genes across cell clusters and compare differentially expressed gene lists generated by bulk RNAseq and scRNA‐seq methods. Over‐represented functional annotations in the differentially expressed genes were detected using the “clusterProfiler” package 24 using core functions to interpret data in the context of biological function, pathways, and networks.
The data discussed in this publication have been deposited in NCBI’s Gene Expression Omnibus (Edgar et al, 2002) and are accessible through GEO Series accession number GSE160772.
3. RESULTS
3.1. Two distinct populations of PDGFRβ + mesenchymal cells can be detected in the Pdgfrb‐BAC‐eGFP mouse endometrium based on relative expression of GFP and perivascular marker CD146
In the uterus of Pdgfrb‐BAC‐eGFP mice expression of GFP protein was detected in mesenchymal cells but not in epithelial cells (glandular: GE; luminal: LE) or smooth muscle cells of the myometrium (M) (Figure 1A). In tissue sections the intensity of GFP expression revealed two subpopulations of cells which we classified as GFPdim and GFPbright (Figure 1A; white and yellow arrow heads, respectively). Co‐localization of GFP with PDGFRβ was confirmed in both GFPdim and GFPbright cells (Figure 1B; white and yellow arrow heads, respectively). Sections were co‐labeled with markers of epithelial (EpCAM), mesenchymal (desmin), and vascular (CD31: endothelial; CD146: endothelial/pericyte) cells. Both GFP + populations were EpCAM‐ (Figure S1B(ii)) and desmin+ (Figure S1B(iii)). Notably GFPdim cells were CD31‐CD146‐ and GFPbright cells were CD31‐CD146+: the latter were located in close proximity to CD31 + CD146+ endothelial cells (Figure 1C, split channel images Figure S1C (i‐iiii)).
FIGURE 1.
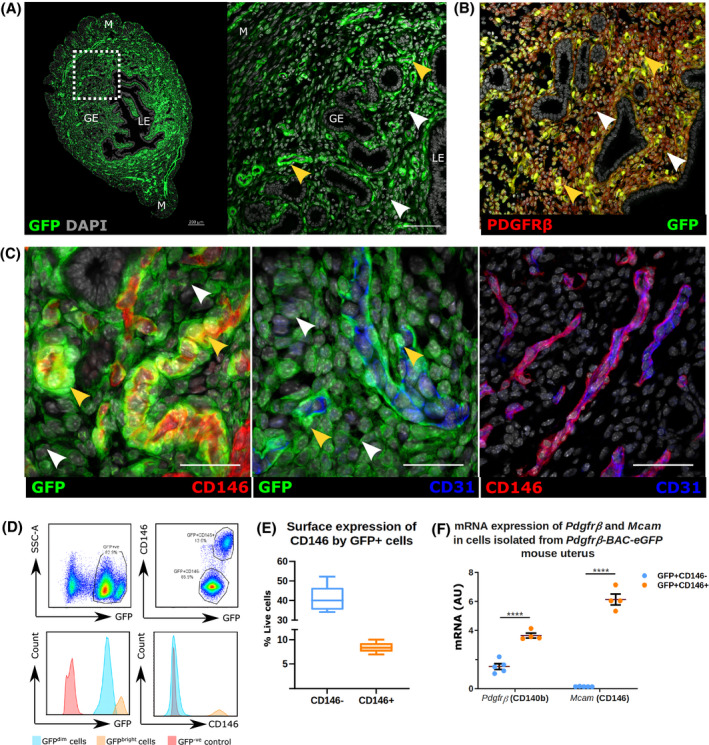
Expression of reporter protein (GFP) in the Pdgfrb‐BAC‐eGFP mouse endometrium identifies two distinct populations of mesenchymal cells. A, Localization of GFP + cells in Pdgfrb‐BAC‐eGFP mouse endometrium by immunofluorescence identifies two populations of PDGFRβ expressing cells based on the intensity of GFP staining: GFPdim cells (white arrow heads) and GFPbright cells (yellow arrow heads). GFP reporting in the endometrium of the Pdgfrb‐BAC‐eGFP mouse is strictly mesenchymal, absent from both luminal (LE) and glandular epithelial cells (GE) and smooth muscle cells of the myometrium (M). B, Immunofluorescence detection was used to confirm that expression of GFP efficiently reports that of native PDGFRβ protein whereby dual expression is detected in mesenchymal cells only. C, Further immunofluorescence detection of GFP, endothelial cell marker CD31, and putative pericyte marker CD146 revealed that GFPbright cells co‐expressed CD146 and are localized adjacent to CD31 + endothelial cells in the perivascular niche, whereas GFPdim expressing cells showed a wider distribution throughout the endometrial stroma and did not co‐express CD146. Importantly endothelial cells were found to express both CD31 and CD146. D, Flow cytometry analysis of Pdgfrb‐BAC‐eGFP mouse endometrium phenotypes two populations of live+/CD31‐/CD45‐/GFP + cells based on the intensity of fluorescence: GFPdim and GFPbright cells. GFP + cells can be further stratified based on their relative expression of CD146: GFPdimCD146‐ cells and GFPbrightCD146 + cells. E, Quantification of FC analysis reveals relative proportions of GFPdimCD146‐ cells (40.05 ± 2.25% live cells; 82.78 ± 1.29% GFP + cells) and GFPbrightCD146 + cells (8.33 ± 0.36% live cells; 17.22 ± 1.26% GFP + cells) in the mouse uterus; n = 8. (F) qPCR analysis of Pdgfrb and Mcam (CD146) mRNA expression in GFPdimCD146‐ and GFPbrightCD146 + cells isolated from Pdgfrb‐BAC‐eGFP mouse uterus. GFPbrightCD146 + cells expressed significantly higher mRNA levels of Pdgfrb and Mcam (CD146) than GFPdimCD146‐cells (FC to Actb); n = 4 (paired t‐test, ****P < .0001)
Histological findings were confirmed by FACS analysis of Pdgfrb‐BAC‐eGFP uterine tissues. After negative gating for endothelial (CD31+) and immune (CD45+) cells (Figure S2A(i‐vi), Figure S2B) the total GFP + population was separated into two subpopulations based on GFP fluorescence intensity (GFPdim and GFPbright; Figure 1D). CD146 expression followed histological findings: 40.05 ± 2.25% live cells were GFPdimCD146‐ and 8.33 ± 0.36% live cells were GFPbrightCD146+ (Figure 1D,E). Immunohistochemistry on cytospins of FACS‐sorted GFP + subpopulations confirmed that GFPdim cells were GFP + PDGFRβ+CD146‐ while GFPbright cells were GFP + PDGFRβ+CD146+ (Figure S1E), and that GFPbright cells had significantly higher expression of Pdgfrb and Mcam mRNAs than GFPdim cells (Figure 1F). We also performed preliminary analysis of uterine tissues recovered from across the estrus cycle but we detected no obvious differences in mRNA/protein expression or population distribution.
Collectively these results phenotype two subpopulations of GFP+/PDGFRβ expressing cells in the uterus of the Pdgfrb‐BAC‐eGFP mouse as GFPdimCD146‐ cells and GFPbrightCD146 + cells.
3.2. Bulk mRNA sequencing of uterine mesenchymal subpopulations from the Pdgfrb‐BAC‐eGFP mouse identifies a transcriptomic signature characteristic of perivascular cells
To investigate the transcriptomic profile and potential functional role of perivascular cells in the endometrium, GFPbright and GFPdim cells were isolated from Pdgfrb‐BAC‐eGFP uterine tissues and compared using bulk mRNA sequencing. The concentration of purified RNA from GFPbright cells was insufficient for downstream sequencing applications due to a lower number of sorted cells. Therefore, GFPtotal cells (GFPdim + GFPbright) were compared against GFPdim cells to infer the profile of GFPbright cells (GFPtotal‐GFPdim).
PCA analysis revealed that the two sample groups cluster separately, indicating distinct transcriptomic signatures that we attributed to the presence of GFPbright cells in the GFPtotal samples (Figure 2A). Differential gene expression analysis revealed 143 genes significantly upregulated in GFPtotal samples when compared to GFPdim samples (as determined by FDR). Among the most significantly upregulated were key genes Acta2, Kcnj8, Olfr78, Rgs4, Rgs5, Myh11, Abcc9, Cspg4, Sox6, Myom1, Ednra, Ednrb, Kitl, Myo1b, Olfr78, Olfr558, and Vcam1 (Figure 2B,C). Notably a clear increase in the mean CPM and LogFC of Pdgfrβ and Mcam (CD146) was confirmed in GFPtotal samples when compared to GFPdim samples (Figure 1D), consistent with the expression of such genes by GFPbright cells. The resultant GFPbright cell signature was enriched for gene ontology (GO) biological process (BP) terms relating to blood circulation, muscle cell differentiation, leukocyte migration, regulation of blood pressure, and smooth muscle contraction among others (Figure 2E). Further analysis of specific GO terms associated Cxcl10, Cxcl11, Cxcl12, Csf1, Itga2, Itga4, Ednra, and Icam1 with the regulation of leukocyte migration and Hrc, Ptgs2, Trpm4, Cnn1, Myocd, Tpm1, Pln, and Acta2 with the regulation of smooth muscle cell contraction (Figure 2F, Figure S3A‐B). Gene network analysis also highlighted core genes (leading edge subset) that were associated with multiple GOBP terms and might, therefore, have more prominent functional significance in vivo. These included Kcnj8, Acta2, Ptgs2, Rgs4, Icam1, Cxcl10, Ednra, and Ednrb (Figure S3C).
FIGURE 2.
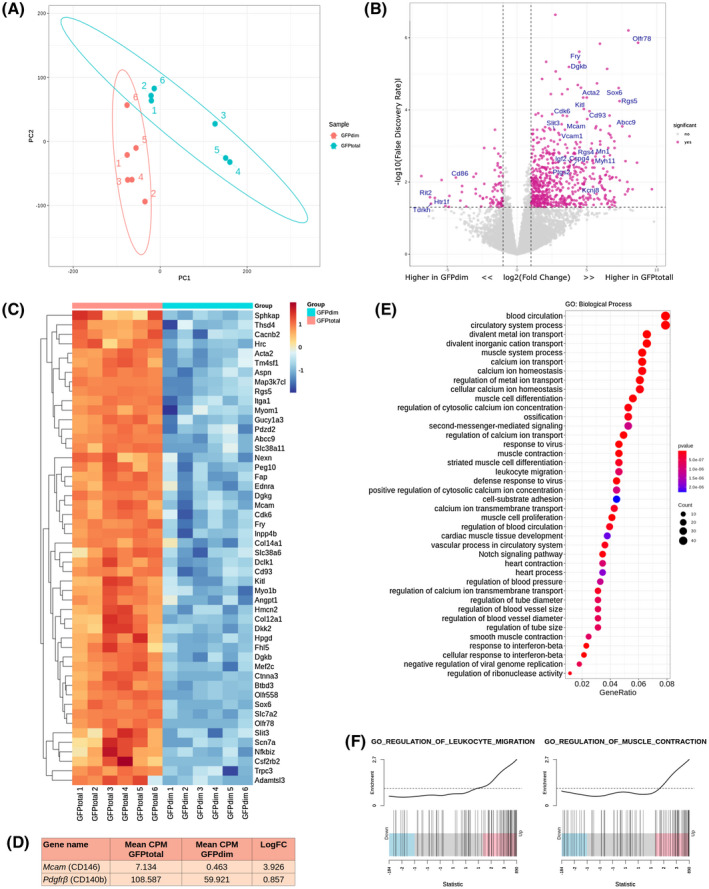
Bulk RNA sequencing of GFPtotal and GFPdim cells isolated from Pdgfrb‐BAC‐eGFP mouse endometrium infers a transcriptomic signature of GFPbright cells characteristic to that of perivascular cells. A, Principal component plot of the first and second components from PCA analysis using selected GFPtotal and GFPdim samples (n = 6). B, Volcano plot: differential gene expression between groups GFPtotal and GFPdim defining significantly upregulated or downregulated genes as those with Log2FC > 2 and log10FDR > 1. C, Heatmap: top 50 most differentially expressed genes between GFPtotal and GFPdim cells as determined by FDR. D, Table outlining the mean CPM and LogFC of target genes Pdgfrb and Mcam (CD146). E, Dot plot: gene ontology (GO) analysis of the putative perivascular cell genes to identify key biological processes (BP) attributed to the inferred GFPbright cells transcriptome; dot size: number of genes in data attributed to each GO term; dot color:P‐value representing enrichment score. F, Enrichment plots: distribution of putative perivascular cell genes associated with “regulation of leukocyte migration” and “regulation of smooth muscle cell contraction”; line peak represents the enrichment score; blue: genes under‐represented in data; and pink: genes over‐represented in data
Interestingly, genes associated with GFPbright cells including those commonly expressed by vascular smooth muscle cells (VSMCs; Acta2, Myh11, and Pln) as well as those commonly expressed by pericytes (Kcnj8, Rgs5, and Abcc9). GO analysis also identified cellular function often associated with these two cell types including blood vessel regulation, cell adhesion, cell contraction, and immune responses. These results suggest that co‐expression of Pdgfrb and Mcam (CD146) identifies a heterogeneous population of perivascular cells (GFPbright cells) which may include both VSMCs and pericytes.
3.3. Validation of genes enriched in GFPbright cells
Validation of 10 putative GFPbright‐specific genes (LogFC > 2, FDR < 0.05, Figure S4A‐B) was performed by qPCR analysis of mRNA expression in a matched set of samples (GFPtotal and GFPdim cells, Figure S4C) and an independent cohort of GFPdimCD146‐ (fibroblasts), GFPbrightCD146+ (perivascular), and CD31+ (endothelial) cells isolated from Pdgfrb‐BAC‐eGFP uterine tissues (Figure 3A). All putative perivascular cell‐associated genes were substantially expressed in GFPbrightCD146 + cells, and no expression was detected for any in GFPdimCD146‐ cells (Figure 3A). CD31 + cells expressed substantial levels of Vcam1, Mcam, and Kitl, and lower expression of Olfr78, Rgs4, Rgs5, and Kcnj8, but in all cases expression was significantly higher in GFPbrightCD146 + cells (Figure 3A). This provided further validation of the strategy employed to identify a perivascular cell gene signature.
FIGURE 3.
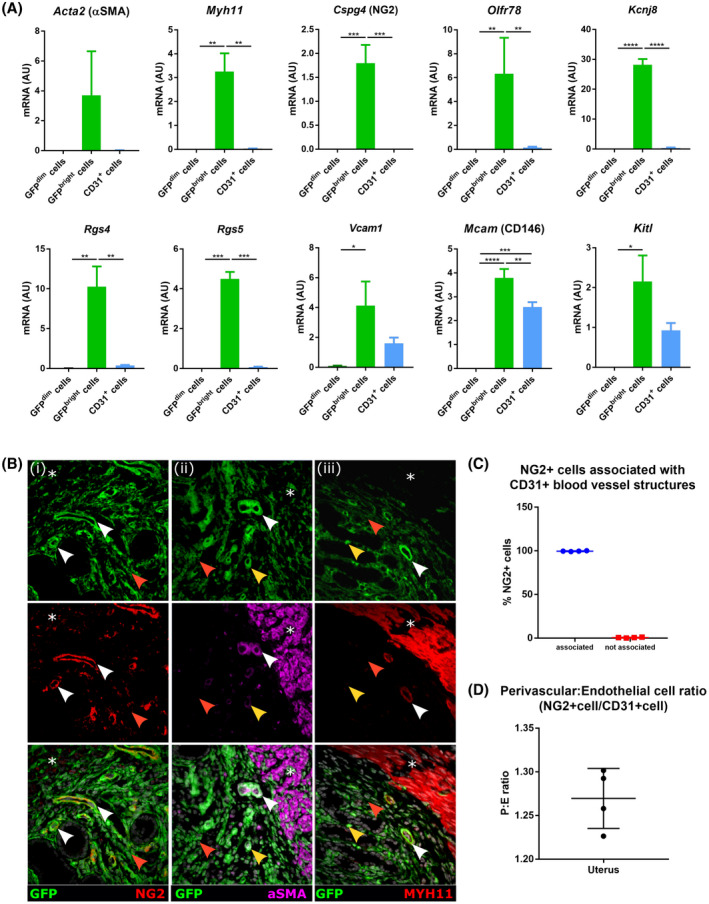
Validation of Bulk mRNA sequencing results in mouse uterine tissue samples using both qPCR and immunofluorescence. A, qPCR gene expression analysis of perivascular cell genes in GFPdim cells (n = 3), GFPbright cells (n = 3), and CD31 + cells (n = 4) isolated from Pdgfrb‐BAC‐eGFP uterine tissue. mRNA for Acta2, Myh11, Cspg4 (NG2), Olfr78, Rgs4, Rgs5, Vcam1, Mcam (CD146), Kitl, and Kcnj8 was detected in GFPbright cells and not in GFPdim cells while mRNA for Vcam1, Mcam (CD146), and Kitl was also detected in CD31 + cells (one‐way ANOVA, Holm‐Sidak's multiple comparisons test,*P < .05, **P < .01, ***P < .001, ****P < .0001). B, Analysis of GFP, NG2 (Cspg4), αSMA (Acta2), and MHY11 in Pdgfrb‐BAC‐eGFP and C57BL/6 (wild type) murine uterine tissue by immunofluorescence: (i) NG2 expression was detected in all perivascular GFPbright cells and completely absent from GFPdim cells. (ii) αSMA expression was detected in a subset of GFPbright cells most predominantly located at the endometrial/myometrial junction (white arrow heads). GFPbright cells more proximal to the lumen did not co‐express αSMA (yellow arrow heads) nor did GFPdim cells (red arrow heads). (iii) Similarly, MYH11 expression was only detected in subset of GFPbright cells located at the endometrial/myometrial junction (white arrow heads) not those more proximal to the lumen (yellow arrow heads) or GFPdim cells (red arrow heads). Smooth muscle cells of the myometrium expressed both αSMA and MYH11 but not NG2 ((i‐iii) asterisk) (representative images; n = 4). C‐D, Quantification of NG2 + perivascular and CD31 + endothelial cells mouse uterine tissue sections: (C) number of NG2 + perivascular cells associated with CD31 + blood vessel structures; and (D) ratio of number of NG2 + perivascular cells to CD31 + endothelial cells (n = 4)
3.4. Identification of proteins associated with the GFPbright cell signature in tissue sections
Immunoexpression of Cspg4 (NG2), Acta2 (αSMA), and Myh11, revealed NG2 was expressed ubiquitously and exclusively by GFPbright cells in endometrium (Figure 3B(i); white arrow heads). Interestingly, αSMA (Acta2) was detected in a subset of GFPbright cells located predominantly at the endometrial/myometrial junction in the basal endometrium (Figure 3B(ii); white arrow heads). GFPbright cells proximal to the endometrial lumen but did not express αSMA (Figure 3B(ii); yellow arrow heads). A similar pattern of expression was observed when examining MYH11 (Figure 3B(iii)). Importantly, NG2, αSMA, and MYH11 were not detected in GFPdim cells (Figure 3B(i‐iii); red arrow heads) but αSMA and MYH11 were both present in smooth muscle cells of the myometrium (Figure 3B(ii‐iii); asterisk). These results confirmed heterogeneity within the GFPbright cell population dependent upon location: αSMA+/MYH11+/NG2 + cells located around basal blood vessels and were likely VSMCs, while αSMA‐/MYH11‐/NG2 + cells were more proximal to the lumen and likely represent pericytes.
Only NG2 expression was specific/exclusive to all the perivascular cells in the mouse endometrium and was, therefore, used to determine the relationship between perivascular cells (NG2 + cells with visible nucleus) and endothelial cells (CD31 + cells with visible nucleus). All NG2 + cells were located in close proximity to CD31 + endothelial cells (100 ± 0.24%; Figure 3C) and the ratio NG2:CD31 expressing cells was calculated to be 1.25:1 (±0.02) (Figure 3D).
3.5. Deconvolution of the mouse uterus by single‐cell RNA sequencing identifies five distinct subpopulations of mesenchymal cells present in the endometrium during homeostasis
Bulk RNA sequencing identified a transcriptomic profile of GFPbright cells similar to that of both VSMCs and pericytes suggesting heterogeneity within this cell population. To extend these findings and analyze the full range of cells within the uterine mesenchyme, we performed single‐cell RNA sequencing (scRNA‐seq) on the GFP + cell fraction recovered from the Pdgfrb‐BAC‐eGFP mouse uterus (n = 4 mice). Sequencing detected 6,379 individual cells with 71,067 mean reads per cell equating to 1,847 median genes per cell.
Unsupervised clustering based on principal components of the most variably expressed genes partitioned cells into six individual clusters (Figure 4A). Expression of signature genes associated with known endometrial cell phenotypes identified five of the six clusters as mesenchymal cells (positive for Pdgfrb, Vim, and Des; Figure 4C(i)), two of which showed preferential expression of canonical perivascular markers including Mcam (CD146), Acta2 (αSMA), and Cspg4 (NG2) (Figure 4C(ii)), and the remaining three showing preferential expression of canonical fibroblast markers such as Cd34, Pdgfra, and Mfap5 (Figure 4C(iii)). The final cluster was found to express genes typical of epithelial cells (Cdh1, Epcam, and Krt18; Figure 4C(iv)). We labeled the six subpopulations as Pdgfrb + Mcam‐ fibroblasts (F1, F2, F3), Pdgfrb + Mcam + perivascular cells (P; pericytes, V; VSMCs), and a small population of Pdgfrb‐Mcam‐ epithelial cells (E) suspected to represent contamination at the time of cell purification.
FIGURE 4.
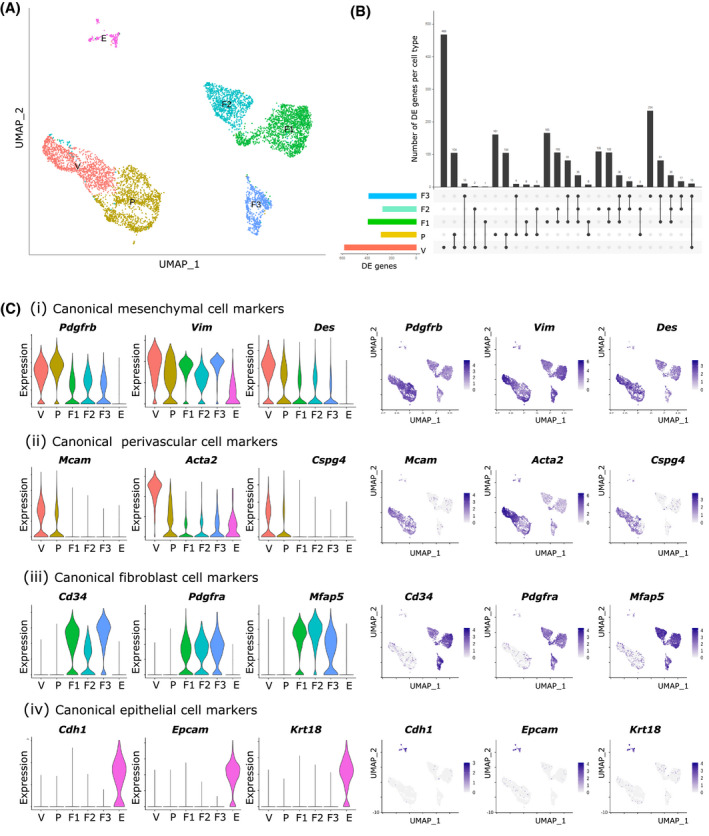
Single‐cell RNA sequencing analysis of total GFP + cells isolated from Pdgfrb‐BAC‐eGFP mouse uterine tissue reveals a previously unidentified heterogeneity within the murine endometrial mesenchyme during homeostasis. A, Uniform manifold approximation and projection (UMAP) visualization: 6,379 GFP + mesenchymal cells isolated from Pdgfrb‐BAC‐eGFP mouse uterine tissue (n = 4 mice estrus phase; median nGENE = 1847, nUMI = 4316; cells filtered by three QC covariates: nFeature_RNA > 200 & <4000, percent.mito <0.5, percent.ribo <0.5) cluster into six distinct subpopulations. B, Upset plot: visualization of the intersection between gene lists for each cell cluster: each bar represents a set of genes; each row represents a cell cluster; individual dots represent a gene set unique to that cell cluster while connected dots represent gene sets that are shared between cell clusters. The top five intersections per cluster were evaluated. C, (i‐iv) Violin plots and UMAP visualizations: expression of gene signatures associated with known cell types present in the endometrium used to infer cell lineages for each cell cluster: (i) canonical mesenchymal cell markers Pdgfrb, Vim, and Des; (ii) canonical perivascular cell markers Mcam (CD146), Acta2 (αSMA), and Cspg4 (NG2); (iii) canonical fibroblast cell markers Cd34, Pdgfra, and Mfap5; and (iv) canonical epithelial cell markers Cdh1, Epcam, and Krt18. Expression patterns identified three populations of stromal fibroblasts, two populations of perivascular cells (pericytes, vascular smooth muscle cells (VSMCs)), and a small contaminating population of epithelial cells. Fibroblasts 1 (F1), 2 (F2), and 3 (F3) to have low expression of Pdgfrb (representative of GFPdim fraction) while pericytes and VSMCs have high expression of Pdgfrb and co‐expression of Mcam (representative of GFPbright fraction).
Differential gene expression analysis revealed a high degree of similarity between putative VSMCs (V) and pericytes (P) and between the three fibroblast clusters (F1, F2, and F3) (Figure 4B, Figure 5A). Importantly, a unique signature can be deciphered for each cell cluster revealing target genes specifically attributed to each individual cell type. Genes expressed preferentially by VSMCs include Myh11, Tagln, Cnn1, and Kitl (Figure 5B(i)); pericytes include Kcnj8, Myob1, Abcc9, and Ednrb (Figure 5B(ii)); F1 include Aspg, Dpep1, Ngfr, and Angptl7 (Figure 5B(iii)); F2 include Cxcl14, Cdh11, Wt1, and Rgs2 (Figure 5B(iv)); and F3 include Clec3b, Fap, Cd55, and Vit (Figure 5B(v)).
FIGURE 5.
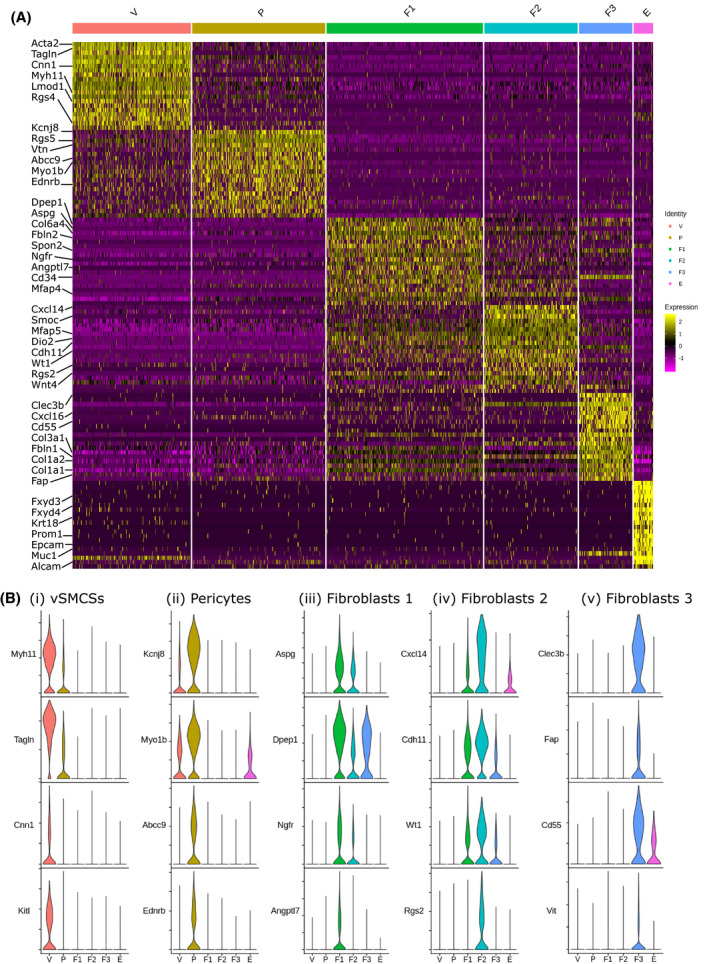
Single‐cell RNA sequencing identifies five transcriptionally discrete populations of mesenchymal cells in the GFP + fraction of Pdgfrb‐BAC‐eGFP mouse uterine tissue. A, Scaled heatmap (yellow, high; purple, low) displaying differentially expressed genes per cluster when compared to all other clusters (top is color coded and named by cluster; V = vascular smooth muscle cells (VSMC), P = pericytes, F1 = fibroblasts 1, F2 = fibroblasts 2, F3 = fibroblasts 3, E = epithelial cells). The expression of top 20 exemplar genes (rows) in each cell (column) is displayed. B, Violin plot: identification of genes preferentially expressed by each cell cluster using the Wilcoxon rank‐sum test (Seurat: “FindAllMarkers”): (i) Myh11, Tagln, Cnn1, and Kitl by VSMCs (V); (ii) Kcnj8, Myob1, Abcc9, and Ednrb by pericytes (P); (iii) Aspg, Dpep1, Ngfr, and Angptl7 by fibroblasts 1 (F1); (iv) Cxcl14, Cdh11, Wt1, and Rgs2 by fibroblasts 2 (F2); Clec3b, Fap, Cd55, and Vit by fibroblasts 3 (F3)
This analysis reveals that in the Pdgfrb‐BAC‐eGFP mouse uterus GFPdim cells are represented by three subpopulations of fibroblasts while the GFPbright cells are a mixture of pericytes and VSMCs.
3.6. Gene ontology enrichment analysis reveals functional heterogeneity within the mesenchymal cell subpopulations of the endometrium during homeostasis
Differential gene expression analysis between VSMC (V) and pericyte (P) cell clusters identified genes that can be attributed to each distinct cell cluster (V: n = 246, P: n = 63) and those common to both (n = 127) (Figure 6A‐B). Gene ontology (GO) analysis revealed functional terms enriched by the transcriptomic profile of each individual cell cluster. GOBP enriched across both perivascular cell populations included circulatory system process, cell‐substrate adhesion, and regulation of actin filament‐based process (Figure 6C). GOBP enrichment terms associated with the VSMC gene signature included muscle cell development, differentiation, and contraction and the regulation of blood circulation while those associated with the pericyte gene signature included ECM organization, smooth muscle cell migration, defense response to virus, and response to interferons (Figure 6C). These results are consistent with those of the bulk mRNA sequencing study. Leading‐edge analysis defined the core set of genes responsible for the enrichment of the top 10 GO terms associated with VSMCs (Figure S6A(i)) and pericytes (Figure S6B(i)). Genes that were both highly expressed and part of the leading edge/core subset for multiple GO terms were hypothesized to have biological relevance: VSMC‐associated genes included Pln, Lmod1, and Sorbs2 (Figure S6A(ii‐iii)); pericyte‐associated genes included Vtn, Nrp1, and Ifitm1 (Figure S8B(ii‐iii)).
FIGURE 6.
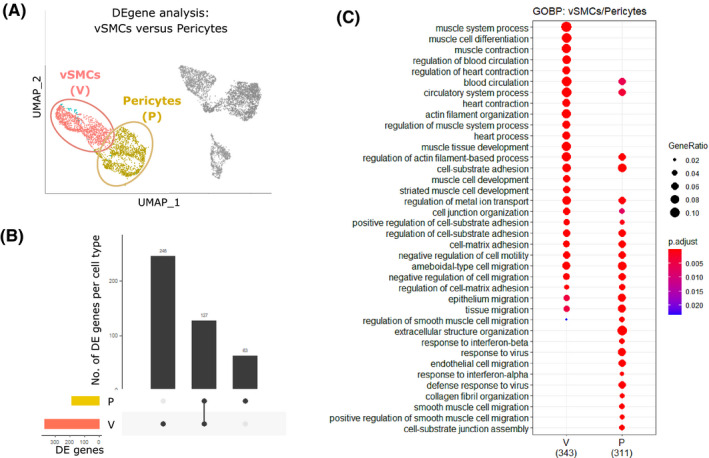
Gene ontology enrichment analysis reveals functional differences between two discrete perivascular subpopulations identified through single‐cell RNA sequencing of mouse uterus. A, UMAP visualization: differential gene expression analysis carried out between VSMCs (V) and pericytes (P) to identify specific transcriptomic signatures. B, Upset plot: visualization of the intersection between gene lists for the VSMC (V) and pericyte (P) showing the number of genes that can be attributed to each cell cluster individually (V: n = 246, P: n = 63) and those common to both (n = 127). C, Dot plot: GO enrichment terms relating to biological processes (BP) associated with the signatures corresponding to the two discrete perivascular cell populations (V; P); dot size: number of genes in data/number of genes associated with GO term (gene ratio); dot color:P‐value representing the enrichment score
Similarly, differential gene expression analysis between the three fibroblasts subpopulations (F1, F2, and F3) revealed genes that can be attributed to each cell cluster individually (F1: n = 58, F2: n = 54, F3: n = 132) and those common to all (n = 120) or shared by various pair groups (F1 and F2: n = 77, F1 and F3: n = 48, F2and F3: n = 8) (Figure 7A‐B). Gene signatures that defined the fibroblast subpopulations were found to enrich for discrete GOBP functional terms: F1 enriched for the regulation of immune responses, response to interferons, and antigen presentation; F2 enriched for reproductive structure development, response to wounding, and tissue morphogenesis; and F3 enriched for ECM production, connective tissue development, and collagen deposition (canonical fibroblast functions) (Figure 7C). Leading‐edge analysis defined the core set of genes responsible for the enrichment of the top 10 GO terms associated with F1 (Figure S7A(i)), F2 (Figure S7B(i)), and F3 (Figure S7C(i)). Genes that were both highly expressed and part of the leading edge/core subset for multiple GO terms were hypothesized to have biological relevance: F1‐associated genes included Ifit1, Ifit3, and H2‐Q7 (Figure S7A(ii‐iii)); F2‐associated genes included Smoc2, Wnt4, and Aldh1a2 (Figure S7B(ii‐iii)); and F3‐associated genes included Col14a1, Mmp3, and Efemp1 (Figure S7C(ii‐iii)).
FIGURE 7.
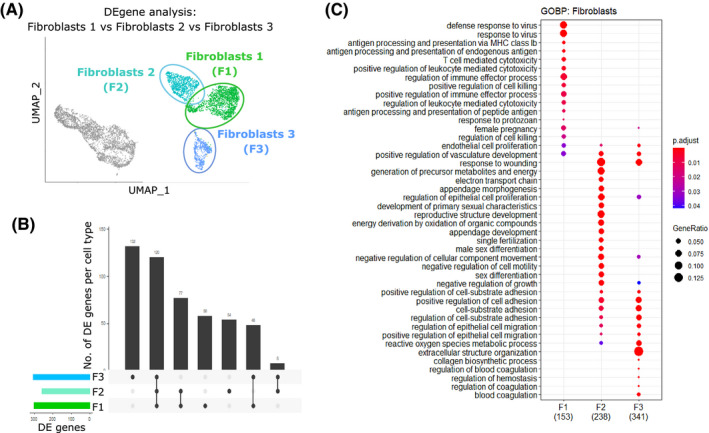
Gene ontology enrichment analysis reveals functional differences between three discrete fibroblast subpopulations identified through single‐cell RNA sequencing of mouse uterus. A, UMAP visualization: differential gene expression analysis carried out between three distinct fibroblasts subpopulations (F1, F2, and F3). B, Upset plot: visualization of the intersection between gene lists for the three subpopulations of stromal fibroblasts (F1, F2, and F3) showing the number of genes that can be attributed to each cell cluster individually (F1: n = 58, F2: n = 54, and F3: n = 132) and those common to all (n = 120) or shared by group pairs (F1&F2: n = 77, F1&F3: n = 48, and F2&F3: n = 8). C, Dot plot: GO enrichment terms relating to biological processes (BP) associated with the signatures corresponding to the three discrete fibroblast populations (F1, F2, and F3); dot size: number of genes in data/number of genes associated with GO term (gene ratio); dot color:P‐value representing the enrichment score
3.7. Immunolocalization of putative marker proteins associated with the five putative subpopulations of mesenchymal cells in the mouse endometrium
Immunohistochemistry was used to validate the expression of proteins encoded by candidate mRNAs expressed by each of the five Pdgfrb + mesenchymal cells subpopulations: CNN1 (VSMCs), KCNJ8 (pericytes), PDGFRα (all fibroblasts), NGFR (fibroblasts 1), CXCL14 (fibroblasts 2), and CLEC3B (fibroblasts 3).
CNN1 and KCNJ8 were co‐localized to subsets of GFPbright cells in Pdgfrb‐BAC‐eGFP uterine tissues (Figure S8A‐B; yellow arrows). In agreement with data shown in Figure 3 which identified a population of aSMA+/MYH11 + cells surrounding blood vessels in the basal region of the endometrium CNN1 + KCNJ8‐ cells were identified around vessels at the endometrial/myometrial junction (Figure 8A(i); white arrows) and in the myometrium itself (Figure 8A(i); M). In contrast cells characterized as CNN1‐KCNJ8 + cells were identified surrounding blood vessels throughout the stroma including close to the endometrial lumen (Figure 8A(ii); yellow arrows). Interestingly, a small population of CNN1 + KCNJ8+ cells also existed around select vessels in the basal region of the stroma, although the expression of both markers was significantly dimmer (Figure 8A(i); red arrows). This novel data identifies spatially distinct subpopulations of perivascular cells in the mouse endometrium that can be distinguished by relative CNN1/KCNJ8 expression. We propose that CNN1 + KCNJ8‐ cells represent VSMCs located around large basal blood vessels while CNN1 + KCNJ8+ and CNN1‐KCNJ8 + cells are pericytes located around smaller vessels throughout the tissue (summarized in Table S4). The functional significance of this topography and whether this relates to different types of blood vessels remains to be definitively investigated.
FIGURE 8.
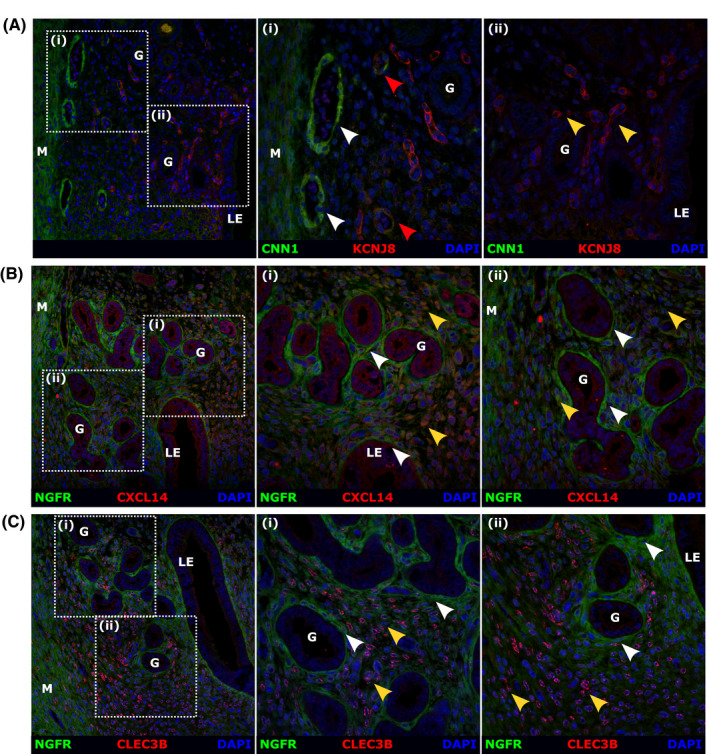
Detection of proteins associated with the five distinct subpopulations of mesenchymal cells present in the mouse uterus by immunofluorescence. A, Analysis of expression and/or co‐expression of putative VSMC marker CNN1 and putative pericyte marker KCNJ8 in mouse endometrium. (i) CNN1 + KCNJ8‐ cells were detected around vessels at the endometrial/myometrial junction in the basal endometrium and in the myometrium itself (white arrows; M). A smaller population of CNN1 + KCNJ8+ cells (dim expression of both markers) were located in close proximity to the myometrium (red arrows). (ii) CNN1‐KCNJ8 + cells were detected around vessels located throughout the stroma more proximal to the endometrial lumen (yellow arrows; LE). B, Analysis of expression and/or co‐expression of putative fibroblast 1 marker NGFR and putative fibroblast 2 marker CXCL14 in mouse endometrium. (i‐ii) NGFRhighCXCL14low cells were detected in the sub‐epithelial space beneath both luminal and glandular epithelial cells (white arrows, LE, G). NGFRlowCXCL14high cells were detected in adjacent cells and in the stroma proximal to the endometrial lumen (yellow arrows). C, Analysis of expression and/or co‐expression of putative fibroblast 1 marker NGFR and putative fibroblast 3 marker CLEC3B in mouse endometrium. (i‐ii) NGFR + CLEC3B‐ cells were detected in the sub‐epithelial space beneath both luminal and glandular epithelial cells (white arrows, LE, G). NGFR‐CLEC3B + cells were detected identified throughout the stroma and most densely populated close to the myometrium (yellow arrows, M) (representative images, n = 8, M = myometrium, LE = luminal epithelium, G = glands)
In agreement with transcriptional analysis PDGFRα was ubiquitously expressed by GFPdim cells (Figure S8(C); white arrows) and was not detected in GFPbright cells (Figure S8(C); yellow arrows), confirming PDGFRα as a useful pan‐specific marker of endometrial fibroblasts. Similarly, the expression of putative fibroblast subset markers NGFR, CXCL14, and CLEC3B co‐localized to subsets of GFPdim cells (Figure S8D‐F; white arrows) in Pdgfrb‐BAC‐eGFP uterine tissues, as predicted. A population of NGFRhighCXCL14low cells were found to reside primarily in close association with epithelial cells in both luminal and glandular compartments (Figure 8B(i‐ii); white arrows). NGFRlowCXCL14high expression was detected in neighboring cells throughout the stroma located near the endometrial lumen (Figure 8B(i‐ii); yellow arrows)). In addition, a population of NGFR‐CLEC3B + cells was identified throughout the stroma, which appeared not to overlap with the sub‐epithelial NGFR + CLEC3B‐ cells (Figure 8C(i‐ii); white and yellow arrows, respectively), and most densely populated close to the myometrium (Figure 8C; M). Based on this immunostaining and RNAseq analysis, we propose that fibroblasts 1 can be identified as NGFRhighCXCL14low sub‐epithelial fibroblasts, fibroblasts 2 represent NGFRlowCXCL14high stromal fibroblasts, and fibroblasts 3 represent a completely distinct population of NGFR‐CLEC3B + basal stromal fibroblasts (summarized in Table S4).
4. DISCUSSION
In this study, we provide the first definitive analysis of mesenchymal cells in the adult mouse endometrium identifying five subpopulations of cells including closely related populations of pericytes and VSMC as well as three subpopulations of fibroblasts. Bioinformatics revealed that pericytes and VSMC shared functions associated with the circulatory system, actin‐filament process, and cell adhesion and distinct roles for subpopulations of fibroblasts in regulation of immune responses, response to wounding, and organization of extracellular matrix. These data provide the platform for comparisons between mesenchymal cells in endometrium, a tissue that exhibits remarkable resilience and regeneration, and other adult tissues such as liver which are prone to fibrosis.
In uterine tissue recovered from cycling Pdgfrb‐BAC‐eGFP transgenic mice, we established that GFP expression was specific to the stroma and identical to endogenous PDGFRβ protein. These results were consistent with the pattern of expression already described in uninjured male mouse liver which recorded co‐expression of a Pdgfrb‐driven reporter protein and endogenous PDGFRβ in hepatic stellate cells. 21 The intensity of the GFP signal was not homogeneous, with two discrete cell populations (GFPbright and GFPdim) easily distinguished in tissue sections. GFPdimCD146‐ were located throughout the stroma but GFPbrightCD146 + cells were only found in close proximity to CD31 + endothelial cells. In human endometrium, stem‐like progenitors have been identified in a perivascular location based on PDGFRβ and CD146. 19 We, therefore, conducted further studies to determine if the GFPbright cells were the mouse equivalent of these human cells.
Bulk mRNA sequencing combined with bioinformatics analysis identified genes upregulated in the GFPbright cells including those previously reported as being expressed by VSMCs and/or pericytes such as Mcam (CD146), Acta2 (αSMA), Myh11, Olfr78, Rgs4, Rgs5, Cspg4 (NG2), Vcam1, Kitl, and Kcnj8. 27 , 28 , 29 , 30 A previous transcriptomic analysis (by gene array) of human putative endometrial mesenchymal PDGFRβ + CD146+ cells compared to stromal fibroblasts (PDGFRβ + CD146‐) also identified a gene signature they reported as similar to that of pericytes. 27 Notably, there was clear overlap between genes identified in these human cells and those we identified in the mouse GFPbright cells. GOBP terms enriched by the GFPbright gene signature highlighted functions such as muscle cell contraction, regulation of blood circulation, and regulation of leukocyte migration, consistent with functions previously ascribed to perivascular smooth muscle cells and/or pericytes.
Validation experiments using purified cells revealed that putative perivascular cell mRNAs including Mcam, Vcam1, and Kitl were also expressed by CD31 + endothelial cells. In contrast, expression of Acta2 (αSMA), Myh11, Olfr78, Kcnj8, Cspg4 (NG2), Rgs4, and Rgs5 appeared to be specific to GFPbright cells and importantly not detectable in either stromal (GFPdimCD146‐) or endothelial (CD31+) cells. Immuno‐analysis of the pericyte/VSMC‐specific proteins Cspg4 (NG2), αSMA (Acta2), and MYH11 31 , 32 , 33 found that NG2 was expressed by GFPbright cells throughout the endometrium, whereas αSMA and MYH11 were only detected in a subset of the GFPbright cells located at the endometrial/myometrial junction. We propose NG2 (Cspg4) should be used to identify perivascular cells in mouse endometrium in preference to CD146 (Mcam) alone or in combination with PDGFRβ+. These findings also call into question interpretation of results in previous genomic studies which attributed a mixture of VSMC/pericyte genes and associated functions to putative endometrial pericytes. 27 , 34
Tissue analysis of CD31 + and Cspg4/NG2 + cells revealed that every NG2 + cell was co‐located with a CD31 + endothelial cell consistent with them occupying a perivascular niche. The ratio of NG2:CD31 expressing cells was calculated to be 1.25:1 (±0.02). In the literature, pericyte coverage of blood vessels is described as dense or sparse and is thought to be related to the extent of substance transfer between blood vessels in different tissues. For example, the retina has a high ratio of 1:1 while the peripheral vasculature has a low ratio of 1:100. 35 A higher ratio is believed to be related to greater regulation of blood flow and more frequent remodeling of micro‐vessels. 35 Co‐culture studies have shown that a 1:1 pericyte:endothelial cell ratio significantly inhibits endothelial cell proliferation when compared to a ratio of 1:10 or 1:20, believed to be due to an inability of pericytes to communicate with the increasing number of endothelial cells. 36 Our result suggests endometrial vasculature in the mouse has a dense coverage of perivascular cells which may indicate they play a role in stabilization of vessels or limiting transfer from the blood.
To further understand and dissect cellular heterogeneity within the endometrial mesenchyme we performed single‐cell RNA sequencing on the total population of GFP + endometrial cells. Unsupervised cluster analysis of the resulting dataset identified six distinct clusters, five of which were classified as mesenchyme (GFP+/Pdgfrb+) with a small sixth cluster representing contaminating Pdgfrb‐ epithelial cells. Of the mesenchyme clusters, two closely related clusters were Pdgfrbhigh /Mcam+, equivalent to GFPbright cells, while three distinct clusters of Pdgfrblow /Mcam‐ (GFPdim equivalent) cells were also observed. In contrast to previous genomic studies, 27 , 34 gene signatures that distinguish between endometrial VSMCs and pericytes have been identified here. Immunoanalysis of candidate markers CCN1 and KCNJ8 found that CNN1 + KCNJ8‐ cells were located exclusively around large vessels at the endometrial/myometrial junction and in the myometrium itself. This was reflective of previous IHC results of αSMA and MHY11, confirming CNN1 + KCNJ8‐ cells as classical smooth muscle cells: VSMCs and myometrial myocytes in the mouse uterus. CNN1 + KCNJ8+ cells and CNN1‐KCNJ8 + cells were also detected in the tissue, surrounding smaller vessels throughout the stroma, distal, and proximal to the endometrial lumen, respectively. A phenotypic continuum from pericytes to smooth muscle cells dependent on the type of vessel they are associated with, has been previously described. 37 Current results suggest distinct phenotypes in the perivascular cell continuum can be distinguished by relative expression of CNN1 and KCNJ8 and highlight KCNJ8 as a novel and exclusive marker of endometrial pericytes which occupy a distinct perivascular niche to classic VSMCs. Immunohistochemical validation of sequencing datasets has uncovered exclusive markers that could be used to specifically target perivascular cells together (NG2) or indeed as separate populations: pericytes (KCNJ8); VSMCs (CNN1). Uncovering such heterogeneity will allow for future studies to be designed appropriately in order to target each population separately and avoid results that are due to a mixed cell response.
The unexpected heterogeneity within the Pdgfrblow/Mcam‐ cells, consistent with the existence of three fibroblasts subpopulations (F1, F2, and F3), prompted further analysis as human endometrial stromal fibroblasts (eSFs) are usually considered a homogenous population of cells with a shared set of functions in endometrial physiology. A role for human eSFs in modulating the immune response has been described using an in vitro co‐culture system. 38 More recently, using an elegant multi‐omics profiling and integrative bioinformatics approach, an important role for so called structural cells (endothelial, epithelial cells, and fibroblasts) in immune cell regulation has been confirmed in 12 organs of the mouse, during both homeostasis and in response to immunological challenges. 39 Notably, although this study did not include reproductive tissues such as the uterus, many of the identified immune genes and associated GOBP terms are reflected in our scRNA‐seq results, primarily enriched in F1 (defense response to virus, cellular response to IFNg, antigen processing and presentation). Our results further suggest that such roles can be attributed to specific subpopulations of cells, something that is not accounted for by methods employed by Krausgruber et al However, both reports highlight that structural cell populations may have previously underappreciated roles in tissue homeostasis out with the typical barrier/connective tissue functions. 39
Comparative single‐cell analysis of stromal cells from primary cultures and biopsies of human endometrium has identified many differences suggesting cultured cells may not represent the full range of in vivo phenotypes. 40 This potentially undermines the relevance of results obtained using cultured cells alone. ScRNA‐seq has been used to investigate changes in stromal cell fibroblasts during the process of decidualization in women with time‐dependent changes in gene signatures identified in fibroblasts as they transformed into decidual cells. 41 However, scRNA‐seq performed on ~3000 cells from an endometrial biopsy defined only a single “fibroblast” cluster which had a genetic signature implicated in angiogenesis and wound healing. This study noted that stromal fibroblasts upregulated immunomodulatory genes during decidualization including IL15, consistent with previous reports that fibroblast/decidual cells‐derived factors play a key role in immune cell recruitment. 42 Heterogeneity within the stromal fibroblast population of the human biopsies was not reported probably because too few cells were present in the pooled cell samples. In a recent paper that used 2148 single cells from 19 healthy human endometria from across the menstrual cycle all fibroblasts were assigned to a single‐cell cluster with additional dimensional analysis separating a separate smooth muscle cell cluster identified by expression of Acta2 and Notch3 and sharing of Mcam with a population of endothelium. 43 In the current study we were able to target our analysis to a purified population of 5000 GFP+/PDGFRβ + cells detecting 18,000 unique genes and this allowed us to identify five populations of cells including a VSMC cluster that expresses Acta2 and Mcam with the latter also in a population we identified as pericytes which did not appear to be separated in this human endometrial study. We speculate that separation and analysis of larger numbers of stromal cells from human tissues may be necessary before we can identify populations equivalent to mouse pericytes and fibroblasts F1, F2, and F3. Complementary studies using putative markers in combination with immunohistochemistry are also required.
In recent years there has been a massive increase in the range of tissues from mouse and other species analyzed using scRNA‐seq technologies. Many datasets are available, including those hosted by EMBL‐EBI, 44 the single‐cell expression atlas: [https://www.ebi.ac.uk/gxa/sc/home], 45 and a single‐sell atlas generated by Han et al 46 ; https://www.ncbi.nlm.nih.gov/geo/query/acc.cgi?acc=GSE108097). Unfortunately, the Tabula Muris did not include any reproductive tissues in the 20 reported in their 2018 publication (Tabula Muris, Overall et al 2018). However, Han and colleagues reported single‐cell analysis of 3761 cells from the mouse uterus with identification of 19 cell clusters. Cross‐comparison between stromal cells and tissue‐resident macrophages isolated from uterus and other tissues suggested they had a unique and distinct signature but no further validation was provided (see figure 6 in 46).
We believe the data described in our study is the first comprehensive analysis of mouse endometrial mesenchyme in the adult mouse generated using scRNA‐seq. To extend the sequence data immunostaining using antibodies specific to mRNAs that appeared enriched or specific to different cell populations was carried out. Notably immunostaining for NGFR (F1) and CXCL14 (F2) revealed two closely related but spatially distinct populations of fibroblasts: sub‐epithelial NGFRhighCXCL14low fibroblasts (F1) and NGFRlowCXCL14high fibroblasts (F2) in adjacent stromal spaces with closer proximity to the lumen. In contrast, a discrete population of NGFR‐CLEC3B + fibroblasts was present in with cells appearing most densely populated in the “basal” space near to the myometrium. Using similar techniques, Saatcioglu et al investigated gene signatures in the immature mouse uterus on postnatal day 6 of both controls and those treated with Mullerian Inhibiting Substance (MIS/AMH 47 ). The authors identified two closely related populations of stromal cells which they designated as “inner” and “outer” depending on proximity to the endometrial lumen. Interestingly, although the tissue they used was immature and total uterine tissue was analyzed, there is notable overlap between stromal candidate gene markers we discovered and those in their dataset. For example, genes detected in cells they designated as the “inner stroma” included those preferentially expressed by our F2 population (Nkd2, Wnt4, and Bmp7) and by both F1 and F2 (Cdh11, Fn1, and Plac8). In contrast genes detected in cells of the “outer stroma” included those we identified as preferentially expressed by our F3 (Col4a5, Col6a3, Apoe, and Dpt) and F1 (Slc26a7 and Islr) populations. Given this novel topographical distribution of endometrial fibroblast subpopulations, we propose that the F1 population can be characterized as NGFRhighCXCL14low sub‐epithelial fibroblasts, F2 can be identified as NGFRlowCXCL14high “inner” stromal fibroblasts while F3 represent a completely discrete population of NGFR‐CLEC3B+ “outer” basal stromal fibroblasts (Table S4). This is the first and exciting step in validating the newly identified fibroblasts subpopulations in the mouse uterus and provides the foundation for future studies exploring their specific roles in endometrial tissue function.
5. CONCLUSION
The current study has used immunohistochemistry, flow cytometry, qRT‐PCR, and sequencing methods to shed new light on heterogeneity within mesenchymal cells in mouse endometrium. We have demonstrated that although PDGFRβ and CD146 are reported to be ubiquitously expressed by pericytes in a wide range of tissues 36 in endometrium they are not exclusive to this cell type. We propose that NG2 (Cspg4) is a more specific and exclusive marker of endometrial cells residing in the perivascular niche (VSMC/pericytes) in mice.
Our scRNA‐seq analysis revealed novel heterogeneity in the endometrial mesenchyme with identification of cell‐specific markers that were validated using immunohistochemistry (summarized in Figure 9). We believe these data provide a platform for comparison between single‐cell data from endometrium, a tissue that exhibits remarkable resilience and is not prone to fibrotic transformation and other tissues such as liver, 48 , 49 lung, 50 and kidney, 51 , 52 in which the role of fibroblasts in fibrotic responses has been studied. Importantly they also enhance our capacity for in vivo targeting and lineage tracing of defined subpopulations of cells within the endometrial stroma to inform our understanding of their role(s) in endometrial function.
FIGURE 9.
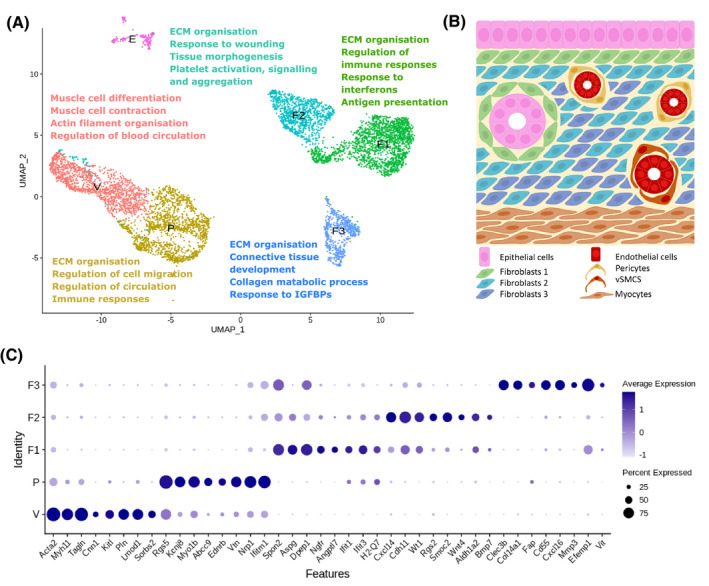
Single‐cell sequencing analysis identifies five transcriptomically, functionally, and topographically discrete subpopulations of PDGFRβ + mesenchymal cells in the mouse endometrium. A, UMAP visualization: summary of distinct biological functions associated with mesenchymal cell subpopulation gene signatures as determined by scRNA‐seq (V: VSMCs, P: pericytes, F1: fibroblasts 1, F2: fibroblasts 2, and F3: fibroblasts 3). B, Schematic: hypothesized topography of discrete mesenchymal cell subpopulations as informed by immunofluorescence. C, Dot plot: exemplar genes identified through phenotypic and functional analyses of transcriptomic signatures that are preferentially expressed by each individual cell cluster (VSMCs (V): Acta2, Myh11, Tagln, Cnn1, Kitl, Pln, Lmod1, and Sorbs2; pericytes (P): Rgs5, Kcnj8, Myo1b, Abcc9, Ednrb, Vtn, Nrp1, and Ifitm1; fibroblasts 1 (F1): Spon2, Aspg, Dpepe1, Ngfr, Angptl7, Ifit1, Ifit3, and H2‐Q7; fibroblasts 2 (F2): Cxcl14, Cdh11, Wt1, Rgs2, Smoc2, Wnt4, Aldh1a2, and Bmp7; fibroblasts 3 (F3): Clec3b, Col14a1, Fap, Cd55, Cxcl16, Mmp3, Efemp1, and Vit; epithelial cells (E): Cdh1, Epcam, Krt7, Krt18, Muc1, Muc4, Prom1, and Alcam. Dot size: percentage of cells expressing the gene; dot color:average expression of gene
CONFLICT OF INTEREST
The authors declare that there is no conflict of interest.
AUTHOR CONTRIBUTIONS
PMK, NCH, and PTKS designed the research; PMK, DAG, OK, and AE‐Z performed the research; PMK, DAG, JRS, JRW‐K, and RD analyzed the data; PMK, DAG, JRW‐K, RD, NCH, and PTKS wrote the paper; PMK, NCH, and PTKS funded the research.
Supporting information
Fig S1‐S8
Table S1‐S4
ACKNOWLEDGMENTS
Funding for this research was provided by a MRC PhD Studentship in Tissue Repair and a MRC Transition Fellowship to PMK funded by a Doctoral Training Award to the University of Edinburgh (MR/N013166/1); DAG and AZ‐E were funded by a MRC Programme Grant to PTKS (MR/N024524/1); JRS was supported by a Wellcome Trust funded Edinburgh Clinical Academic Track (ECAT) Fellowship; and NCH was supported by a Wellcome Trust Senior Research Fellowship in Clinical Science (219542/Z/19/Z). The authors thank the staff supporting core facilities including flow cytometry and animal husbandry for their support and guidance. The authors are grateful to Beth Henderson for her expert technical help in setting up the 10X sequencing and to Dr Isaac Shaw for his insights and editorial comments.
Kirkwood PM, Gibson DA, Smith JR, et al. Single‐cell RNA sequencing redefines the mesenchymal cell landscape of mouse endometrium. The FASEB Journal. 2021;35:e21285. 10.1096/fj.202002123R
REFERENCES
- 1. Gellersen B, Brosens IA, Brosens JJ. Decidualization of the human endometrium: mechanisms, functions, and clinical perspectives. Semin Reprod Med. 2007;25:445‐453. [DOI] [PubMed] [Google Scholar]
- 2. Matsumoto H. Molecular and cellular events during blastocyst implantation in the receptive uterus: clues from mouse models. J Reprod Dev. 2017;63:445‐454. [DOI] [PMC free article] [PubMed] [Google Scholar]
- 3. Garry R, Hart R, Karthigasu KA, Burke C. A re‐appraisal of the morphological changes within the endometrium during menstruation: a hysteroscopic, histological and scanning electron microscopic study. Hum Reprod. 2009;24:1393‐1401. [DOI] [PubMed] [Google Scholar]
- 4. Maybin JA, Critchley HO. Menstrual physiology: implications for endometrial pathology and beyond. Hum Reprod Update. 2015;21:748‐761. [DOI] [PMC free article] [PubMed] [Google Scholar]
- 5. Bellofiore N, Rana S, Dickinson H, Temple‐Smith P, Evans J. Characterization of human‐like menstruation in the spiny mouse: comparative studies with the human and induced mouse model. Hum Reprod. 2018;33:1715‐1726. [DOI] [PubMed] [Google Scholar]
- 6. Bellofiore N, Cousins F, Temple‐Smith P, Dickinson H, Evans J. A missing piece: the spiny mouse and the puzzle of menstruating species. J Mol Endocrinol. 2018;61:R25‐R41. [DOI] [PubMed] [Google Scholar]
- 7. Cousins FL, Kirkwood PM, Saunders PT, Gibson DA. Evidence for a dynamic role for mononuclear phagocytes during endometrial repair and remodelling. Sci Rep. 2016;6:36748. [DOI] [PMC free article] [PubMed] [Google Scholar]
- 8. Cousins FL, Murray A, Esnal A, Gibson DA, Critchley HO, Saunders PT. Evidence from a mouse model that epithelial cell migration and mesenchymal‐epithelial transition contribute to rapid restoration of uterine tissue integrity during menstruation. PLoS One. 2014;9:e86378. [DOI] [PMC free article] [PubMed] [Google Scholar]
- 9. Gargett CE, Schwab KE, Deane JA. Endometrial stem/progenitor cells: the first 10 years. Hum Reprod Update. 2016;22:137‐163. [DOI] [PMC free article] [PubMed] [Google Scholar]
- 10. Gargett CE, Masuda H. Adult stem cells in the endometrium. Mol Hum Reprod. 2010;16:818‐834. [DOI] [PubMed] [Google Scholar]
- 11. Tempest N, Maclean A, Hapangama D. Endometrial stem cell markers: current concepts and unresolved questions. Int J Mol Sci. 2018;19(10):3240. 10.3390/ijms19103240 [DOI] [PMC free article] [PubMed] [Google Scholar]
- 12. Chan RW, Schwab KE, Gargett CE. Clonogenicity of human endometrial epithelial and stromal cells. Biol Reprod. 2004;70:1738‐1750. [DOI] [PubMed] [Google Scholar]
- 13. Gargett CE, Schwab KE, Zillwood RM, Nguyen HP, Wu D. Isolation and culture of epithelial progenitors and mesenchymal stem cells from human endometrium. Biol Reprod. 2009;80:1136‐1145. [DOI] [PMC free article] [PubMed] [Google Scholar]
- 14. Schwab KE, Chan RW, Gargett CE. Putative stem cell activity of human endometrial epithelial and stromal cells during the menstrual cycle. Fertil Steril. 2005;84(Suppl 2):1124‐1130. [DOI] [PubMed] [Google Scholar]
- 15. Letouzey V, Tan KS, Deane JA et al. Isolation and characterisation of mesenchymal stem/stromal cells in the ovine endometrium. PLoS One. 2015;10:e0127531. [DOI] [PMC free article] [PubMed] [Google Scholar]
- 16. Masuda H, Anwar SS, Buhring HJ, Rao JR, Gargett CE. A novel marker of human endometrial mesenchymal stem‐like cells. Cell Transplant. 2012;21:2201‐2214. [DOI] [PubMed] [Google Scholar]
- 17. Cervello I, Martinez‐Conejero JA, Horcajadas JA, Pellicer A, Simon C. Identification, characterization and co‐localization of label‐retaining cell population in mouse endometrium with typical undifferentiated markers. Hum Reprod. 2007;22:45‐51. [DOI] [PubMed] [Google Scholar]
- 18. Chan RW, Gargett CE. Identification of label retaining cells in mouse endometrium. Stem Cells. 2006;24(6):1529–1538. 10.1634/stemcells.2005-0411. [DOI] [PubMed] [Google Scholar]
- 19. Kaitu'u‐Lino TJ, Ye L, Salamonsen LA, Girling JE, Gargett CE. Identification of label‐retaining perivascular cells in a mouse model of endometrial decidualization, breakdown, and repair. Biol Reprod. 2012;86:184. [DOI] [PubMed] [Google Scholar]
- 20. Parasar P, Sacha CR, Ng N et al. Differentiating mouse embryonic stem cells express markers of human endometrium. Reprod Biol Endocrinol. 2017;15:52. [DOI] [PMC free article] [PubMed] [Google Scholar]
- 21. Henderson NC, Arnold TD, Katamura Y et al. Targeting of alphav integrin identifies a core molecular pathway that regulates fibrosis in several organs. Nat Med. 2013;19:1617‐1624. [DOI] [PMC free article] [PubMed] [Google Scholar]
- 22. Caligioni C. S. Assessing reproductive status/stages in mice. Current Protocols in Neuroscience. 2009;48(1):nsa04is48. 10.1002/0471142301.nsa04is48 [DOI] [PMC free article] [PubMed] [Google Scholar]
- 23. Robinson MD, McCarthy DJ, Smyth GK. edgeR: a Bioconductor package for differential expression analysis of digital gene expression data. Bioinformatics. 2010;26:139‐140. [DOI] [PMC free article] [PubMed] [Google Scholar]
- 24. Yu G, Wang LG, Han Y, He QY. clusterProfiler: an R package for comparing biological themes among gene clusters. OMICS. 2012;16:284‐287. [DOI] [PMC free article] [PubMed] [Google Scholar]
- 25. Satija R, Farrell JA, Gennert D, Schier AF, Regev A. Spatial reconstruction of single‐cell gene expression data. Nat Biotechnol. 2015;33:495‐502. [DOI] [PMC free article] [PubMed] [Google Scholar]
- 26. Conway JR, Lex A, Gehlenborg N. UpSetR: an R package for the visualization of intersecting sets and their properties. Bioinformatics. 2017;33:2938‐2940. [DOI] [PMC free article] [PubMed] [Google Scholar]
- 27. Spitzer TL, Rojas A, Zelenko Z et al. Perivascular human endometrial mesenchymal stem cells express pathways relevant to self‐renewal, lineage specification, and functional phenotype. Biol Reprod. 2012;86:58. [DOI] [PMC free article] [PubMed] [Google Scholar]
- 28. Gaafar T, Osman O, Osman A, Attia W, Hamza H, El Hawary R. Gene expression profiling of endometrium versus bone marrow‐derived mesenchymal stem cells: upregulation of cytokine genes. Mol Cell Biochem. 2014;395:29‐43. [DOI] [PubMed] [Google Scholar]
- 29. He L, Vanlandewijck M, Raschperger E et al. Analysis of the brain mural cell transcriptome. Sci Rep. 2016;6:35108. [DOI] [PMC free article] [PubMed] [Google Scholar]
- 30. Cheng Y, Li L, Wang D et al. Characteristics of human endometrium‐derived mesenchymal stem cells and their tropism to endometriosis. Stem Cells Int. 2017;2017:1–9. [DOI] [PMC free article] [PubMed] [Google Scholar]
- 31. Crisan M, Yap S, Casteilla L et al. A perivascular origin for mesenchymal stem cells in multiple human organs. Cell Stem Cell. 2008;3:301‐313. [DOI] [PubMed] [Google Scholar]
- 32. Mills SJ, Cowin AJ, Kaur P. Pericytes, mesenchymal stem cells and the wound healing process. Cells. 2013;2:621‐634. [DOI] [PMC free article] [PubMed] [Google Scholar]
- 33. Ansell DM, Izeta A. Pericytes in wound healing: friend or foe? Exp Dermatol. 2015;24:833‐834. [DOI] [PubMed] [Google Scholar]
- 34. Guimaraes‐Camboa N, Cattaneo P, Sun Y et al. Pericytes of multiple organs do not behave as mesenchymal stem cells in vivo. Cell Stem Cell. 2017;20:345–359.e345. [DOI] [PMC free article] [PubMed] [Google Scholar]
- 35. Andersson E, Zetterberg E, Vedin I, Hultenby K, Palmblad J, Mints M. Low pericyte coverage of endometrial microvessels in heavy menstrual bleeding correlates with the microvessel expression of VEGF‐A. Int J Mol Med. 2015;35:433‐438. [DOI] [PubMed] [Google Scholar]
- 36. Bodnar RJ, Satish L, Yates CC, Wells A. Pericytes: a newly recognized player in wound healing. Wound Repair Regen. 2016;24:204‐214. [DOI] [PMC free article] [PubMed] [Google Scholar]
- 37. Crisan M, Corselli M, Chen WC, Peault B. Perivascular cells for regenerative medicine. J Cell Mol Med. 2012;16:2851‐2860. [DOI] [PMC free article] [PubMed] [Google Scholar]
- 38. Queckborner S, Syk Lundberg E, Gemzell‐Danielsson K, Davies LC. Endometrial stromal cells exhibit a distinct phenotypic and immunomodulatory profile. Stem Cell Res Ther. 2020;11:15. [DOI] [PMC free article] [PubMed] [Google Scholar]
- 39. Krausgruber T, Fortelny N, Fife‐Gernedl V et al. Structural cells are key regulators of organ‐specific immune responses. Nature. 2020;583:296‐302. [DOI] [PMC free article] [PubMed] [Google Scholar]
- 40. Krjutskov K, Katayama S, Saare M et al. Single‐cell transcriptome analysis of endometrial tissue. Hum Reprod. 2016;31:844‐853. [DOI] [PMC free article] [PubMed] [Google Scholar]
- 41. Lucas ES, Vrljicak P, Muter J et al. Recurrent pregnancy loss is associated with a pro‐senescent decidual response during the peri‐implantation window. Commun Biol. 2020;3:37. [DOI] [PMC free article] [PubMed] [Google Scholar]
- 42. Kitaya K, Yamaguchi T, Honjo H. Central role of interleukin‐15 in postovulatory recruitment of peripheral blood CD16(‐) natural killer cells into human endometrium. J Clin Endocrinol Metab. 2005;90:2932‐2940. [DOI] [PubMed] [Google Scholar]
- 43. Wang W, Vilella F, Alama P et al. Single‐cell transcriptomic atlas of the human endometrium during the menstrual cycle. Nat Med. 2020;26:1644‐1653. [DOI] [PubMed] [Google Scholar]
- 44. Papatheodorou I, Moreno P, Manning J et al. Expression Atlas update: from tissues to single cells. Nucleic Acids Res. 2020;48:D77‐D83. [DOI] [PMC free article] [PubMed] [Google Scholar]
- 45. Tabula Muris Consortium; Overall coordination; Logistical coordination; Organ collection and processing; Library preparation and sequencing; Computational data analysis; Cell type annotation; Writing group; Supplemental text writing group; Principal inves . Single‐cell transcriptomics of 20 mouse organs creates a Tabula Muris. Nature. 2018;562:367‐372. [DOI] [PMC free article] [PubMed] [Google Scholar]
- 46. Han X, Wang R, Zhou Y et al. Mapping the mouse cell atlas by microwell‐seq. Cell. 2018;173:1307. [DOI] [PubMed] [Google Scholar]
- 47. Saatcioglu HD, Kano M, Horn H et al. Single‐cell sequencing of neonatal uterus reveals an Misr2+ endometrial progenitor indispensable for fertility. Elife. 2019;8:e46349. [DOI] [PMC free article] [PubMed] [Google Scholar]
- 48. Dobie R, Wilson‐Kanamori JR, Henderson BEP et al. Single‐cell transcriptomics uncovers zonation of function in the mesenchyme during liver fibrosis. Cell Rep. 2019;29:1832–1847.e1838. [DOI] [PMC free article] [PubMed] [Google Scholar]
- 49. Ramachandran P, Matchett KP, Dobie R, Wilson‐Kanamori JR, Henderson NC. Single‐cell technologies in hepatology: new insights into liver biology and disease pathogenesis. Nat Rev Gastroenterol Hepatol. 2020. [DOI] [PubMed] [Google Scholar]
- 50. Peyser R, MacDonnell S, Gao Y et al. Defining the activated fibroblast population in lung fibrosis using single‐cell sequencing. Am J Respir Cell Mol Biol. 2019;61:74‐85. [DOI] [PubMed] [Google Scholar]
- 51. Kirita Y, Chang‐Panesso M, Humphreys BD. Recent insights into kidney injury and repair from transcriptomic analyses. Nephron. 2019;143:162‐165. [DOI] [PMC free article] [PubMed] [Google Scholar]
- 52. Kirita Y, Wu H, Uchimura K, Wilson PC, Humphreys BD. Cell profiling of mouse acute kidney injury reveals conserved cellular responses to injury. Proc Natl Acad Sci USA. 2020;117(27):15874‐15883. [DOI] [PMC free article] [PubMed] [Google Scholar]
Associated Data
This section collects any data citations, data availability statements, or supplementary materials included in this article.
Supplementary Materials
Fig S1‐S8
Table S1‐S4