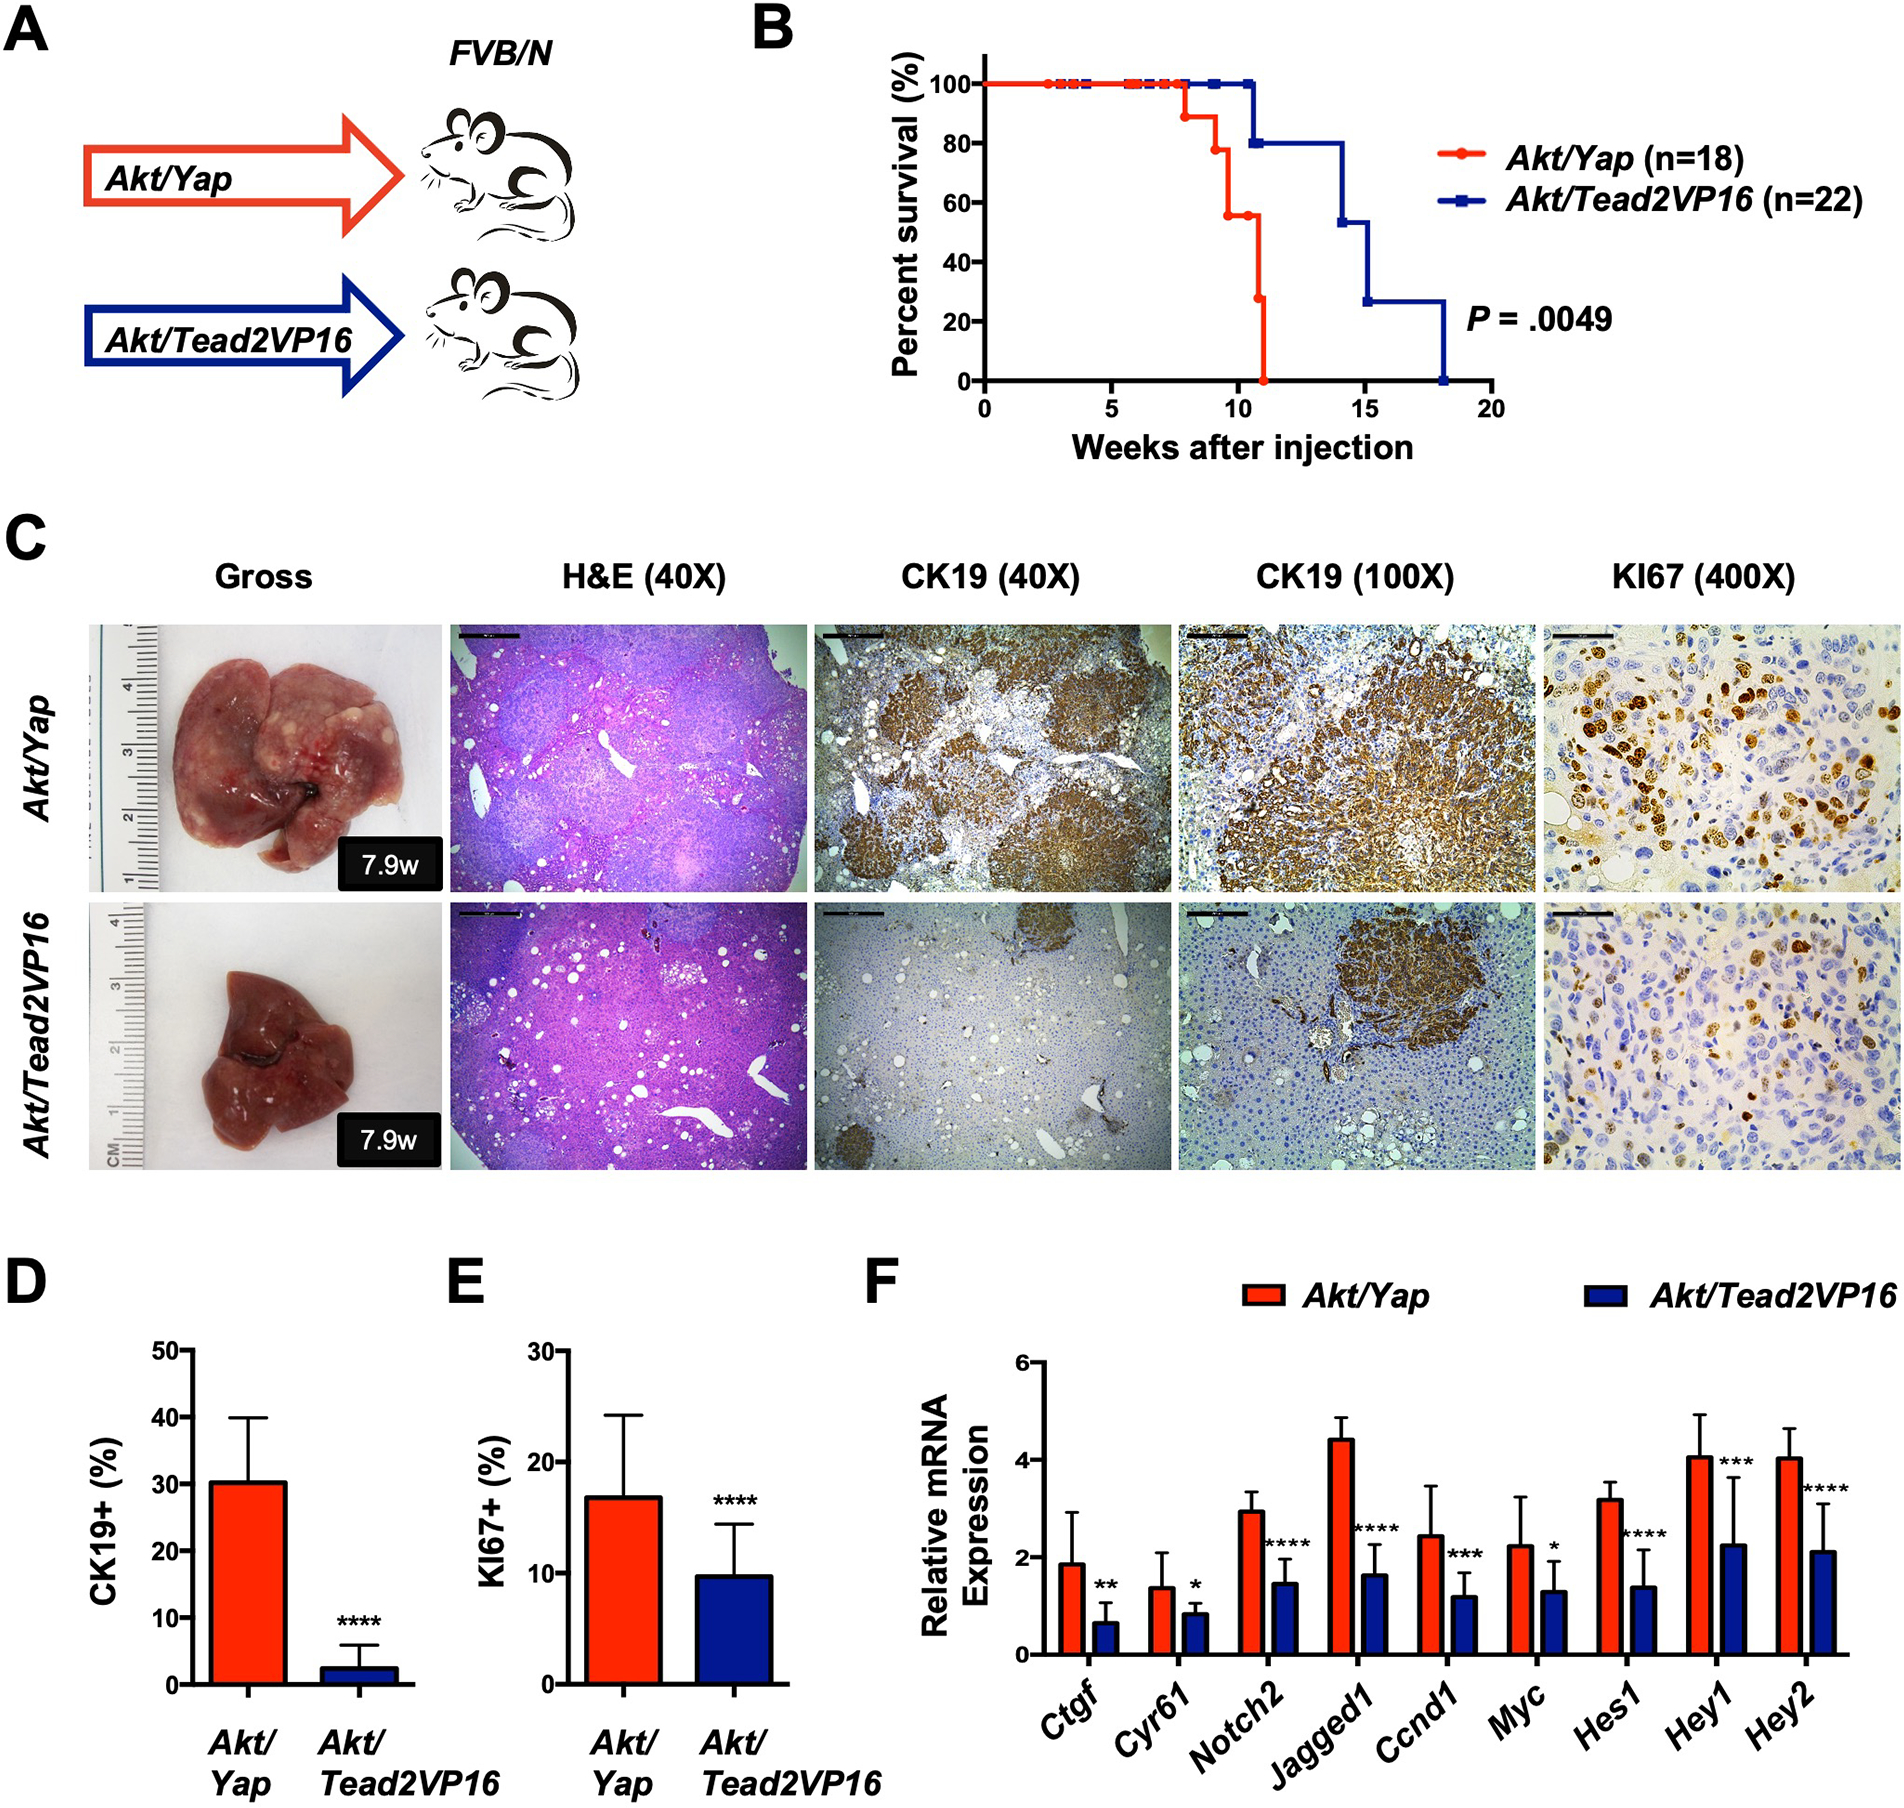
Figure 2. TEAD mediated transcriptional activation is not sufficient to induce Yap-dependent cholangiocarcinogenesis.

(A) Study design. FVB/N mice were subjected to HTVi of either Akt/Yap (n=18) or Akt/Tead2VP16 (n = 22) plasmids. Akt/Yap, Akt/YapS94A (Fig.1B), and Akt/ead2VP16 mice were generated in parallel. (B) Mouse survival curves. (C) Representative gross images, H&E, and immunohistochemistry for CK19 and KI67 of liver sections from Akt/Yap (M7.9w.p.i) and Akt/Tead2VP16 (M7.9w.p.i) mice. (D) Analysis of CK19-positive areas in Akt/Yap and Akt/Tead2VP16 mouse liver tissues at 2.5–11 w.p.i. (E) Quantification of the KI67 positive staining in liver sections from the depicted mice. (F) mRNA expression of Yap and Notch targets. Data were analyzed by the Mann-Whitney test. Statistical significance: *P < .05, **P < .01, ***P < .001, ****P < .0001. Scale bar: 500 μm (40x), 100 μm (100x) and 50 μm (400x). Abbreviations: H&E, hematoxylin and eosin staining; w.p.i, weeks post-injection.
