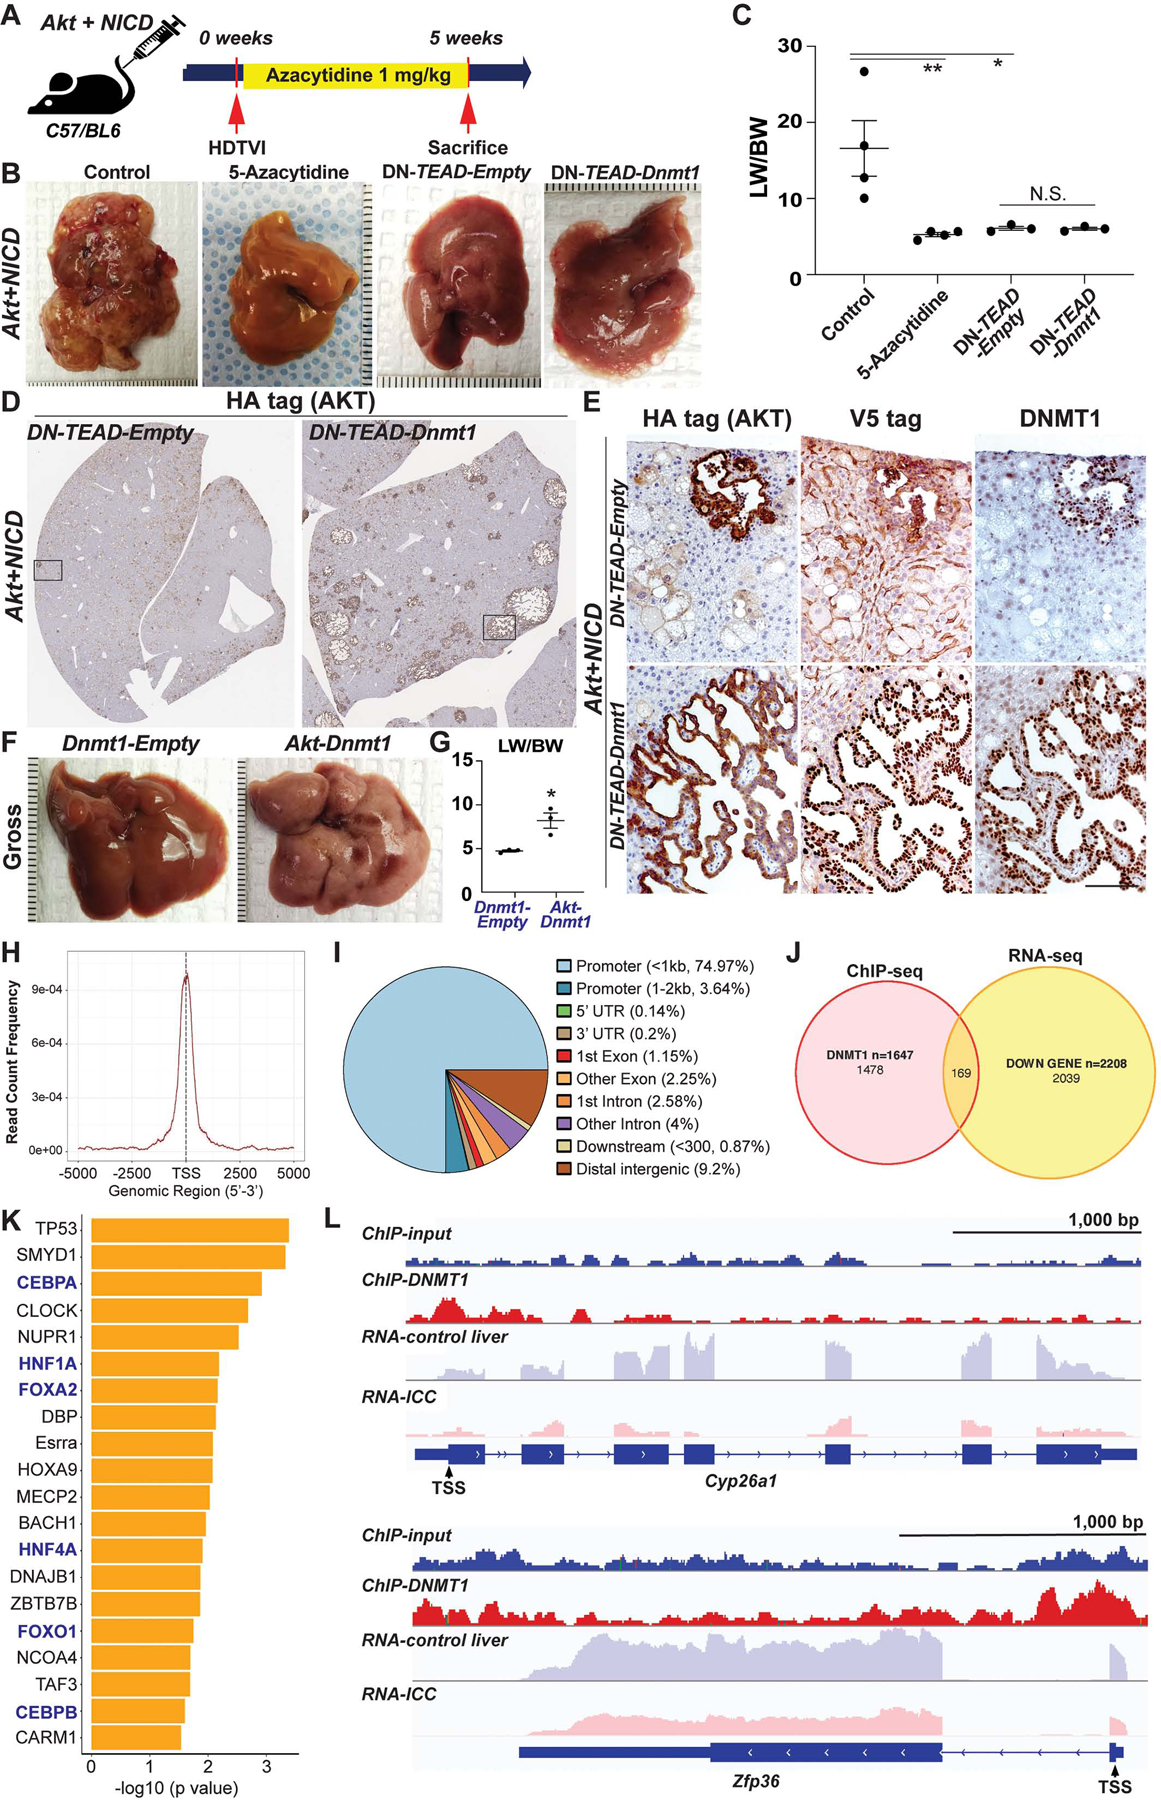
Figure 7. NICD-YAP1/TEAD-DNMT1 axis drives HC-to-ICC transformation.

(A) Experimental design illustrating 5-Azacytidine treatment, plasmids used for HDTVI, mice used in study and time-points analyzed. (B) Representative gross images from Akt-NICD control, 5-Azacytidine-treated or DN-TEAD injected livers at 5w. (C) LW/BW ratio depicts comparable low tumor burden in 5-Azacytidine-treated, DN-TEAD and DN-TEAD-Dnmt1 co-injected animals at 5w. (D) Representative tiled image of HA-tag (AKT) staining showing near-complete abrogation of tumor by TEAD repression whereas widespread cystic ICC nodules were detected in Dnmt1 re-expressed livers. (E) IHC of squared region (D panel) showing HA-tag+;V5-tag (DNMT1)+;endogenous DNMT1+ ICC nodules in Dnmt1 re-expressed liver (bottom). Few tumor nodules observed in Akt-NICD; DN-TEAD were V5-tag− but positive for HA-tag and endogenous DNMT1 (top). Representative gross images (F) and LW/BW (G) ratio from Akt-Dnmt1-injected group shows tumor burden within entire liver lobes while no gross tumor nodule was observed in Dnmt1-Empty-injected livers. (H) Enrichment of DNMT1 ChIP-Seq binding within +/− 2.5kb from transcription start site (TSS) region. (I) Annotation of 2,174 DNMT1 ChIP-Seq peaks relative to Ref Seq transcript annotations showing robust enrichment in promoter region. (J) Venn diagrams showing the overlap of DNMT1 binding (ChIP-seq) and decreased RNA expression (RNA-seq) in Akt-NICD-ICC. (K) IPA-URA analysis results displaying top 20 predicted upstream transcriptional regulators for 169 genes shown in (J). (L) Visualization of DNMT1 ChIP-Seq peaks in correlation with transcripts mapping to representative genes within each regulatory group.
