

Abstract
Aim:
Erythropoietin (EPO) is regulated by hypoxia-inducible factor (HIF)-2. In the kidney, it is produced by cortico-medullary perivascular interstitial cells, which transdifferentiate into collagen-producing myofibroblasts in response to injury. Inhibitors of prolyl hydroxylase domain (PHD) dioxygenases (HIF-PHIs) activate HIF-2 and stimulate kidney and liver EPO synthesis in patients with anemia of chronic kidney disease (CKD). We examined whether HIF-PHIs can reactivate EPO synthesis in interstitial cells that have undergone myofibroblast transdifferentiation in established kidney fibrosis.
Methods:
We investigated Epo transcription in myofibroblasts and characterized the histological distribution of kidney Epo transcripts by RNA in situ hybridization combined with immunofluorescence in mice with adenine nephropathy (AN) treated with HIF-PHI molidustat. Lectin absorption chromatography was used to assess liver-derived EPO. In addition, we examined kidney Epo transcription in Phd2 knockout mice with obstructive nephropathy.
Results:
In AN, molidustat-induced Epo transcripts were not found in areas of fibrosis and did not colocalize with interstitial cells that expressed α-smooth muscle actin, a marker of myofibroblast transdifferentiation. Epo transcription was associated with megalin-expressing, kidney injury molecule 1-negative nephron segments and contingent on residual renal function. Liver-derived EPO did not contribute to serum EPO in molidustat-treated mice. Epo transcription was not associated with myofibroblasts in Phd2 knockout mice with obstructive nephropathy.
Conclusions:
Our studies suggest that HIF-PHIs do not reactivate Epo transcription in interstitial myofibroblasts and that their efficacy in inducing kidney EPO in CKD is dependent on the degree of myofibroblast formation, the preservation of renal parenchyma and the level of residual renal function.
Keywords: hypoxia-inducible factor, erythropoietin, chronic kidney disease, prolyl hydroxylase domain, anemia, molidustat
Introduction
Anemia is a major complication of advanced chronic kidney disease (CKD), as its prevalence increases with CKD stage.1 A major contributing factor to the pathogenesis of anemia of CKD is relative erythropoietin (EPO) deficiency, i.e., the inadequate production of kidney-derived EPO in response to a given degree of hypoxia or anemia, which decreases oxygen delivery in blood and is from here on referred to anemic hypoxia.2 “Pseudo-normoxia”, the notion that renal EPO-producing cells (REPC) sense “sufficient oxygen” due to reduced epithelial oxygen demand when GFR is decreased,3 and transdifferentiation of REPC into collagen-producing myofibroblasts in response to injury have been proposed as the two major underlying mechanisms.2 The latter results in a reduction of the number of interstitial cells that have capacity to produce EPO and has been associated with a suppression of EPO transcription by inflammatory cytokines, and with repressive epigenetic marks in regulatory regions of the EPO gene.4–7
EPO is regulated by hypoxia-inducible factor (HIF)-2 and produced by interstitial perivascular fibroblasts and pericytes in the kidney and by hepatocytes in the liver.8,9 HIF-2 belongs to a family of heterodimeric transcription factors that consist of an oxygen-regulated α-subunit, HIF-α, and a constitutively expressed β-subunit, HIF-β.10 The prolyl hydroxylase domain (PHD) dioxygenases, PHD1, PHD2 and PHD3, function as the oxygen sensors of the HIF pathway and utilize molecular O2 and 2-oxoglutarate as substrates for the hydroxylation of HIF-α. HIF-α hydroxylation initiates binding to the von Hippel-Lindau (VHL) ubiquitin ligase complex, resulting in its ubiquitylation and subsequent proteasomal degradation.11 Under hypoxic conditions or in the presence of small molecule inhibitors, the hydroxylation of HIF-α is reduced and HIF-α subunits, which are continuously synthesized by cells, become detectable and translocate to the nucleus. In the nucleus, HIF-α heterodimerizes with HIF1-β to form the HIF transcription factor, which activates gene transcription and regulates multiple biological processes that help cells to adapt to and survive hypoxia.12
HIF-PHD inhibitors (HIF-PHIs) belong to a new class of anemia drugs that activate HIF-2 signaling and stimulate the production of endogenous EPO in kidney and liver.13 Although HIF-PHIs have been shown to induce renal Epo transcription in models of CKD or inflammation,14–19 the cellular phenotype and the histologic distribution of interstitial cells in CKD tissue that respond to pharmacologic HIF-PHD inhibition with EPO synthesis remain ill-defined. Genetic studies have suggested that PHD inactivation may preserve EPO production in interstitial cells that have undergone transition to myofibroblasts.20 However, it is not clear whether pharmacologic HIF-PHD inhibition can reactivate EPO production in myofibroblasts once fibrosis is already established. Here, we took advantage of two different models of fibrotic kidney injury, adenine-induced nephropathy (AN) and unilateral ureteral obstruction (UUO), to test the hypothesis that HIF-PHIs are capable of reactivating EPO synthesis in myofibroblasts.
Results
HIF-PHI-induced EPO synthesis colocalizes with non-injured proximal nephrons in AN
To characterize EPO synthesis induced by pharmacologic HIF-PHD inhibition in a model of anemia associated with CKD, wild-type mice were fed a 0.25% adenine-containing chow diet intermittently over a period of 9 weeks as previously described.5 Mice developed chronic kidney injury, which was associated with anemia, suggesting EPO deficiency (Figure 1). To further characterize EPO responses in mice with AN, we performed phlebotomy to induce more severe anemia. Although kidney Epo mRNA and serum EPO levels increased in response to worsening anemia in mice with AN, the EPO response was diminished compared to control mice with similar degrees of anemia, which is consistent with relative EPO-deficiency (Figure 2 and Supplemental Figure S1). To examine whether anemic hypoxia has the capacity of stimulating kidney EPO production in myofibroblasts we used multiplex RNA fluorescence in situ hybridization (FISH) to examine to what degree Acta2, a marker of myofibroblast transdifferentiation, was expressed in REPC. Acta2 colocalized with Epo transcripts in 2.59 ± 0.76% of REPC in the adenine-fed group and 0.18 ± 0.14 % in the control diet-fed group (n=5 and 4, respectively) (Figure 2).
Figure 1. Adenine nephropathy is associated with anemia.
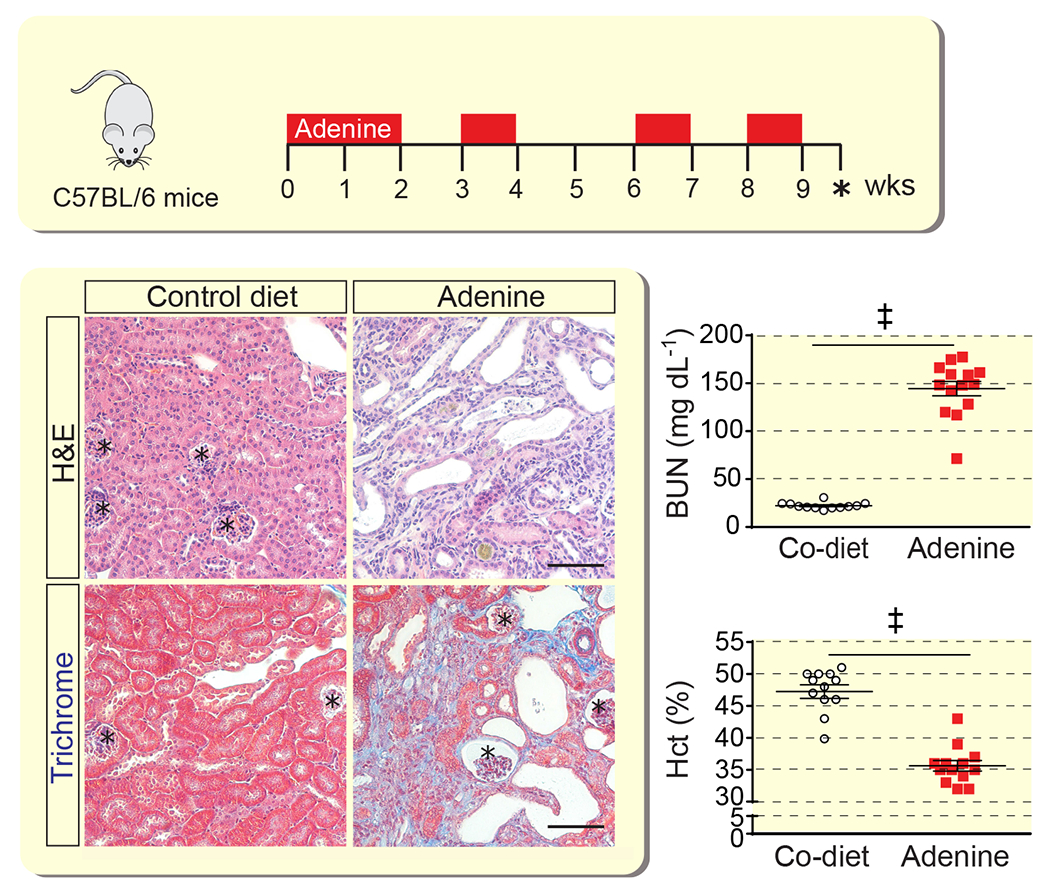
Schematic overview of adenine feeding protocol. Representative images of kidney sections from control (Co) diet- or adenine diet-fed mice analyzed with hematoxylin and eosin (H&E) or Masson’s trichrome staining; asterisks depict glomeruli. Scale bar, 100 μm. Shown are blood urea nitrogen levels (BUN) and hematocrit (Hct) for control diet- and adenine-fed mice (n=12-14). Data are represented as mean ± SEM; Student’s t-test; ‡P<0.001.
Figure 2. EPO synthesis induced by anemic hypoxia is not associated with myofibroblast transdifferentiation in severe AN.
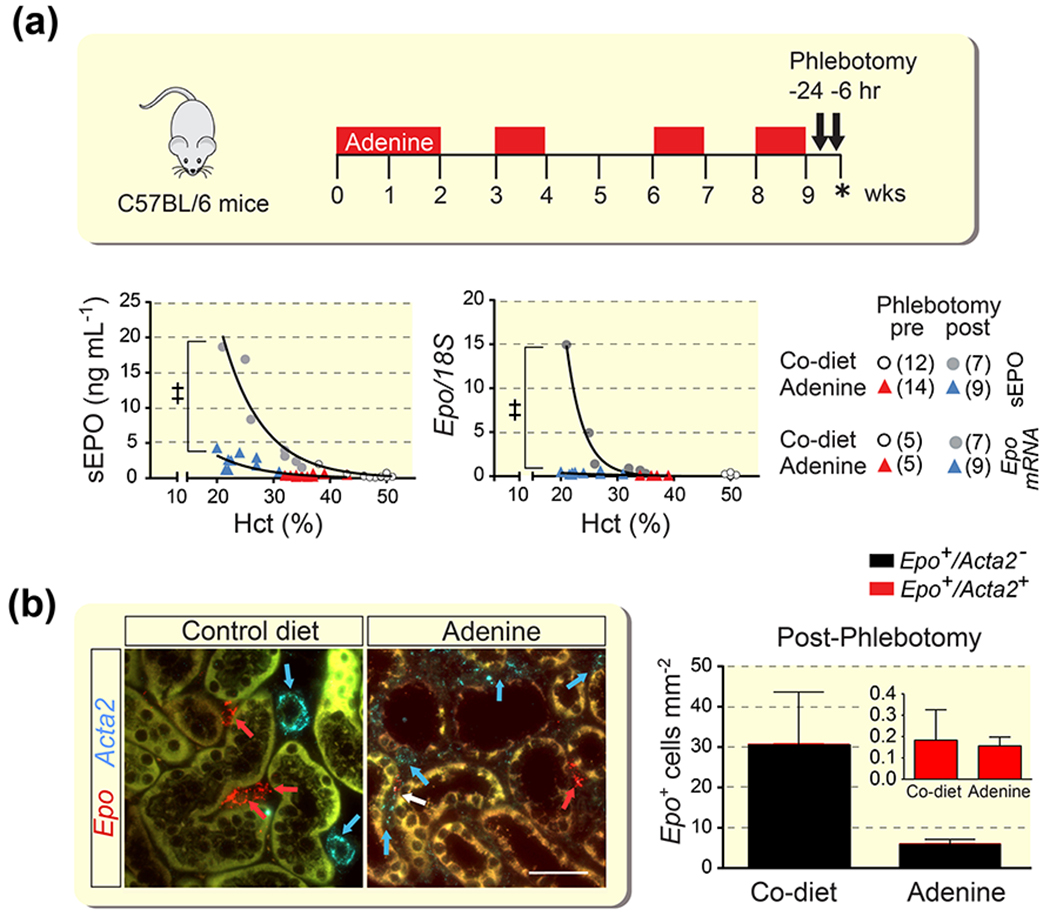
(a) Schematic overview of adenine feeding protocol and timing of phlebotomy and analysis (asterisk) of control (Co) diet- or adenine diet-fed mice. Relative kidney erythropoietin (Epo) transcript and serum EPO (sEPO) levels in individual mice in relation to hematocrit (Hct) before (pre) or after (post) phlebotomy-induced anemia. Number of experimental animals per group are shown in brackets. (b) Representative images of multiplex RNA fluorescence in situ hybridization detecting Epo and α-smooth muscle actin (Acta2) transcripts in kidneys from phlebotomized mice and quantification of Epo-expressing cells (n=4-5). Red arrows depict Epo+Acta2− cells, a Epo+Acta2+ cell is depicted by the white arrow, blue arrows depict Epo−Acta2+ cells (vascular smooth muscle cells in control). Scale bar, 50 μm. Data are represented as mean ± SEM; Non-linear regression analysis, Student’s t-test; ‡P<0.001. Abb.: AN, adenine nephropathy.
We next investigated the effects of HIF-PHI molidustat, which inhibits of all three PHD isoforms,14,21 on kidney EPO production in mice with AN. To rule out differences in renal drug delivery, kidney tissue concentration of orally administered molidustat was determined by liquid chromatography MS and found to be comparable between adenine- and control diet-fed mice (6.14 ± 0.62 pmol/mg tissue for adenine diet vs 6.72 ± 1.33 pmol/mg tissue for control; n= 7 and 5, respectively). Compared with vehicle-treated mice, molidustat induced kidney Epo transcription, the number of REPC and serum EPO concentrations in control diet-fed and to a lesser degree in mice with AN (Figure 3A and 3B). Acta2+Epo+ renal interstitial cells represented 2.99 ± 1.35 % of REPC in the adenine-fed group and 0.53 ± 0.29 % in the control diet-fed group (n=5 and 7, respectively) (Figure 3B). These results are consistent with our data in mice with AN subjected to phlebotomy and suggest that EPO synthesis following either hypoxic or pharmacologic HIF-PHD inhibition is not significantly associated with cells that have undergone myofibroblast transdifferentiation.
Figure 3. Characterization of EPO responses in mice with severe AN treated with HIF-PHI molidustat.
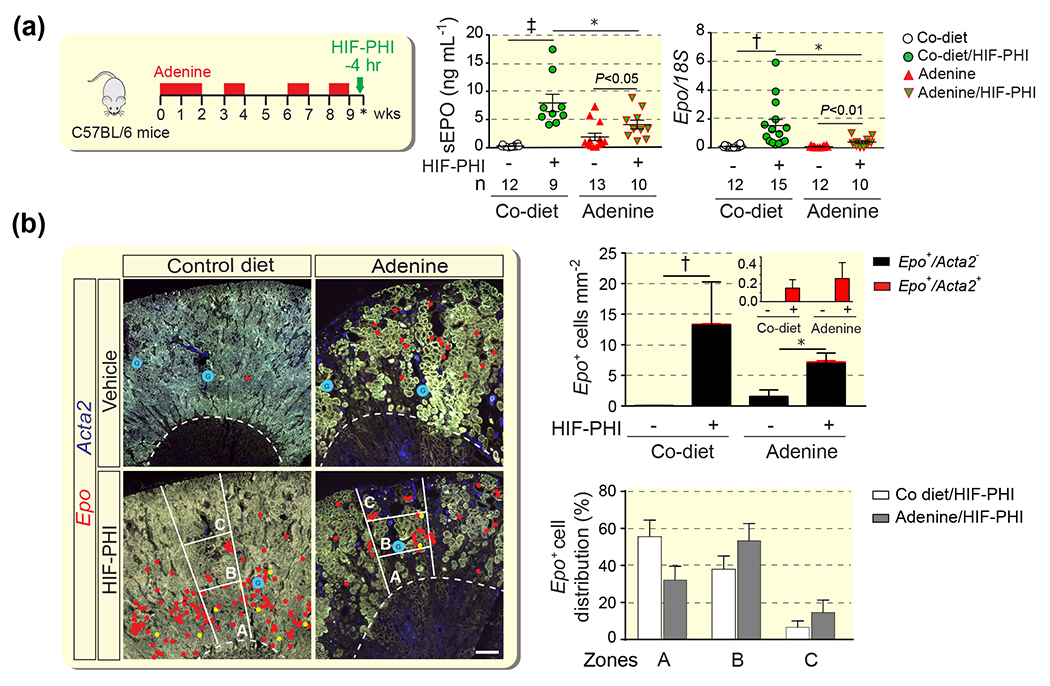
(a) Schematic overview of adenine feeding protocol, timing HIF-PHI administration (molidustat 10mg/kg) and timing of analysis (asterisk). Serum erythropoietin levels (sEPO) and relative kidney erythropoietin (Epo) mRNA levels in whole kidney homogenates in control (Co) diet- and adenine-fed groups. Numbers of experimental animals (n) are indicated belwo the graphs. (b) Quantification of Epo-expressing cells with or without α-smooth muscle actin (Acta2) co-expression (n= 3-7) and histological distribution of Epo-expressing cells by zones (n= 4-7). Representative images of multiplex RNA fluorescence in situ hybridization detecting Epo and Acta2 transcripts in kidneys from control diet- and adenine-fed C57BL/6 mice. Epo transcripts were annotated with red circles; Epo+Acta2+ cells were annotated with yellow circles to provide an overview of Epo+ cell distribution at low magnification; glomeruli were annotated with blue circles. The outer stripe of the outer medulla and kidney cortex were divided into 3 zones of equal width (A, B, and C). Right panel, quantification of Epo+ cell distribution in AN. Data are represented as mean ± SEM; two-way ANOVA (A) and Mann-Whitney test for (B); *P<0.05, †P<0.01, ‡P<0.001. P values inside graphs (A) by Students t-test. Abb.: AN, adenine nephropathy; HIF-PHI, hypoxia-inducible factor-prolyl hydroxylase inhibitor.
To characterize the spatial distribution of EPO synthesis induced by HIF-PHI molidustat we used RNA-FISH. In molidustat-treated control mice Epo-expressing cells were predominantly found in the outer stripe of the outer medulla (OSOM) and inner and midcortex, whereas the majority of REPC in adenine-fed mice was localized to areas with preserved kidney architecture in the midcortex. For the analysis, we divided cortex and OSOM into 3 zones of equal width, zones A, B and C, with zone A representing the OSOM and zone C representing the outer kidney cortex (Figure 3B). 32.1 ± 7.5 % of REPC in the AN cohort were found in zone A vs. 55.5 ± 9.0 % for control, 53.3 ± 9.3 % in zone B vs 37.9 ± 7.2 % for control, and 14.6 ± 6.7 % in zone C vs. 6.6 ± 3.4 % for control, which that the localization of REPC shifted from OM towards the cortex in mice with AN. To further characterize the histologic distribution of REPC in AN, we combined multiplex RNA-FISH with immunofluorescence staining (IF) to simultaneously visualize Epo transcripts with the expression of renal differentiation and injury markers. REPC were exclusively found in the proximity of tubular structures that expressed megalin, a marker of differentiated proximal tubules. In contrast, Epo transcripts were not detected in the proximity of megalin-negative tubular structures that expressed kidney injury molecule-1 (KIM1), a marker of proximal renal injury,22 whereas a small fraction of REPC was detected in the proximity of tubular structures that co-expressed megalin and KIM1 (Figure 4).
Figure 4. HIF-PHI-induced EPO synthesis in CKD anemia colocalizes with non-injured proximal nephrons.
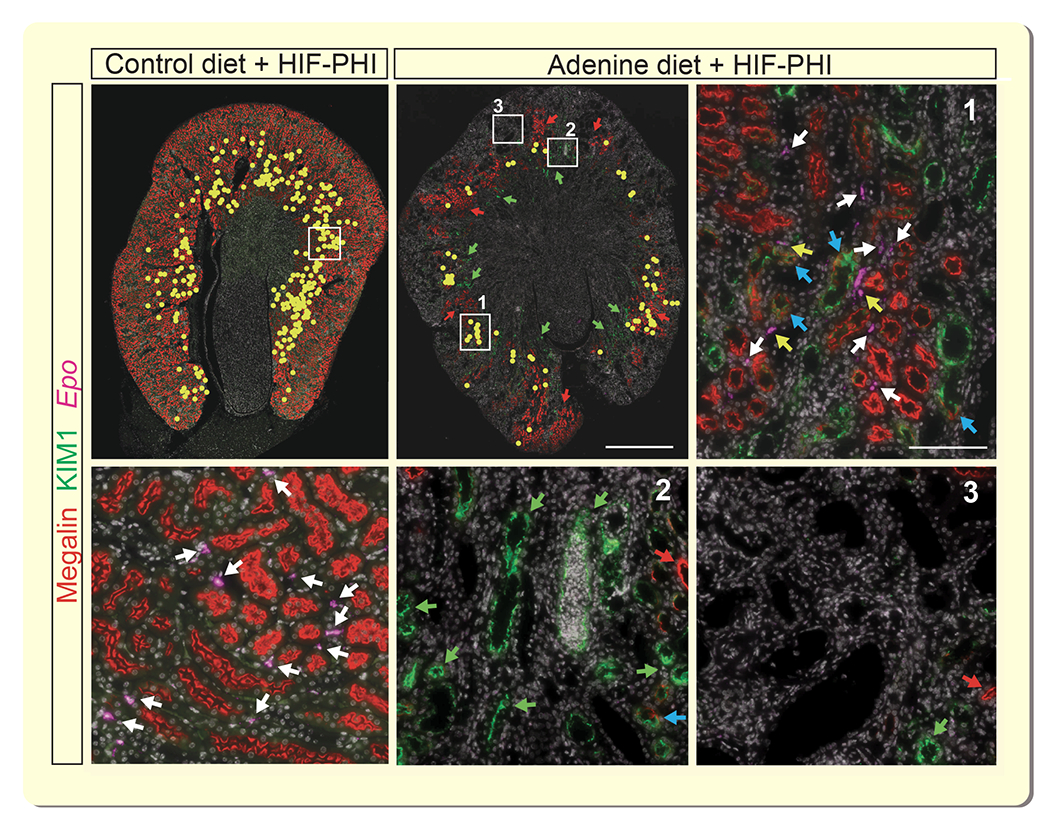
Simultaneous visualization of erythropoietin (Epo) transcripts, megalin and kidney injury molecule 1 (KIM1) by combined RNA fluorescence in situ hybridization and immunofluorescence staining (IF). Representative images of kidney sections from control diet and adenine-fed mice treated with a single dose of HIF-PHI molidustat, 4 hours prior to analysis. Low power magnification images, Epo transcripts were annotated with yellow circles to facilitate overview of Epo+ cell distribution. Scale bar, 1 mm. High power magnification images, representative areas with megalin-expressing proximal tubules (1), KIM1-expressing tubular structures (2) and absence of megalin and KIM1 IF staining (3). Scale bar, 100μm. Red arrows depict megalin-expressing proximal tubules; green arrows depict areas with KIM1-expressing tubules; white arrows depict Epo transcripts associated with megalin-expressing tubules; blue arrows identify KIM1+/megalin+ tubules; yellow arrows depict Epo transcripts associated with KIM1+/megalin+ tubules. Abb.: HIF-PHI, hypoxia-inducible factor-prolyl hydroxylase inhibitor.
HIF-PHI-induced EPO synthesis is dependent on residual renal function and degree of fibrosis
To examine to what degree HIF-PHI-induced EPO synthesis was dependent on renal function and/or extent of fibrosis, mice were fed adenine-containing chow intermittently over a period of 6 weeks and then treated with orally administered molidustat for an additional 3 weeks while either continuing on adenine-containing chow (feeding protocol A) or switching to control diet (feeding protocol B); the 9-week feeding protocols are outlined in Figure 5A. Prior to molidustat treatment (6-week time point), adenine-fed mice developed kidney injury, which was associated with anemia. BUN levels were significantly elevated compared with control (64.5 ± 3.9 mg/dL vs. 23.93 ± 0.92 mg/dL in control; n=12 and 11, respectively, P<0.001), while mean Hct was 37.36 ± 0.85 % vs. 49.00 ± 042 % in control diet-fed; n=21-22, P<0.0001. At study completion (9-week time point), average BUN levels were 179.1 ± 25.23 mg/dL in vehicle- and 192.0 ± 22.29 mg/dL in molidustat-treated mice for the protocol A cohort (n=4 and 5, respectively, P<0.001), whereas BUN levels in the protocol B cohort did not change significantly compared to the 6-week time point (43.18 ± 3.15 mg/dL for vehicle and 45.51 ± 5.59 mg/dL for molidustat-treated mice; n=5 and 6 respectively). These findings indicated that kidney injury was more severe in mice subjected to feeding protocol A compared to mice in protocol cohort B and was not significantly affected by molidustat treatment. The differences in severity of chronic kidney injury between mice completing protocol A and mice in protocol B was mirrored in the degree of extracellular matrix collagen deposition as shown by Masson’s trichrome staining, ACTA2 immunohistochemistry (IHC) (10.75 ± 0.97 %/mm2 in protocol A vs. 5.35 ± 0.93 %/mm2 in protocol B; n=3 each, P<0.05) and transcript levels of Col1a1 and adhesion G protein-coupled receptor E1(F4/80) (Supplemental Figure S2 and Figure 5A).
Figure 5. EPO synthesis induced by pharmacologic HIF-PHD inhibition is dependent on degree of fibrosis and residual renal function.
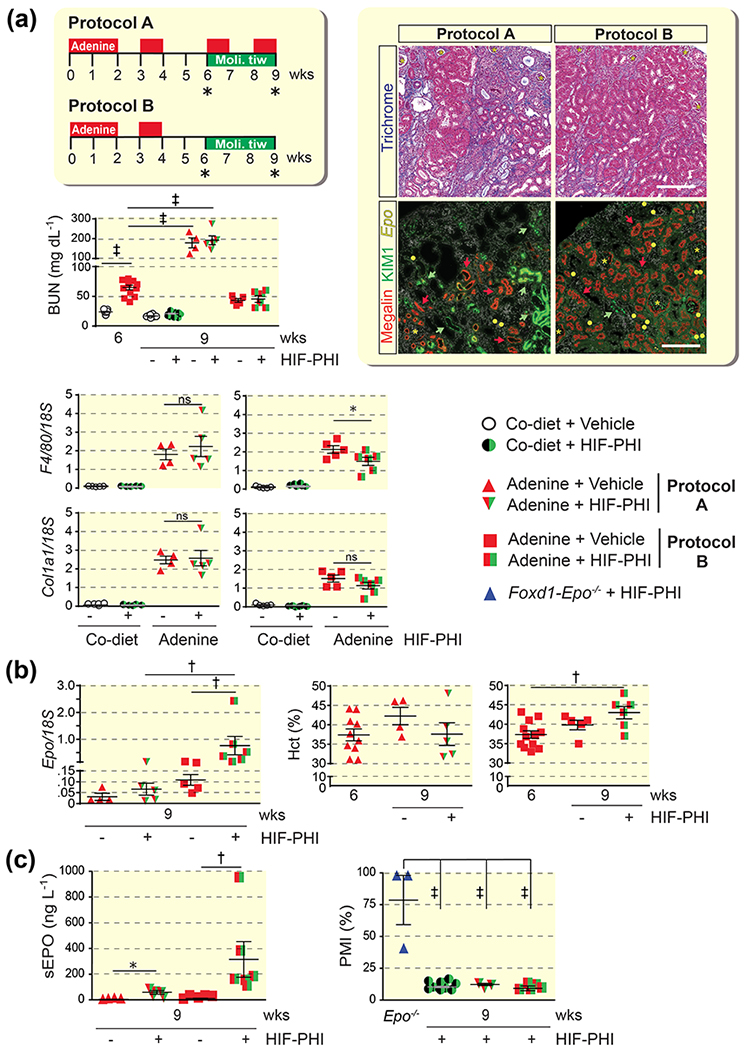
(a) Schematic overview of adenine feeding protocols A and B and timing of oral HIF-PHI administration (molidustat 10mg/kg/day, three times weekly); asterisk indicates time point of analysis. BUN levels for individual treatment groups at 6 weeks (prior to HIF-PHI administration) and 9 weeks (end of study) (n=10-11 for control diet cohorts, n=12 for adenine diet cohort at 6 weeks, n=4-6 for adenine cohorts at 9 weeks). Right panels, representative images of kidney sections from HIF-PHI-treated, adenine-fed mice. Kidney sections were analyzed by Masson’s trichrome stain and by combined RNA fluorescence in situ hybridization and immunofluorescence staining for simultaneous visualization of erythropoietin (Epo) transcripts, megalin and kidney injury molecule 1 (KIM1). Asterisks depict glomeruli, red arrows megalin-expressing tubules and green arrows depict KIM1-expressing tubules. Epo transcripts were annotated with yellow circles to facilitate visualization of Epo+ cells. Scale bars, 200 μm. Lower panels, adhesion G protein-coupled E1(F4/80) and collagen type I alpha 1 (Col1a1) transcript levels in whole kidney homogenates from control (Co) diet and adenine-fed mice at end of study (n=4-5). (b) Kidney Epo transcript levels and Hct values at 6 weeks and end of study (n=4-6 for Epo mRNA, n=4-12 for Hct panels). (c) Left panel, serum erythropoietin (sEPO) levels following elution from filter paper (n=4-5); right panel, percentage of migrated isoforms (PMI) assessing the fraction of liver-derived EPO in mice with AN subjected to feeding protocol A or B (n=3-11). Foxd1-Epo−/− mice, which cannot produce kidney-derived EPO due to Epo gene inactivation in renal interstitial cells but produce liver EPO, were treated with HIF-PHI GSK1002083A as previously described and used as control for liver EPO (n=3 for Epo−/− control, n=11 for control diet cohort, n=3-5 for adenine diet cohorts). Data are represented as mean ± SEM; one-way or two-way ANOVA, Mann-Whitney test for sEPO for panel C; *P<0.05, †P<0.01, ‡P<0.001. Abb.: HIF-PHI, hypoxia-inducible factor-prolyl hydroxylase inhibitor; tiw, three times weekly.
Serum EPO and renal Epo mRNA levels suggested increased responsiveness to molidustat in mice from protocol B compared to protocol A (Figure 5B and 5C). Because molidustat can stimulate EPO production in the liver,14 we used lectin absorption chromatography to determine the relative contributions of kidney and liver-derived EPO to total serum EPO.23 The percentage of migrated isoforms (PMI), which assesses the contribution of liver-derived EPO, was <20 and not different between protocols A and B, suggesting that liver-derived EPO did not significantly contribute to the serum EPO pool in HIF-PHI-treated mice (Figure 5C). This is furthermore reflected in non-detectable liver Epo transcript levels in both groups (data not shown). At the end of week 9, treatment with molidustat increased Hct in the protocol B cohort but not in the protocol A cohort (Figure 5B).
EPO synthesis induced by genetic Phd2 inactivation is not associated with myofibroblast transdifferentiation in UUO kidneys
To provide additional evidence that REPC which have undergone transdifferentiation can no longer be stimulated to synthesize EPO, we targeted the HIF-PHD axis in an experimental model of rapidly progressing fibrosis and myofibroblast transdifferentiation induced by UUO.24 Fibrosis in this model is associated with a significant suppression in kidney EPO production (Supplemental Figure S3). We targeted the main PHD dioxygenase PHD2 in FOXD1-derived interstitial perivascular fibroblasts, which were tagged with enhanced green fluorescent protein (EGFP) encoded by the ROSA26-ACTB-tdTomato,-Egfp allele (Figure 6A).25–27 Phd2 inactivation in FOXD1 lineage cells occurs during kidney development and results in constitutive HIF-2α stabilization and activation of Epo transcription in ~60% of FOXD1-derived renal interstitial cells in adult mice.28 Significant kidney injury was reflected by severe histopathologic changes, elevated Col1a1 and Kim1 mRNA levels and ACTA2 expression compared to contralateral (CTL) non-obstructed kidneys (Figure 6B and Supplemental Figure S4). The number of REPC/area as determined by RNA-FISH was 196.9 ± 54.6 cells/mm2 in UUO vs.181.7 ± 34.5 cells/mm2 in CTL kidneys (n=7), which was also reflected in comparable whole kidney Epo transcript levels (Figure 6C). In line with UUO-induced proliferation and transdifferentiation of renal interstitial cells was an increase in the number of interstitial cells expressing Egfp and Acta2, respectively (Figure 6C). Acta2 was detectable in ~20 % of FOXD1 stroma-derived Egfp+ interstitial cells, of which 19.9 ± 7.9% were Acta2+ and did not express Epo, whereas only 0.7 ± 0.3 % co-expressed Acta2 and Epo, indicating that Acta2-expression is not associated with EPO synthesis in renal interstitial cells (Figure 6C).
Figure 6. EPO synthesis induced by genetic Phd2 inactivation is not associated with myofibroblast transdifferentiation in UUO kidneys.
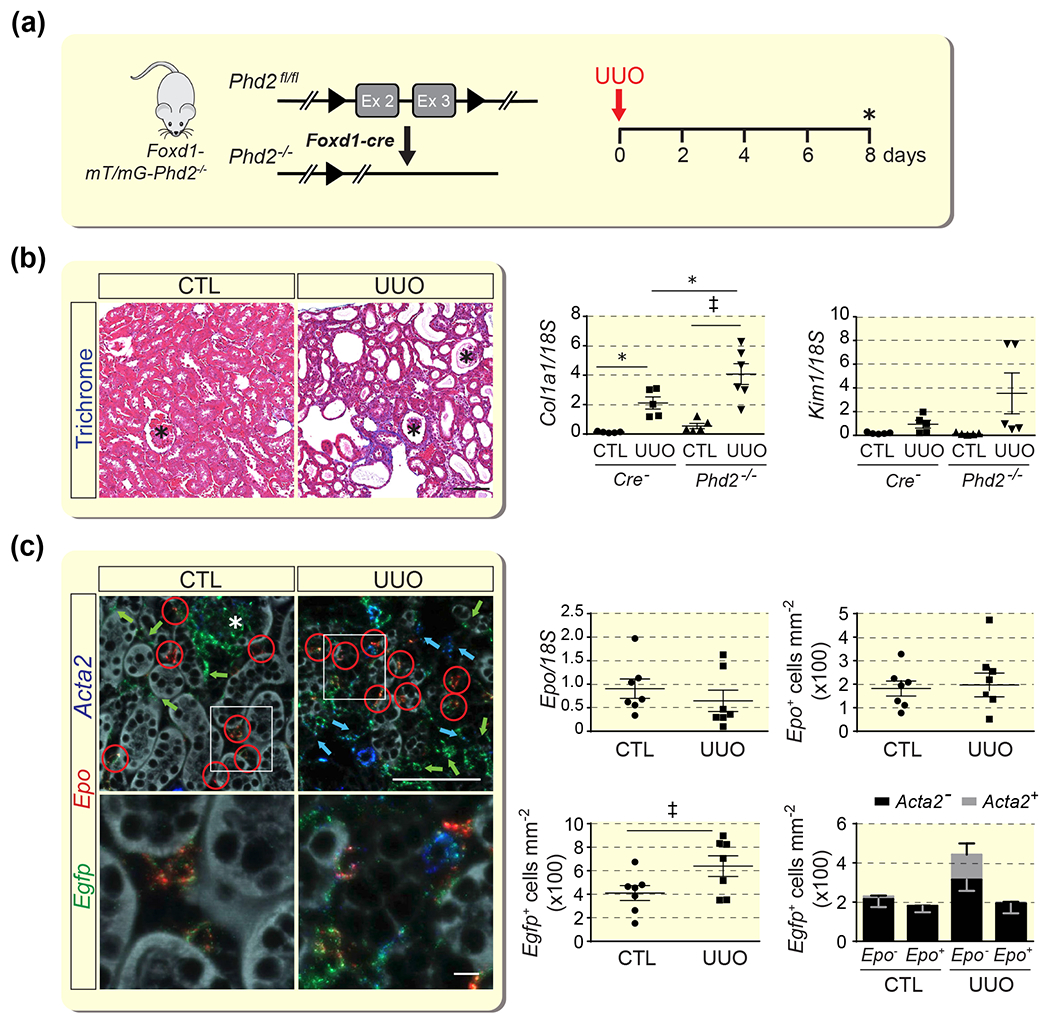
(a) Schematic illustrating the experimental approach; asterisk indicates the time point of analysis. (b) Representative images of Masson’s trichrome staining of CTL and UUO kidneys from Foxd1-mT/mG-Phd2−/− mice at day 8 post-UUO. Scale bar, 100 μm. Right panels, relative levels of collagen type I alpha 1 (Col1a1) and kidney injury molecule 1 (Kim1) transcript levels in whole kidney homogenates (n=5-6). (c) Multiplex RNA fluorescence in situ hybridization detecting enhanced green fluorescent protein (Egfp), erythropoietin (Epo) and α-smooth muscle actin (Acta2) transcripts in sections of contralateral (CTL) and obstructed (UUO) kidney from Foxd1-mT/mG-Phd2−/− mice. Red circles depict Egfp+Epo+, green arrows Egfp+, and blue arrows Egfp+Acta2+ cells; the asterisk depicts a glomerulus. Scale bar, 100 μm for low magnification and 10 μm for high magnification images. Right panels, relative Epo transcript levels in whole kidney homogenates; Epo+, Egfp+, and Acta2+ cell numbers/mm2 in CTL and UUO kidneys from Foxd1-Phd2−/− mutant mice at day 8 following UUO (n=7 for all panels). Data are represented as mean ± SEM; Student’s t-test or two-way ANOVA; *P<0.05, †P<0.01, ‡P<0.001. Abb.: CTL, contralateral; UUO, unilateral ureteral obstruction.
Discussion
In this report, we spatially mapped EPO-producing cells in fibrotic kidneys from mice treated with HIF-PHI molidustat and asked whether pharmacologic HIF-PHD inhibition could activate EPO transcription in myofibroblasts. Our data demonstrate that EPO synthesis in fibrotic kidneys is restricted to tissue areas with preserved kidney architecture and is not associated with myofibroblast transdifferentiation or areas of fibrosis. Our studies suggest that HIF-PHI-induced EPO synthesis in CKD requires the presence of intact non-injured renal parenchyma and is dependent on the degree of fibrosis and residual renal function (Figure 7).
Figure 7. Stimulation of EPO synthesis in fibrotic kidneys following pharmacologic HIF-PHD inhibition.
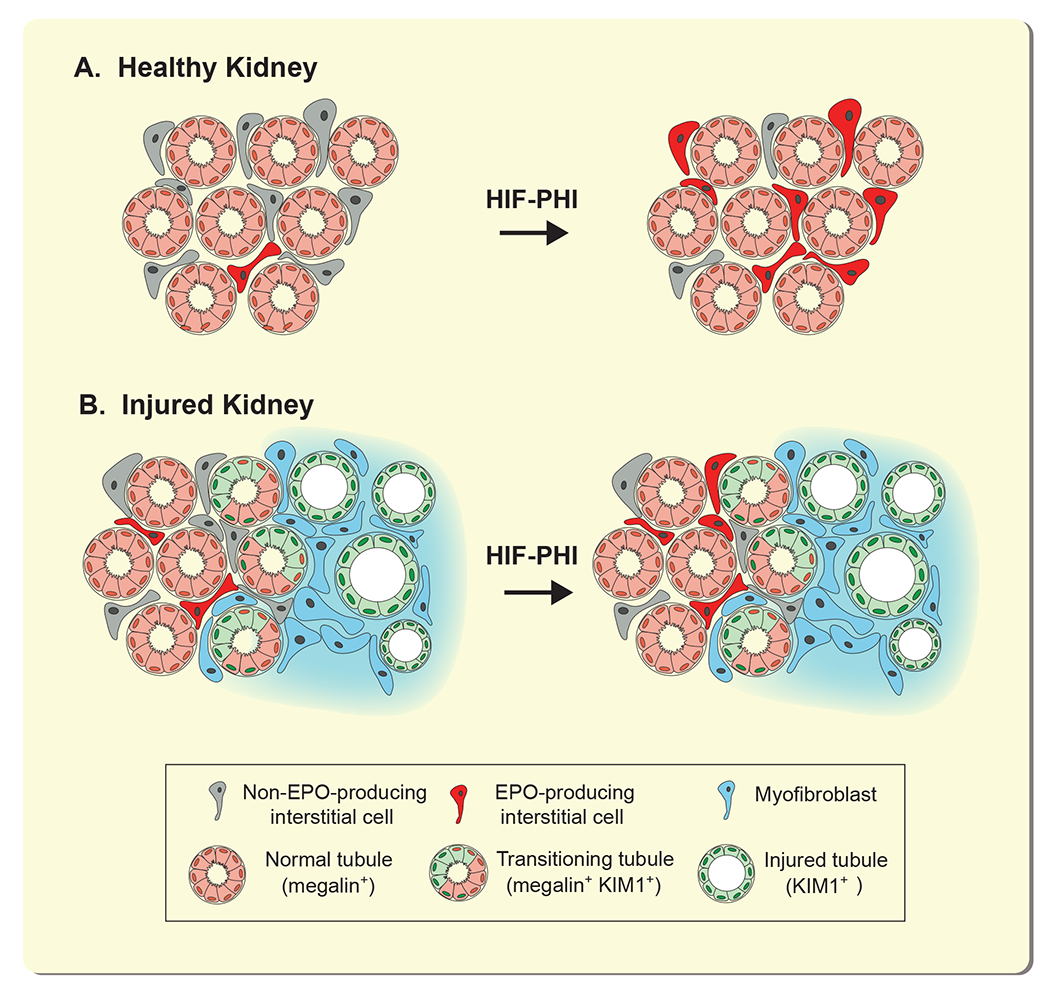
In healthy kidneys (A), a small number of interstitial cells produces EPO at baseline; the number of REPC increases with HIF-PHI administration. In fibrotic kidneys (B), REPC and/or interstitial cells with EPO-producing capacity transdifferentiate into extracellular matrix-producing myofibroblasts. Peritubular interstitial cells that localize around healthy tubules can be stimulated by HIF-PHIs to produce EPO, whereas interstitial cells localizing to areas with KIM-1 expressing injured renal tubules lose their ability to produce EPO and can no longer be stimulated to produce EPO. Abb.: HIF-PHI, hypoxia-inducible factor-prolyl hydroxylase inhibitor; KIM1, kidney injury moelcule 1; REPC, renal EPO-producing cells.
Relative EPO deficiency plays a key role in the development of anemia of CKD. Other contributing factors include absolute and functional iron deficiency, inflammation, uremia and shortened erythrocyte life span.29 A major question in the field has been as to what degree pharmacologic HIF-PHD inhibition is capable of stimulating EPO production in interstitial cells and/or myofibroblasts in fibrotic kidneys. We and other groups have previously shown that, in healthy kidneys, the majority of perivascular interstitial fibroblasts and pericytes in cortex and outer medulla have the capacity to respond to hypoxia with HIF-2 dependent EPO synthesis.28,30 Under normoxic conditions, a small number of REPC localize to the cortico-medullary region, whereas under hypoxic conditions the number of REPC increases proportionally to the degree of hypoxia and HIF-2 activation, resulting in their wide-spread distribution throughout the entire cortex and outer medulla when hypoxia is severe.28,30,31
REPC are derived from FOXD1 stromal cells, express PDGFRB and display molecular features associated with neural crest lineage cells.28,30,32,33 The same perivascular interstitial cells can also give rise to collagen-synthesizing ACTA2-expressing myofibroblasts, as elegantly shown in UUO kidneys by fate tracing studies with an Epo-cre transgenic line in a genetic model of severe anemia.4 In this report, we demonstrate that in response to HIF-PHI administration or acute hypoxic anemia, EPO production in fibrotic kidneys was increased, although significantly less compared to healthy kidneys. Previous cell tracing studies based on GFP expression (Epo-GFP transgene) suggested that pan-Phd inactivation using Epo-cre preserved EPO production in interstitial cells that had undergone transition to myofibroblasts.20 However, these genetic studies are difficult to interpret given the dynamic expression and sensitivity of the Epo-cre transgene to renal hypoxia and the relatively long half-life of GFP that was used to trace EPO-producing cells in this model.20 Our data suggest that myofibroblasts are not capable of producing EPO, as co-expression of Epo with myofibroblast marker Acta2 was only found in a very small percentage of cells in two models of HIF-induced EPO activation. Based on our studies, we propose that once transdifferentiation has occurred, EPO synthesis can no longer be induced by either genetic or pharmacologic HIF-PHD inhibition.
Previous reports indicate that the mechanisms underlying the development of relative EPO deficiency in CKD are complex. REPC transitioning to myofibroblasts are characterized by increased levels of NFκB activity and transforming growth factor beta 1 (TGFB1) signaling. Notably, suppression of NFκB signaling with glucocorticoids and genetic disruption of TGFB1 receptor 2 function can protect from loss of EPO production in injured kidneys.4,32,34 Furthermore, epigenetic reprogramming is likely to play an important role in EPO regulation during kidney disease progression. An increase in the expression of DNA methyl transferases and hypermethylation of Epo 5’-regulatory elements has been reported to be associated with myofibroblast transdifferentiation.4,5,35,36
Our studies in mice with AN indicate that pharmacologic HIF-PHD inhibition is effective in stimulating EPO synthesis in Acta2-negative peritubular interstitial cells that colocalize with megalin-expressing nephron segments but not with KIM1-expressing tubular structures or areas of fibrosis. Whether EPO-deficiency in CKD anemia can be entirely explained by myofibroblast transdifferentiation of renal interstitial cells is not entirely clear. It has been suggested that “pseudo-normoxia” results in relative EPO deficiency due to diminished epithelial oxygen demand, because of the decreased need for sodium reabsorption when GFR is reduced. However, impaired metabolic efficiency,37 and the presence of tissue hypoxia, which has been postulated to be a common final pathway in CKD progression, is difficult to reconcile with this concept.38 Taken together our studies support the notion that relative EPO-deficiency in CKD is a result of myofibroblast transdifferentiation, rather than “pseudo-normoxia”. However, we cannot completely exclude the possibility that “pseudo-normoxia” plays a contributory role in the pathogenesis of CKD anemia.
Our data suggest that the ability of HIF-PHIs to stimulate kidney EPO production is dependent on the degree of myofibroblast differentiation and residual renal function (Figure 7). Therefore, the ability to stimulate liver EPO production would be an important attribute of HIF-PHI compounds, as liver EPO production could compensate for the diminished inducibility of EPO synthesis in severely fibrosed kidneys. Although the kidney is the main source of EPO in the adult under physiological conditions, the liver produces EPO under severe hypoxic conditions.2 Liver-derived EPO can be biochemically distinguished from kidney-derived EPO because of differential glycosylation,23 and has been detected in patients with advanced CKD, where the contribution of liver-derived EPO to serum EPO correlated inversely with estimated GFR.39 Pharmacologic HIF-PHD inhibition has been shown to stimulate liver EPO production in rodent models of CKD anemia.9,14,15,40,41 Although liver EPO production has not been specifically examined in HIF-PHI clinical trials, the notion of increased liver EPO production following HIF-PHI administration in humans was first supported by a single-dose phase 1 study of anephric patients treated with compound FG-2206,42 and has also been demonstrated for compound TP0463518.43 In our studies, we did not detect significant amounts of liver-derived EPO in serum from molidustat-treated mice with AN, which is consistent with previous studies.17 Our findings have clinical implications as they suggest that GFR-dependent dose increases may be needed to stimulate the production of sufficient amounts of endogenous EPO in CKD patients treated with HIF-PHIs. This would be of particular relevance for compounds that have little or no effect on liver EPO production.
In summary, our data indicate that the ability of pharmacologic HIF-PHD inhibition to stimulate EPO synthesis in fibrotic kidneys is not unlimited and dependent on the degree of myofibroblast transdifferentiation and preservation of renal parenchyma. Our findings provide rational for clinical studies that evaluate the impact of residual renal function on EPO responses and drug dosing in patients treated with HIF-PHIs.
Methods and Materials
Animal procedures and drug administration.
All procedures involving mice were performed in accordance with NIH guidelines for the use and care of live animals and were approved by the Vanderbilt University Institutional Animal Care and Use Committee.
To model anemia of CKD in mice, 6-week-old male C57BL/6 mice (The Jackson Laboratory, Bar Harbor, ME, USA) were intermittently fed a 0.25% adenine-containing chow diet (modified LabDiet 5001, 9GK9, TestDiet, St. Louis, MO) as previously described up to 9 weeks.5,44,45 Standard chow (LabDiet 5001, TestDiet) was used as control diet. Mice were switched to control diet for 3 days before sacrifice. Blood was drawn for analysis at the indicated time points. The feeding schedules, time points of drug administration and time points of analysis are outlined in the respective figures.
Molidustat (Bay 85-3934, Cayman Chemical Co, Ann Arbor, MI), which stabilizes both HIF-1α and HIF-2α and has been approved for marketing in Japan,14,21 was dissolved in 1% methylcellulose at 1 mg/ml and was administered by oral gavage at a dose of 10 mg/kg body weight, 4 hours prior to analysis. The timing of analysis is based on previous reports by Flamme and colleagues.14
Phlebotomy to induce anemic hypoxia was performed twice by retro-orbital vein puncture, 24 hr and 6 hr before analysis. Unilateral ureteral obstruction (UUO) was performed in 7- to 9-wk-old male and female mice as previously described.45 Cre-negative littermates were used as control mice. Mice were analyzed on day 8 after ureteral ligation.
Generation and genotyping of mice.
The generation and genotyping of mice carrying the Phd2 floxed allele has been described previously.25 To target Phd2 in FOXD1 stroma-derived cells, mice carrying the Phd2 floxed allele were bred to mice expressing Cre-recombinase under the control of the endogenous Foxd1 promoter,27 generating Foxd1GFP-cre/+;Phd2fl/fl mice, as previously decribed.28 To visualize targeted cells, mice also expressed the Cre-reporter ROSA26-ACTB-tdTomato,-Egfp allele, here referred to as the mT/mG allele.26
Collection and analysis of blood samples.
Serum was obtained from clotted blood by centrifugation using Microtainer tubes (BD Corporation, Franklin, NJ). Hct and serum EPO level were determined as described previously.46 BUN was measured with a colorimetric detection kit (ThermoFisher, Waltham, MA). The glycosylation pattern of EPO was analyzed as described previously.47 For this, ~50 μl of serum was spotted onto Whatman 903 protein saver cards (MAIIA Diagnostics, Uppsala, Sweden). EPO was then purified from the spotted dried serum according to the manufacturer’s instructions and analyzed with a commercial kit (EPO Purification Gel Kit for Blood and Isoform Distribution Kit, MAIIA Diagnostics, Uppsala, Sweden).
RNA analysis.
RNA was isolated using RNeasy kit according to the manufacturer’s protocol (Qiagen, Germantown, MD). For quantitative real-time PCR, cDNA was prepared from 1 μg of total RNA and analyzed using SYBR green or TaqMan PCR Master Mix on a CFX 96 platform (BioRad, Hercules, CA). Primer sequences for the detection of Epo, Col1a1, Kim1, F4/80, Phd3, Pgk1 have been described previously.9,44,46,48,49 18S rRNA was used to normalize mRNA. For the quantification of mRNA expression levels, the relative standard curve method was used according to manufacturer’s instructions (Bio-Rad).
Morphologic analysis.
Kidneys were removed and fixed overnight in 10% formalin and then embedded in paraffin. For morphologic evaluation, kidney sections were analyzed by hematoxylin and eosin or Masson’s trichrome staining using standard protocols. IHC for ACTA2 and cluster of differentiation 31 (CD31) antigen was performed as described previously.28 For the simultaneous visualization of Epo transcripts and KIM1 and/or megalin, anti-KIM1 polyclonal antibody (AF1817 at 1:100 dilution, R&D Systems, Minneapolis, MN) and anti-megalin polyclonal antibody (ab76969 at 1:000 dilution, Abcam, Cambridge, UK) were used.
RNA fluorescence in situ hybridization.
Acta2, Egfp, and Epo transcripts were detected in formalin-fixed, paraffin-embedded kidney sections of comparable sectioning plane by RNA-FISH using the RNAscope® Multiplex Fluorescent kit according to the manufacturer’s instructions (Advanced Cell Diagnostics, Hayward, CA). Tissue slides were imaged on an Apiro Versa 200 automated slide scanner (Leica Biosystems, Buffalo Grove, IL). Images were captured using the Leica Digital Image Hub and overlaid with a 100-μm grid. Cells were counted manually in 5 to 10 random fields per tissue section (0.16 mm2) in cortex and outer medulla by a blinded operator as previously reported.28. Cell counts were expressed as the average number of cells per mm2 per animal and then averaged for each group.
Statistical analysis.
Experimental animal numbers were derived from experience with the procedures, the anticipated effect size, and from a statistical power analysis using an alpha-level of 0.05 with a power of at least 80%. Data were collected in a blinded fashion. Normal distribution of data was assessed by the D’Agostino & Pearson omnibus, Shapiro-Wilk, or KS normality tests. Data are reported as mean ± SEM. Statistical analyses were performed with Prism 6 software (GraphPad Software Inc.) using Student’s t-test, Mann-Whitney test and one-way or two-way ANOVA for multiple group comparisons followed by Tukey’s post-hoc analysis. P values of <0.05 were considered statistically significant.
Supplementary Material
Supplemental Figure S1 (associated with Fig. 2). Serum erythropoietin (sEPO) (A) and relative kidney erythropoietin (Epo) transcript (B) levels in individual mice fed with control diet (Co-diet) or adenine-containing diet in relation to hematocrit (Hct); Hct ranges are given for each panel. Experimental animal numbers are for both Hct ranges are indicated in brackets. Data for mice with Hct >40% are not shown. Data are represented as mean ± SEM; Student’s t-test; *P<0.05, †P<0.01, ‡P<0.001. Abb.: pre, before phlebotomy; post, after phlebotomy.
Supplemental Figure S2 (associated with Fig. 5). Representative images of kidney sections from HIF-PHI-treated, adenine-fed mice subjected to feeding protocol A or B. Kidney sections were analyzed by immunohistochemistry for α-smooth muscle actin (ACTA2) and cluster of differentiation 31 (CD31) antigen. Scale bar, 200 μm. Asterisks depict glomeruli, arrows depict examples of structures with positive staining. Abb.: HIF-PHI, hypoxia-inducible factor-prolyl hydroxylase inhibitor.
Supplemental Figure S3 (associated with Fig. 6). Obstructive nephropathy is associated with a reduction in the number of Epo-expressing cells. (A) Schematic illustration of the experimental model; asterisk indicates the time of analysis in relation to UUO procedure. (B) Representative images of Masson’s trichrome staining and multiplex RNA fluorescence in situ hybridization (RNA-FISH) detecting enhanced green fluorescent protein (Egfp), erythropoietin (Epo) and α-smooth muscle actin (Acta2) in sections of CTL and UUO kidneys from Foxd1-mT/mG mice. Yellow arrows depict Egfp+, red arrows Egfp+Epo+ and magenta arrows Egfp+Acta2+ cells; asterisks depict glomeruli. Scale bar, 100 μm for Masson’s trichrome stained kidney sections and 50 μm for RNA-FISH images. Lower panels, relative collagen type I alpha 1 (Col1a1) and Epo transcript levels in whole kidney homogenates and Epo+ and Egfp+ interstitial cell numbers/mm2 (n=4-5). Data are represented as mean ± SEM; Student’s t-test; *P<0.05, †P<0.01. Abb.: CTL, contralateral; UUO, unilateral ureteral obstruction.
Supplemental Figure S4 (associated with Fig. 6). Representative images of immunohistochemistry for α-smooth muscle actin (ACTA2) in sections of CTL and UUO kidneys from Foxd1-mT/mG or Foxd1-mT/mG-Phd2−/− mice analyzed at day 8 post UUO. Scale bar, 100 μm. Asterisks depict glomeruli and arrows point at areas stained positively for ACTA2. Abb.: CTL, contralateral; UUO, unilateral ureteral obstruction.
Acknowledgement
The data that support the findings of this study are available from the corresponding author upon reasonable request. VHH holds the Krick-Brooks Chair in Nephrology at Vanderbilt University. Studies were supported by NIH grants R01-DK101791, R01-DK081646 (VHH), by a Department of Veterans Affairs Merit Award, 1I01BX002348 (VHH), and the Vanderbilt O’Brien Kidney Center (P30-DK114809). We acknowledge support by the Translational Pathology Shared Resource, NIH Cancer Center Support Grant P30-CA68485, Shared Instrumentation Grant S10-OD023475 and the Digital Histology Shared Resource at Vanderbilt Medical Center (https://www.vumc.org/dhsr). Information about work performed in the Haase Lab can be found at www.haaselab.org.
Footnotes
Disclosure
HK and VHH designed the research studies, analyzed, interpreted data, wrote the manuscript, and made figures. HK, MD, OD and SPP performed experiments, acquired and/or analyzed data. The authors declare that no conflict of interest exists.
References
- 1.McClellan W, Aronoff SL, Bolton WK, et al. The prevalence of anemia in patients with chronic kidney disease. Curr Med Res Opin. 2004;20(9):1501–1510. [DOI] [PubMed] [Google Scholar]
- 2.Koury MJ, Haase VH. Anaemia in kidney disease: harnessing hypoxia responses for therapy. Nat Rev Nephrol. 2015;11(7):394–410. [DOI] [PMC free article] [PubMed] [Google Scholar]
- 3.Nangaku M, Eckardt KU. Pathogenesis of renal anemia. Semin Nephrol. 2006;26(4):261–268. [DOI] [PubMed] [Google Scholar]
- 4.Souma T, Yamazaki S, Moriguchi T, et al. Plasticity of renal erythropoietin-producing cells governs fibrosis. J Am Soc Nephrol. 2013;24(10):1599–1616. [DOI] [PMC free article] [PubMed] [Google Scholar]
- 5.Chang YT, Yang CC, Pan SY, et al. DNA methyltransferase inhibition restores erythropoietin production in fibrotic murine kidneys. J Clin Invest. 2016;126(2):721–731. [DOI] [PMC free article] [PubMed] [Google Scholar]
- 6.Jelkmann WE, Fandrey J, Frede S, Pagel H. Inhibition of erythropoietin production by cytokines. Implications for the anemia involved in inflammatory states. Ann N Y Acad Sci. 1994;718:300–309; discussion 309-311. [PubMed] [Google Scholar]
- 7.La Ferla K, Reimann C, Jelkmann W, Hellwig-Burgel T. Inhibition of erythropoietin gene expression signaling involves the transcription factors GATA-2 and NF-kappaB. FASEB J. 2002;16(13):1811–1813. [DOI] [PubMed] [Google Scholar]
- 8.Rankin EB, Biju MP, Liu Q, et al. Hypoxia-inducible factor-2 (HIF-2) regulates hepatic erythropoietin in vivo. J Clin Invest. 2007;117(4):1068–1077. [DOI] [PMC free article] [PubMed] [Google Scholar]
- 9.Kapitsinou PP, Liu Q, Unger TL, et al. Hepatic HIF-2 regulates erythropoietic responses to hypoxia in renal anemia. Blood. 2010;116(16):3039–3048. [DOI] [PMC free article] [PubMed] [Google Scholar]
- 10.McIntosh BE, Hogenesch JB, Bradfield CA. Mammalian Per-Arnt-Sim proteins in environmental adaptation. Annu Rev Physiol. 2010;72:625–645. [DOI] [PubMed] [Google Scholar]
- 11.Kaelin WG, Ratcliffe PJ Jr.. Oxygen sensing by metazoans: the central role of the HIF hydroxylase pathway. Mol Cell. 2008;30(4):393–402. [DOI] [PubMed] [Google Scholar]
- 12.Semenza GL. Hypoxia-inducible factors in physiology and medicine. Cell. 2012;148(3):399–408. [DOI] [PMC free article] [PubMed] [Google Scholar]
- 13.Haase VH. Hypoxia-inducible factor-prolyl hydroxylase inhibitors in the treatment of anemia of chronic kidney disease. Kidney Int Suppl (2011). 2021;11(1):8–25. [DOI] [PMC free article] [PubMed] [Google Scholar]
- 14.Flamme I, Oehme F, Ellinghaus P, Jeske M, Keldenich J, Thuss U. Mimicking Hypoxia to Treat Anemia: HIF-Stabilizer BAY 85-3934 (Molidustat) Stimulates Erythropoietin Production without Hypertensive Effects. PLoS One. 2014;9(11):e111838. [DOI] [PMC free article] [PubMed] [Google Scholar]
- 15.Barrett TD, Palomino HL, Brondstetter TI, et al. Prolyl hydroxylase inhibition corrects functional iron deficiency and inflammation-induced anaemia in rats. Br J Pharmacol. 2015;172(16):4078–4088. [DOI] [PMC free article] [PubMed] [Google Scholar]
- 16.Schley G, Klanke B, Kalucka J, et al. Mononuclear phagocytes orchestrate prolyl hydroxylase inhibition-mediated renoprotection in chronic tubulointerstitial nephritis. Kidney Int. 2019;96(2):378–396. [DOI] [PubMed] [Google Scholar]
- 17.Li L, Nakano D, Zhang A, et al. Effects of post-renal anemia treatment with the HIF-PHD inhibitor molidustat on adenine-induced renal anemia and kidney disease in mice. et al. 2020;144(4):229–236. [DOI] [PubMed] [Google Scholar]
- 18.Del Balzo U, Signore PE, Walkinshaw G, et al. Nonclinical Characterization of the Hypoxia-Inducible Factor Prolyl Hydroxylase Inhibitor Roxadustat, a Novel Treatment of Anemia of Chronic Kidney Disease. J Pharmacol Exp Ther. 2020;374(2):342–353. [DOI] [PubMed] [Google Scholar]
- 19.Dahl SL, Pfundstein S, Hunkeler R, et al. Fate-mapping of erythropoietin-producing cells in mouse models of hypoxaemia and renal tissue remodelling reveals repeated recruitment and persistent functionality. Acta Physiol (Oxf). 2022;234(3):e13768. [DOI] [PMC free article] [PubMed] [Google Scholar]
- 20.Souma T, Nezu M, Nakano D, et al. Erythropoietin Synthesis in Renal Myofibroblasts Is Restored by Activation of Hypoxia Signaling. J Am Soc Nephrol. 2016;27(2):428–438. [DOI] [PMC free article] [PubMed] [Google Scholar]
- 21.Yeh TL, Leissing TM, Abboud MI, et al. Molecular and cellular mechanisms of HIF prolyl hydroxylase inhibitors in clinical trials. Chem Sci. 2017;8(11):7651–7668. [DOI] [PMC free article] [PubMed] [Google Scholar]
- 22.Waanders F, van Timmeren MM, Stegeman CA, Bakker SJ, van Goor H. Kidney injury molecule-1 in renal disease. J Pathol. 2010;220(1):7–16. [DOI] [PubMed] [Google Scholar]
- 23.Lonnberg M, Garle M, Lonnberg L, Birgegard G. Patients with anaemia can shift from kidney to liver production of erythropoietin as shown by glycoform analysis. J Pharm Biomed Anal. 2013;81-82:187–192. [DOI] [PubMed] [Google Scholar]
- 24.Lin SL, Kisseleva T, Brenner DA, Duffield JS. Pericytes and perivascular fibroblasts are the primary source of collagen-producing cells in obstructive fibrosis of the kidney. Am J Pathol. 2008;173(6):1617–1627. [DOI] [PMC free article] [PubMed] [Google Scholar]
- 25.Takeda K, Ho VC, Takeda H, Duan LJ, Nagy A, Fong GH. Placental but not heart defects are associated with elevated hypoxia-inducible factor alpha levels in mice lacking prolyl hydroxylase domain protein 2. Mol Cell Biol. 2006;26(22):8336–8346. [DOI] [PMC free article] [PubMed] [Google Scholar]
- 26.Muzumdar MD, Tasic B, Miyamichi K, Li L, Luo L. A global double-fluorescent Cre reporter mouse. Genesis. 2007;45(9):593–605. [DOI] [PubMed] [Google Scholar]
- 27.Kobayashi A, Mugford JW, Krautzberger AM, Naiman N, Liao J, McMahon AP. Identification of a Multipotent Self-Renewing Stromal Progenitor Population during Mammalian Kidney Organogenesis. Stem Cell Reports. 2014;3(4):650–662. [DOI] [PMC free article] [PubMed] [Google Scholar]
- 28.Kobayashi H, Liu Q, Binns TC, et al. Distinct subpopulations of FOXD1 stroma-derived cells regulate renal erythropoietin. J Clin Invest. 2016;126(5):1926–1938. [DOI] [PMC free article] [PubMed] [Google Scholar]
- 29.Babitt JL, Lin HY. Mechanisms of Anemia in CKD. J Am Soc Nephrol. 2012;23(10):1631–1634. [DOI] [PMC free article] [PubMed] [Google Scholar]
- 30.Obara N, Suzuki N, Kim K, Nagasawa T, Imagawa S, Yamamoto M. Repression via the GATA box is essential for tissue-specific erythropoietin gene expression. Blood. 2008;111(10):5223–5232. [DOI] [PubMed] [Google Scholar]
- 31.Koury ST, Koury MJ, Bondurant MC, Caro J, Graber SE. Quantitation of erythropoietin-producing cells in kidneys of mice by in situ hybridization: correlation with hematocrit, renal erythropoietin mRNA, and serum erythropoietin concentration. Blood. 1989;74(2):645–651. [PubMed] [Google Scholar]
- 32.Asada N, Takase M, Nakamura J, et al. Dysfunction of fibroblasts of extrarenal origin underlies renal fibrosis and renal anemia in mice. J Clin Invest. 2011;121(10):3981–3990. [DOI] [PMC free article] [PubMed] [Google Scholar]
- 33.Broeker KAE, Fuchs MAA, Schrankl J, et al. Different subpopulations of kidney interstitial cells produce erythropoietin and factors supporting tissue oxygenation in response to hypoxia in vivo. Kidney Int. 2020;98(4):918–931. [DOI] [PubMed] [Google Scholar]
- 34.Fuchs MAA, Broeker KAE, Schrankl J, et al. Inhibition of transforming growth factor beta1 signaling in resident interstitial cells attenuates profibrotic gene expression and preserves erythropoietin production during experimental kidney fibrosis in mice. Kidney Int. 2021;100(1):122–137. [DOI] [PubMed] [Google Scholar]
- 35.Sato K, Hirano I, Sekine H, et al. An immortalized cell line derived from renal erythropoietin-producing (REP) cells demonstrates their potential to transform into myofibroblasts. Sci Rep. 2019;9(1):11254. [DOI] [PMC free article] [PubMed] [Google Scholar]
- 36.Imeri F, Nolan KA, Bapst AM, et al. Generation of renal Epo-producing cell lines by conditional gene tagging reveals rapid HIF-2 driven Epo kinetics, cell autonomous feedback regulation, and a telocyte phenotype. Kidney Int. 2019;95(2):375–387. [DOI] [PubMed] [Google Scholar]
- 37.Palm F, Nordquist L. Renal tubulointerstitial hypoxia: cause and consequence of kidney dysfunction. Clin Exp Pharmacol Physiol. 2011;38(7):474–480. [DOI] [PMC free article] [PubMed] [Google Scholar]
- 38.Nangaku M Chronic hypoxia and tubulointerstitial injury: a final common pathway to end-stage renal failure. J Am Soc Nephrol. 2006;17(1):17–25. [DOI] [PubMed] [Google Scholar]
- 39.de Seigneux S, Lundby AK, Berchtold L, Berg AH, Saudan P, Lundby C. Increased Synthesis of Liver Erythropoietin with CKD. J Am Soc Nephrol. 2016;27(8):2265–2269. [DOI] [PMC free article] [PubMed] [Google Scholar]
- 40.Fukui K, Shinozaki Y, Kobayashi H, et al. JTZ-951 (enarodustat), a hypoxia-inducibe factor prolyl hydroxylase inhibitor, stabilizes HIF-alpha protein and induces erythropoiesis without effects on the function of vascular endothelial growth factor. Eur J Pharmacol. 2019;859:172532. [DOI] [PubMed] [Google Scholar]
- 41.Kato S, Ochiai N, Takano H, et al. TP0463518, a novel prolyl hydroxylase inhibitor, specifically induces erythropoietin production in the liver. J Pharmacol Exp Ther. 2019;371(3):675–683. [DOI] [PubMed] [Google Scholar]
- 42.Bernhardt WM, Wiesener MS, Scigalla P, et al. Inhibition of prolyl hydroxylases increases erythropoietin production in ESRD. J Am Soc Nephrol. 2010;21(12):2151–2156. [DOI] [PMC free article] [PubMed] [Google Scholar]
- 43.Shinfuku A, Shimazaki T, Fujiwara M, et al. Novel Compound Induces Erythropoietin Secretion through Liver Effects in Chronic Kidney Disease Patients and Healthy Volunteers. Am J Nephrol. 2018;48(3):157–164. [DOI] [PMC free article] [PubMed] [Google Scholar]
- 44.Higgins DF, Kimura K, Bernhardt WM, et al. Hypoxia promotes fibrogenesis in vivo via HIF-1 stimulation of epithelial-to-mesenchymal transition. J Clin Invest. 2007;117(12):3810–3820. [DOI] [PMC free article] [PubMed] [Google Scholar]
- 45.Kobayashi H, Gilbert V, Liu Q, et al. Myeloid cell-derived hypoxia-inducible factor attenuates inflammation in unilateral ureteral obstruction-induced kidney injury. J Immunol. 2012;188(10):5106–5115. [DOI] [PMC free article] [PubMed] [Google Scholar]
- 46.Liu Q, Davidoff O, Niss K, Haase VH. Hypoxia-inducible factor regulates hepcidin via erythropoietin-induced erythropoiesis. J Clin Invest. 2012;122(12):4635–4644. [DOI] [PMC free article] [PubMed] [Google Scholar]
- 47.Lundby AK, Keiser S, Siebenmann C, Schaffer L, Lundby C. Kidney-synthesized erythropoietin is the main source for the hypoxia-induced increase in plasma erythropoietin in adult humans. Eur J Appl Physiol. 2014;114(6):1107–1111. [DOI] [PubMed] [Google Scholar]
- 48.Rankin EB, Higgins DF, Walisser JA, Johnson RS, Bradfield CA, Haase VH. Inactivation of the arylhydrocarbon receptor nuclear translocator (Arnt) suppresses von Hippel-Lindau disease-associated vascular tumors in mice. Mol Cell Biol. 2005;25(8):3163–3172. [DOI] [PMC free article] [PubMed] [Google Scholar]
- 49.Kapitsinou PP, Jaffe J, Michael M, et al. Preischemic targeting of HIF prolyl hydroxylation inhibits fibrosis associated with acute kidney injury. Am J Physiol Renal Physiol. 2012;302(9):F1172–1179. [DOI] [PMC free article] [PubMed] [Google Scholar]
Associated Data
This section collects any data citations, data availability statements, or supplementary materials included in this article.
Supplementary Materials
Supplemental Figure S1 (associated with Fig. 2). Serum erythropoietin (sEPO) (A) and relative kidney erythropoietin (Epo) transcript (B) levels in individual mice fed with control diet (Co-diet) or adenine-containing diet in relation to hematocrit (Hct); Hct ranges are given for each panel. Experimental animal numbers are for both Hct ranges are indicated in brackets. Data for mice with Hct >40% are not shown. Data are represented as mean ± SEM; Student’s t-test; *P<0.05, †P<0.01, ‡P<0.001. Abb.: pre, before phlebotomy; post, after phlebotomy.
Supplemental Figure S2 (associated with Fig. 5). Representative images of kidney sections from HIF-PHI-treated, adenine-fed mice subjected to feeding protocol A or B. Kidney sections were analyzed by immunohistochemistry for α-smooth muscle actin (ACTA2) and cluster of differentiation 31 (CD31) antigen. Scale bar, 200 μm. Asterisks depict glomeruli, arrows depict examples of structures with positive staining. Abb.: HIF-PHI, hypoxia-inducible factor-prolyl hydroxylase inhibitor.
Supplemental Figure S3 (associated with Fig. 6). Obstructive nephropathy is associated with a reduction in the number of Epo-expressing cells. (A) Schematic illustration of the experimental model; asterisk indicates the time of analysis in relation to UUO procedure. (B) Representative images of Masson’s trichrome staining and multiplex RNA fluorescence in situ hybridization (RNA-FISH) detecting enhanced green fluorescent protein (Egfp), erythropoietin (Epo) and α-smooth muscle actin (Acta2) in sections of CTL and UUO kidneys from Foxd1-mT/mG mice. Yellow arrows depict Egfp+, red arrows Egfp+Epo+ and magenta arrows Egfp+Acta2+ cells; asterisks depict glomeruli. Scale bar, 100 μm for Masson’s trichrome stained kidney sections and 50 μm for RNA-FISH images. Lower panels, relative collagen type I alpha 1 (Col1a1) and Epo transcript levels in whole kidney homogenates and Epo+ and Egfp+ interstitial cell numbers/mm2 (n=4-5). Data are represented as mean ± SEM; Student’s t-test; *P<0.05, †P<0.01. Abb.: CTL, contralateral; UUO, unilateral ureteral obstruction.
Supplemental Figure S4 (associated with Fig. 6). Representative images of immunohistochemistry for α-smooth muscle actin (ACTA2) in sections of CTL and UUO kidneys from Foxd1-mT/mG or Foxd1-mT/mG-Phd2−/− mice analyzed at day 8 post UUO. Scale bar, 100 μm. Asterisks depict glomeruli and arrows point at areas stained positively for ACTA2. Abb.: CTL, contralateral; UUO, unilateral ureteral obstruction.