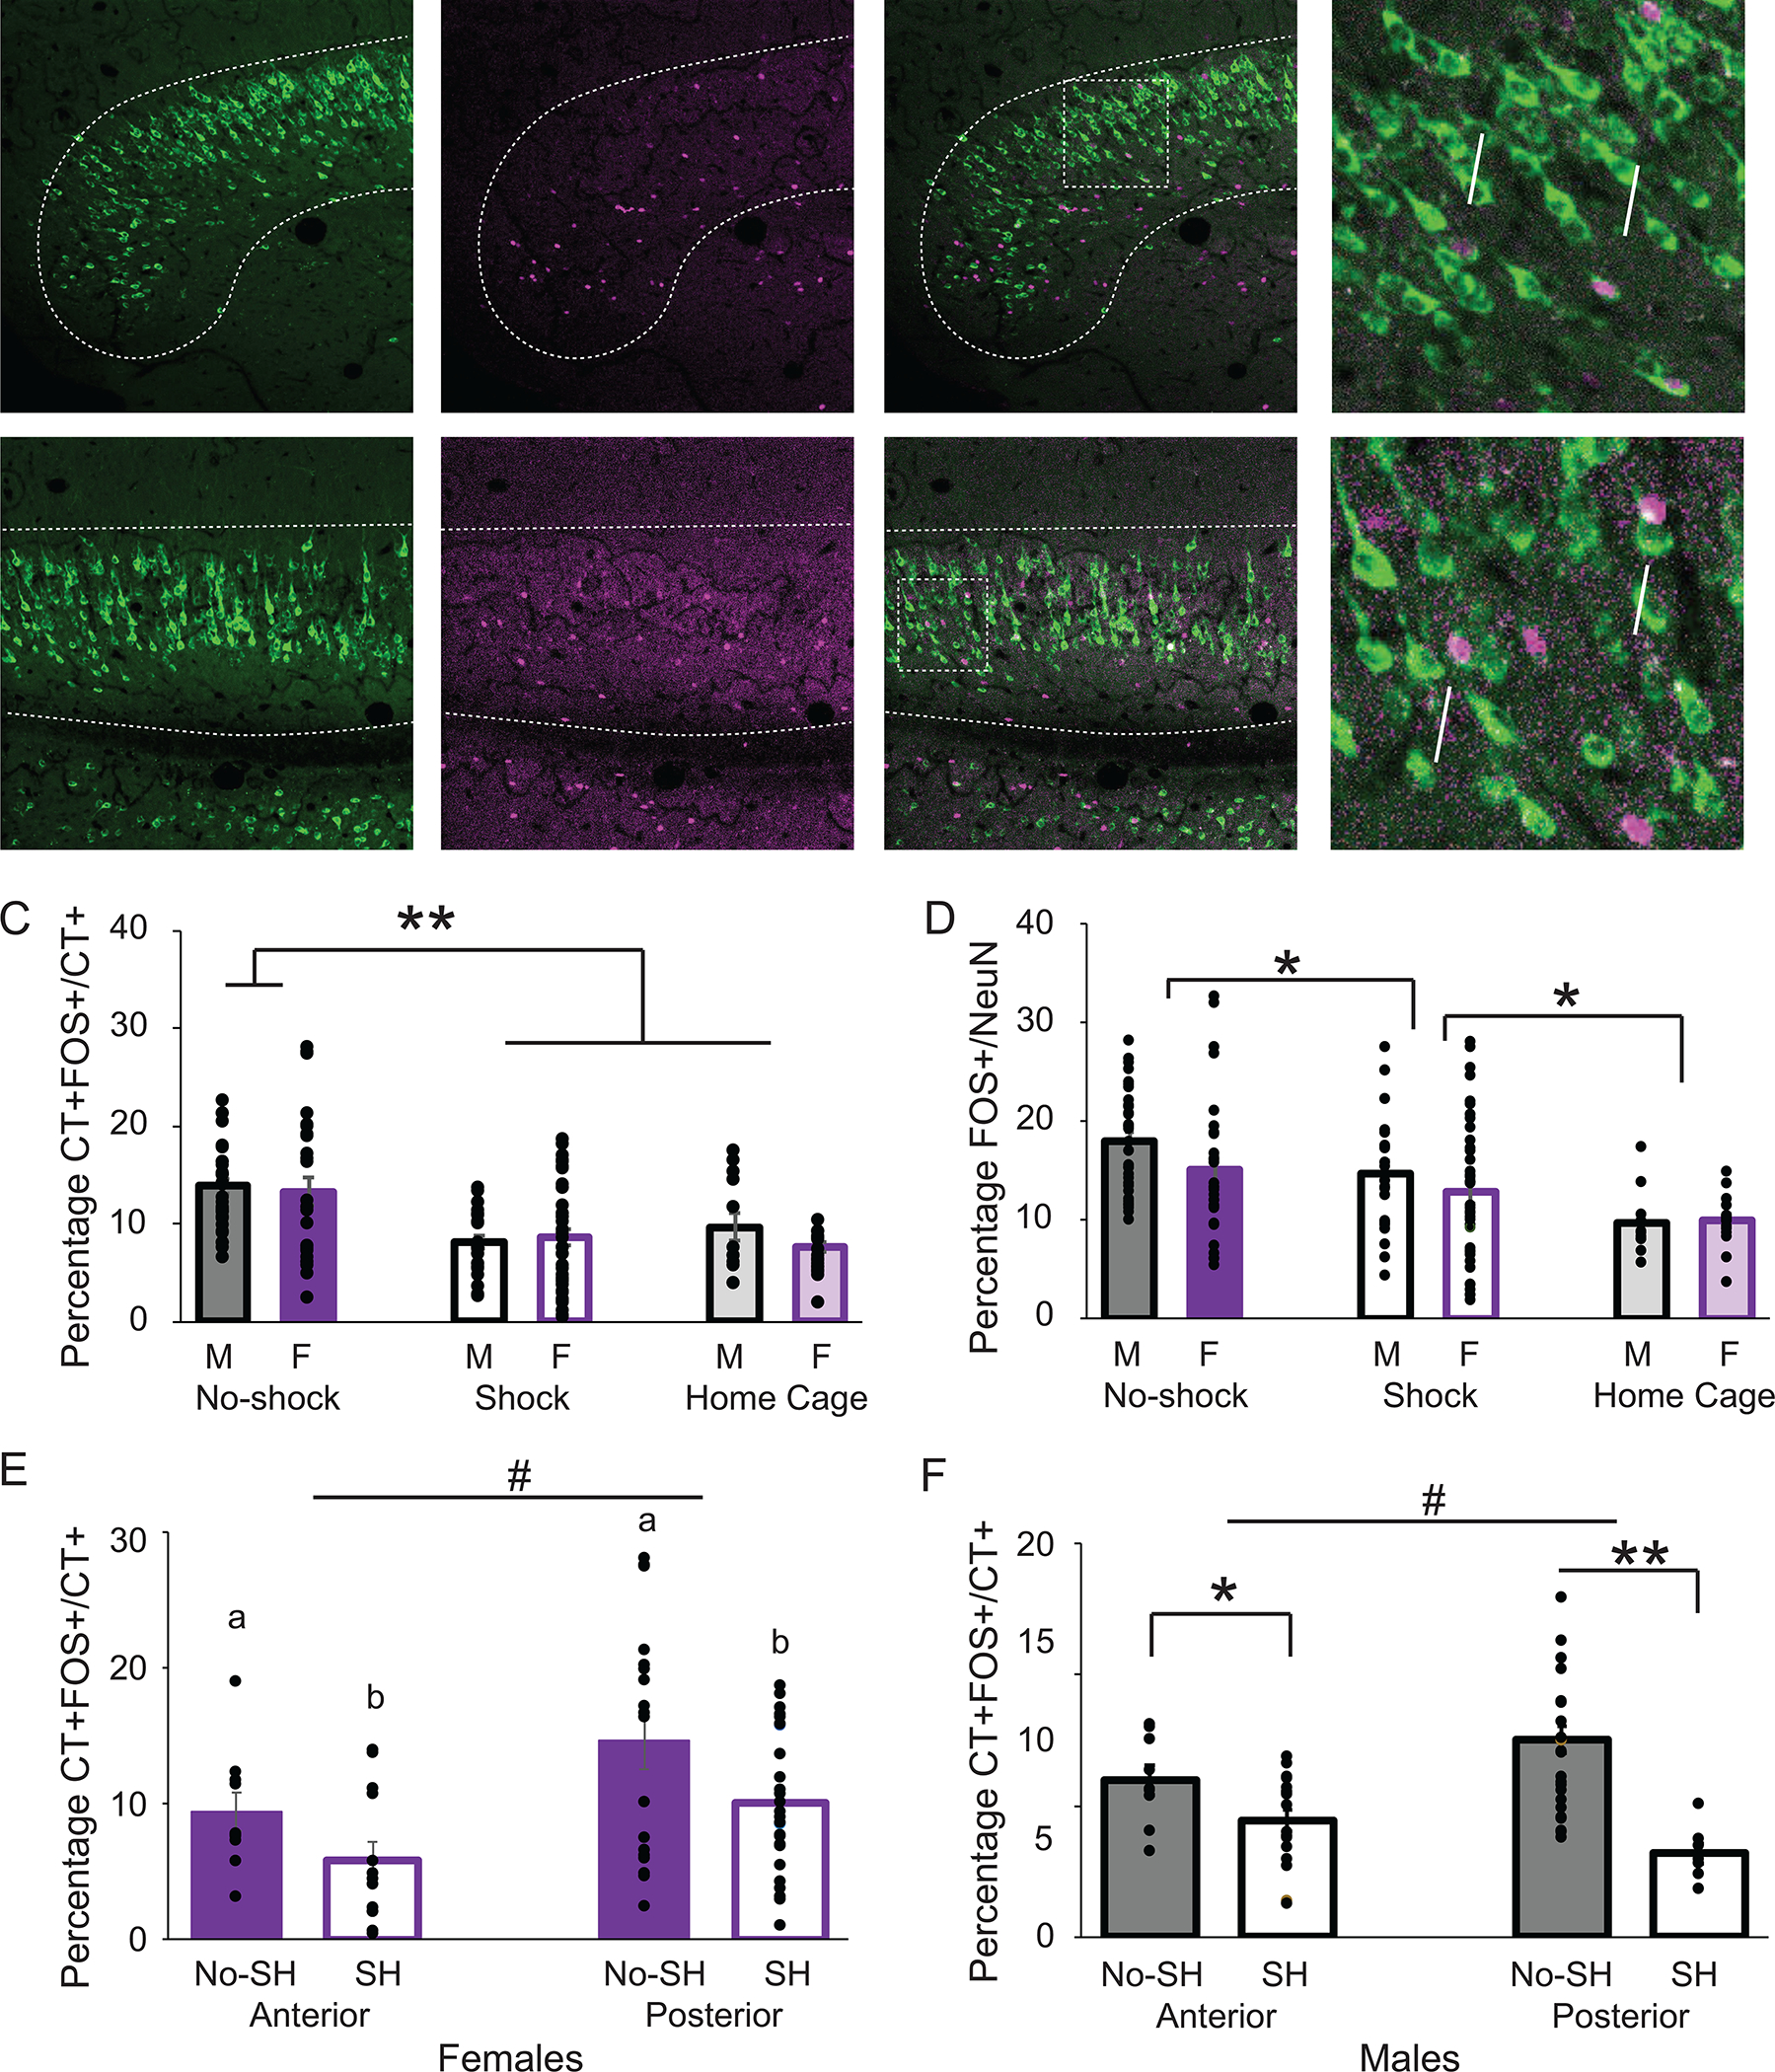
Figure 4:

Differential effects of context fear expression on FOS immunoreactivity in the vSUB-BNST path in males and females. Confocal images of the anterior medial (A) and lateral (B) vSUB. CT A488 (left) FOS (middle) and overlay (right) Scale bars =100μm. Magnification of overlay (far right). Scale bars = 25μm. Arrows point to double-labeled cells. C: Double-labeled CT+/FOS+ cells as a percentage of CT+ cells in the vSUB in the no shock, shock and home cage groups in males (M) and females (F). Asterisks indicates a significant difference in the percentage of CT+FOS+/CT+ cells between the no shock group and the shock and home cage groups (p<0.0001). D: Percentage of FOS positive/NeuN (total number of neurons) in the vSUB in the no shock, shock and home cage groups in males (M) and females (F). Asterisk indicates a significant difference in the percentage of FOS+/NeuN cells between groups (p<0.05). E: Double-labeled CT+/FOS+ cells as a percentage of CT+ cells in the vSUB in the no shock (NS) and shock (S) groups in females in the anterior and posterior vSUB. Letters indicate significant differences (p<0.05). Hash indicates significantly more CT+FOS/CT+ in posterior regions than anterior (p<0.005). F: Double-labeled CT+/FOS+ cells as a percentage of CT+ cells in the vSUB in the no shock (NS), and shock (S) groups in males in the anterior and posterior vSUB. Asterisks indicate significantly more CT+FOS/CT+ in the no shock group than in the shock group in both the anterior (p<0.05) and posterior (p<0.001) vSUB. Hash indicates significantly more CT+FOS/CT+ in posterior regions than anterior (p<0.05).
