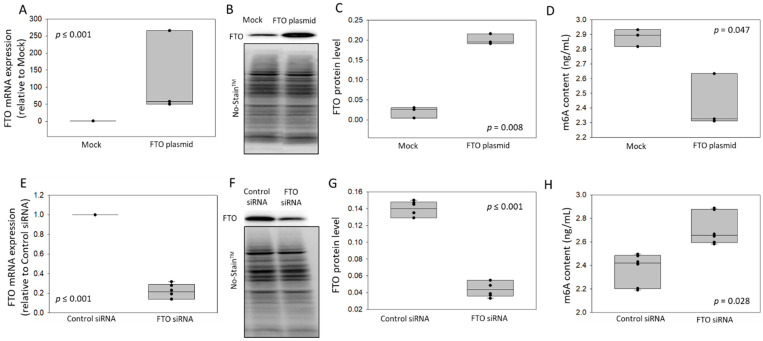
Figure 1.
Gain- and loss-of-function experiments to validate m6A detection by LC-MS. SH-SY5Y cells were transfected for 48 h with a FTO over-expressing plasmid (A–D) or FTO siRNA (E–H). FTO mRNA levels were measured by RT-qPCR and normalized by 18S. Relative FTO expression was calculated versus mock (A, n = 3) or control siRNA (E, n = 6). FTO protein was quantified by Western blot, and No-StainTM Total Protein Normalization was applied for relative protein level calculation: representative experiments (B,F; unprocessed original blot images are provided in Supplementary Figure S3) and quantification (C, n = 3 and G, n = 6). M6A levels (ng/mL) were assessed by LC-MS (D, n = 3 and H, n = 6). p-values from 2-group comparisons are shown.

