Abstract
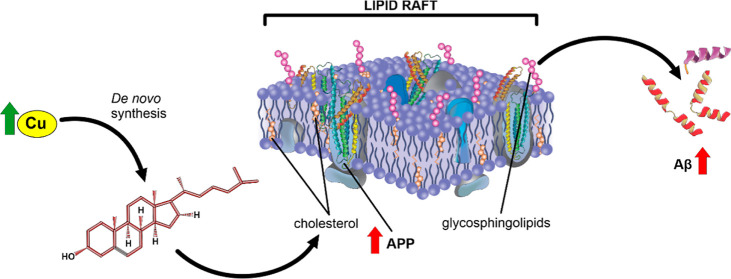
Although copper (Cu) is an essential trace metal for cells, it can induce harmful effects as it participates in the Fenton reaction. Involuntary exposure to Cu overload is much more common than expected and has been linked with neurodegeneration, particularly with Alzheimer’s disease (AD) evidenced by a positive correlation between free Cu in plasma and the severity of the disease. It has been suggested that Cu imbalance alters cholesterol (Chol) homeostasis and that high membrane Chol promotes the amyloidogenic processing of the amyloid precursor protein (APP) secreting the β-amyloid (Aβ) peptide. Despite the wide knowledge on the effects of Cu in mature brain metabolism, the consequence of its overload on immature neurons remains unknown. Therefore, we used an undifferentiated human neuroblastoma cell line (SH-SY5Y) to analyze the effect of sublethal concentrations of Cu on 1— de novo Chol synthesis and membrane distribution; 2—APP levels in cells and its distribution in membrane rafts; 3—the levels of Aβ in the culture medium. Our results demonstrated that Cu increases reactive oxygen species (ROS) and favors Chol de novo synthesis in both ROS-dependent and independent manners. Also, at least part of these effects was due to the activation of 3-hydroxy-3-methyl glutaryl CoA reductase (HMGCR). In addition, Cu increases the Chol/PL ratio in the cellular membranes, specifically Chol content in membrane rafts. We found no changes in total APP cell levels; however, its presence in membrane rafts increases with the consequent increase of Aβ in the culture medium. We conclude that Cu overload favors Chol de novo synthesis in both ROS-dependent and independent manners, being at least in part, responsible for the high Chol levels found in the cell membrane and membrane rafts. These may promote the redistribution of APP into the rafts, favoring the amyloidogenic processing of this protein and increasing the levels of Aβ.
1. Introduction
Copper (Cu) is an essential trace metal, which is a catalytic cofactor for many enzymes.1,2 However, Cu overload could be hazardous to human health since it can participate in the Fenton reaction, producing radical species.3,4 Probably associated with this, metal ion imbalance and oxidative stress are considered risk factors for the development of sporadic Alzheimer’s disease (AD).5,6 In fact, Bush and Tanzi proposed the “metal hypothesis”, suggesting that Aβ neuropathogenic events are promoted by the interaction of Aβ with metals, specifically with Cu and Zn.7 Brewer has reviewed that Cu++, but not Cu+, enhances amyloid plaque formation.8 He proposed that drinking water from Cu plumbing is the main source for the general population.8 In addition, we have previously demonstrated that the use of Cu intrauterine devices (Cu-IUD) and Cu based-pesticides are also sources of Cu overload.9,10 Plasmatic Cu is able to cross the blood–brain barrier (BBB),11,12 being mainly achieved as a free Cu ion (not bound to proteins).12 In line with this, it is interesting to note that AD brains possess a higher proportion of redox-active metals than healthy brains13 and that Cu ions are closely involved in AD etiopathogenesis.14−16
Besides the metal hypothesis, there is a “lipid hypothesis of AD” that proposes that changes in the structure and properties of membranes would trigger amyloidogenic toxicity.17 Therefore, an association between cholesterol (Chol) levels and AD development has been suggested, considering hypercholesterolemia as a risk factor.18−20 In fact, alterations in Chol metabolism are important for the amyloid plaque formation process and in the excessive Tau phosphorylation,21 both hallmarks of AD. Rises in Chol levels and high reactive oxygen species (ROS) could lead to an increase in oxysterol production, making membranes more sensitive to Aβ and enhancing its neurotoxicity.22,23 In addition, ROS production could also cause an imbalance of saturated/unsaturated fatty acids present in membrane phospholipids, influencing their biophysical properties.24,25 It is widely known that the cortex and hippocampus are especially affected in AD.26 Interestingly, recent evidence shows neurogenesis in some regions of the adult brain, which depends on the availability of immature neurons,27,28 and the impairment of hippocampal neurogenesis is related to cognitive decline and AD development.29,30
Membrane rafts are lipid microdomains rich in Chol and sphingolipids. Changes in their lipid composition and Chol homeostasis favor the amyloidogenic pathway of amyloid precursor protein (APP), thus increasing Aβ levels, which could be involved in AD development and progress.31 In addition, it was demonstrated that nonpathogenic aging induces alterations in the lipid composition of prefrontal cortex rafts from postmortem adults32 and that it might be involved in the pathogenesis of AD.33−37
It seems that the previously mentioned “metal hypothesis” and the “lipid hypothesis” are not linked. However, we found higher levels of Chol in the brains of Wistar rats intraperitoneally injected with Cu than in noninjected ones.38 This result, together with those reported by other authors,39,40 made us wonder if Cu overload could lead to an increase in Chol synthesis. Thus, we aim to elucidate the possible effects of Cu overload on Chol synthesis in immature neurons since it is known that immature neurons synthesize their own Chol41 and its possible association with AD-like neurodegeneration onset. In order to test this, we used an undifferentiated human neuroblastoma cell line (SH-SY5Y) as a model for immature neurons, in which de novo Chol synthesis is active.42 We analyzed the effects of Cu exposure on Chol de novo synthesis pathway, Chol membrane distribution, and its consequences on APP levels and distribution in membrane rafts. Finally, we analyzed the levels of Aβ in the culture medium. Furthermore, we have dissected whether the Cu-induced effects were dependent or independent of ROS generation.
2. Materials and Methods
2.1. Chemicals
Sodium [14C] acetate (56.8 Ci/mol) was obtained from PerkinElmer (Boston, MA, USA); 1,1,3,3-tetramethoxypropane (TMP), resazurin sodium salt, and Nycodenz were purchased from Sigma-Aldrich (St. Louis, Missouri, US). All other chemicals used were of analytical grade and were purchased from Merck (Darmstadt, Germany), Natocor (Córdoba, Argentina), or Carlo Erba (Milan, Italy).
2.2. Cell Culture
The undifferentiated human neuroblastoma (SH-SY5Y) cell line from ATCC (American Type Culture Collection, Manassas, Virginia, US) was used between passages 15 and 25. Monolayer cultures were grown in DMEM/F12 (1:1) and were supplemented with 10% fetal calf serum (FCS, Natocor, Córdoba, Argentina) and 100 μg/mL streptomycin. The reason why undifferentiated SH-SY5Y cells were used is that immature neurons synthesize their own Chol.43,44
2.3. Cell Treatments
2.3.1. Cell Viability
To determine a noncytotoxic concentration of CuSO4, FeSO4, and ZnSO4 as supplements of Cu++, Fe++, and Zn++ (mentioned as Cu, Fe, and Zn, respectively, along the text), cell viability curves were obtained by the resazurin method.45 This method is based on the reduction of resazurin by living cells, generating a fluorescent product (resorufin). In brief, SH-SY5Y were seeded in 96-well plates and grown to semiconfluence. Then, cells were exposed to different concentrations of CuSO4 (50, 100, 200, 300, 400, 500, 600, 700, 800, 900, 1000, and 1500 μM), FeSO4 (100, 200, 400, 600, and 800 μM), or ZnSO4 (100, 200, 400, 600, and 800 μM) dissolved in an ultrafiltered (Millipore 0.22 μm, NY, USA) sterile phosphate-buffered solution (PBS). After 24 h of treatment, 0.11 mg/mL/well of resazurin was added to the plates for 2 h. Cell viability was measured fluorometrically through excitation and emission filters centered at 535 and 595 nm, respectively (ex 535/em 595) with a microplate reader (Beckman Coulter DTX 880). The cytotoxic effect of Cu was calculated as a percentage from the control (PBS only) calculated as % viability = (F – F0/Fc – F0) × 100, where F, F0, and Fc are the intensity of fluorescence in the Cu-treated cells, culture medium, or untreated cells, respectively.
2.3.2. Chol Determination
2.3.2.1. De novo Chol Synthesis
De novo Chol synthesis was assessed by the incorporation of [14C] acetate (1 μCi/mL in the culture medium) in semiconfluence Petri dishes with or without (control) 200 μM of CuSO4, 200 μM FeSO4, or 200 μM ZnSO4 in PBS. After 18 h of treatment, the culture medium was removed and replaced with a fresh medium (FCS-free) containing [14C] acetate with or without CuSO4 for the final 6 h of treatment. After 24 h of Cu treatment, cells were washed three times with ice-cold PBS (pH 7.4), mechanically detached from the plate, and centrifuged at 500g for 10 min. Cells were resuspended in 300 μL of lysis buffer [N-2-hydroxyethylpiperazine-N-2-ethane sulfonic acid (HEPES) 20 mM pH 7.40, NaCl 100 mM, EDTA 5 mM, Triton X-100, 1% v/v] and sonicated (NUMAK, LUZ-30A). An aliquot of the homogenate was used to determine the cellular protein content.46 The remaining homogenate was used for lipid extraction by the method of Folch.47 After saponification (with 10% potassium hydroxide for 1 h at 80 °C), the nonsaponifiable fraction containing Chol was separated by thin-layer chromatography (TLC) (Merck) using 100% chloroform as the mobile phase. A standard of Chol (Sigma, 57-88-5) was run in parallel. De novo-synthesized Chol was detected by autoradiography with a storage phosphorous screen (GE Healthcare). Quantitative densitometric analysis was performed using ImageJ software (ImageJ software version 1.51 j8, JAVA).
2.3.2.2. Chol in Lipid Rafts
SH-SY5Y cells were grown to semiconfluency and treated with a culture medium with or without 200 μM of CuSO4 for 24 h. After treatment, cells were washed and harvested in lysis buffer (HEPES 20 mM pH 7.40, NaCl 100 mM, EDTA 5 mM, Triton X-100, 1% v/v). After incubation, the lysate was diluted with an equal volume of 90% (v/v) sucrose prepared in TNE buffer (10 mM Tris, 200 mM NaCl, 1 mM EDTA, pH 7.4). The lysate contained in 45% sucrose in TNE buffer was followed by 2 mL of 35% sucrose in TNE buffer and then by 1 mL of 5% sucrose in TNE buffer. Samples were centrifuged at 190,000g at 4 °C for 19 h in a Beckman SW60 Ti rotor, and 12 fractions of 0.33 mL were collected. Chol levels in each fraction were analyzed by TLC (Merck) using 100% chloroform as the mobile phase. A standard of Chol (Sigma, 57-88-5) was run in parallel. Chol was detected by the method of charring.48
2.3.2.3. Membrane Chol
SH-SY5Y cells were seeded in P100 Petri dishes and grown to semiconfluency. After treatment with or without 200 μM of CuSO4 for 24 h, cells were scraped and homogenized. Membranes were obtained by centrifugation (245,000g in a Beckman SW60 Ti rotor at 4 °C for 16 h) in a continuous Ficoll gradient (1 and 20% Ficoll), adding at the end of the tube a solution of 45% Nycodenz dissolved in 0.25 M sucrose containing 10 mM HEPES and 1 mM EDTA. Lipids were extracted by the method of Folch.47 Finally, an aliquot of the nonsaponifiable fractions was separated by TLC. In parallel, the standards of Chol and phospholipid (PL) were run and bands were visualized by the method of charring.48
2.3.3. Western Blot Analyses
SH-SY5Y cells were seeded in P100 Petri dishes and grown to semiconfluency. Then, cells were treated with a culture medium with or without 200 μM of CuSO4 for 24 h. Next, cells were washed with PBS and harvested by scraping them in a lysis buffer, containing proteases and phosphatases inhibitor cocktail, and homogenized using a bath sonicator (NUMAK, LUZ-30A). An aliquot of cell homogenates was used to analyze the levels of APP, doublecortin (DCX), and neuronal nuclein (NeuN). Aliquots of brains homogenates of adult Wistar rats were used as the positive control of NeuN presence. In brief, brains were taken out, washed, weighed, and homogenized in HEPES 50 mM pH 7.4 containing CHAPS 5 mM, dithiothreitol 5 mM, and aprotinin 10 mg/mL in a proportion of 6 mL buffer to each 100 mg tissue. Also, an aliquot of each sucrose gradient fraction was used to analyze APP levels and distribution in membranes. Finally, the culture medium was concentrated (Millipore EMD centrifugal concentrators Amicon Ultra-15) and an aliquot containing 100 μg of protein was used to detect the secreted Aβ. In brief, the samples were electrophoretically separated through 15% Laemmli polyacrylamide gels at 120 V for 2 h and then transferred to a polyvinylidene difluoride membrane (Immobilon Transfer membranes, IPVH00010, Millipore Corporation) at 100 V for 1 h. Nonspecific protein-binding sites were blocked by incubation in PBS (pH 7.4) containing 0.05% (v/v) Tween 20 and 5% (v/v) skimmed milk and then were incubated overnight at 4 °C with anti-APP (1:200, 6D150, Santa Cruz Biotechnology, Santa Cruz, CA), anti-DCX (1:200, sc-271390, Abcam), and anti-NeuN (1:200, MAB377, Chemicon Millipore). The epitope targeted by the anti-APP recognizes APP and Aβ. APP was normalized using monoclonal antimouse anti-β-actin as a loading control (1:2000, clone AC-74; Sigma-Aldrich) in homogenates and using antimouse antiflotillin (1:2000 sc-133153 Santa Cruz) in lipid rafts. Because no housekeeping protein was present in the culture medium, Aβ analysis was done by seeding the same amounts of protein for each sample. The immunoreactive bands were visualized using an ECL chemiluminescence kit (Immobilon Western, Merck Millipore). Densitometry analyses were performed with the ImageJ software.
2.3.4. ROS and Cell Death Determinations
SH-SY5Y cells were grown to semiconfluency and treated with a culture medium with or without 200 μM CuSO4, 200 μM FeSO4, or 200 μM ZnSO4 for 24 h. After treatment, cells were washed with PBS, harvested with a 0.05% trypsin–EDTA solution, resuspended in a FCS-free culture medium, and centrifuged at 4000g for 5 min. Finally, cells were incubated with 10 mM 2′-7′-dichlorodihydrofluorescein diacetate (Invitrogen)/90 min (37 °C) in darkness. tert-Butyl-hydroperoxide (TBH) (Sigma-Aldrich) (500 μM/90 min) was used as the positive control of ROS generation and propidium iodide (PI) (Invitrogen) (5 μM/15 min in darkness) as the control of cell death. Fluorescence was measured by flow cytometry (Accuri C6 Plus, BD).
2.3.5. Lipid Oxidation (TBARS)
Lipid peroxidation products were measured as thiobarbituric acid (TBA) reactive substances (TBARS) by the method of Yagi.49 In brief, an aliquot of homogenates reacted with TBA to yield TBA–malondialdehyde adducts which were quantified at 532 nm in the microplate reader. A calibration curve with fresh TMP solution was generated to calculate the concentration of the chromophore.
2.3.6. RNA Isolation and Real-Time qPCR Analysis
SH-SY5Y cells were seeded in P100 Petri dishes and grown to semiconfluency. After 24 h of treatment with or without 200 μM CuSO4, cells were scraped using Tripure isolation reagent (11667165001 Roche Diagnostic, USA) according to the manufacturer’s instructions for RNA isolation. RNA was transcribed into cDNA according to the manufacturer’s protocol using a commercial kit (1708891, Bio-Rad iScriptTM). cDNA was then amplified using Bio-Rad iQ SYBR Green Supermix (1708880, Bio-Rad), and the qPCR program used was 95 °C, 3 min, 40 cycles of (95 °C, 15 s; 60 °C, 60 s), and 95 °C for 1 min. Data were analyzed by the ΔΔCT method.50 Primer sequences used are in Table 1.
Table 1. Primer Sequence for qPCR.
| forward | reverse | |
|---|---|---|
| HMGCR | 5′-GGACTTCGAGCAAGAGATGG-3′ | 5′-AGCACTGTGTTGGCGTACAG-3′ |
| β-actin | 5′-TCTTATTGGTCGAAGGCTCGT-3′ | 5′-ATCTCACTAGAGGCCACCGA-3′ |
2.3.7. Protein Measurements
The method of Lowry or Bradford was used to determine the protein content in the samples.46,51
2.3.8. Statistical Analysis
All the values represent the mean ± SD (standard deviation) of independent determinations. Data were analyzed first by the Shapiro–Wilk normality test and then by the Mann–Whitney test, ANOVA, or two-way ANOVA followed by the corresponding multiple-comparison test using GraphPad Prism 6 software. Significance of statistical differences was *p < 0.05, **p < 0.01, and ***p < 0.001.
3. Results and Discussion
The hippocampus is one of the main susceptible brain areas in the early stages of AD.26,29 It is widely known that immature neurons present in the hippocampus are one of the neurogenic niches in the adult brain playing a critical role in brain plasticity, learning, and memory.28,52 Also, several works associated Cu overload with AD onset and progression.14 However, the biochemical mechanisms are still unknown. Since it is known that immature neurons synthesize their own Chol,41 we aim to elucidate the effect of Cu on Chol de novo synthesis and the possible association with the amyloidogenic processing of APP in these cells. Thus, we used undifferentiated SH-SY5Y cells (immature catecholaminergic neurons)53 which express the immature neuron marker DCX54 and do not express the mature neuronal marker NeuN54,55 (Figure 1).
Figure 1.
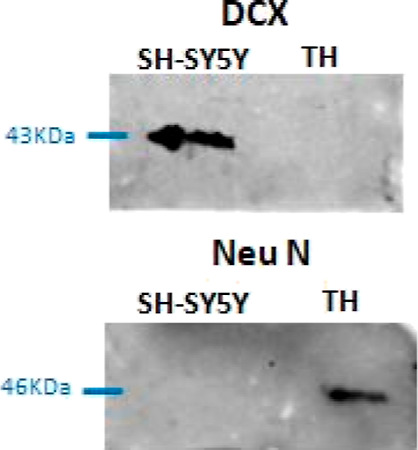
DCX and NeuN expression in SH-SY5Y cells and the brain homogenate (TH) obtained from Wistar rats. TH containing mature neurons among other cells was used as the positive control for NeuN expression.
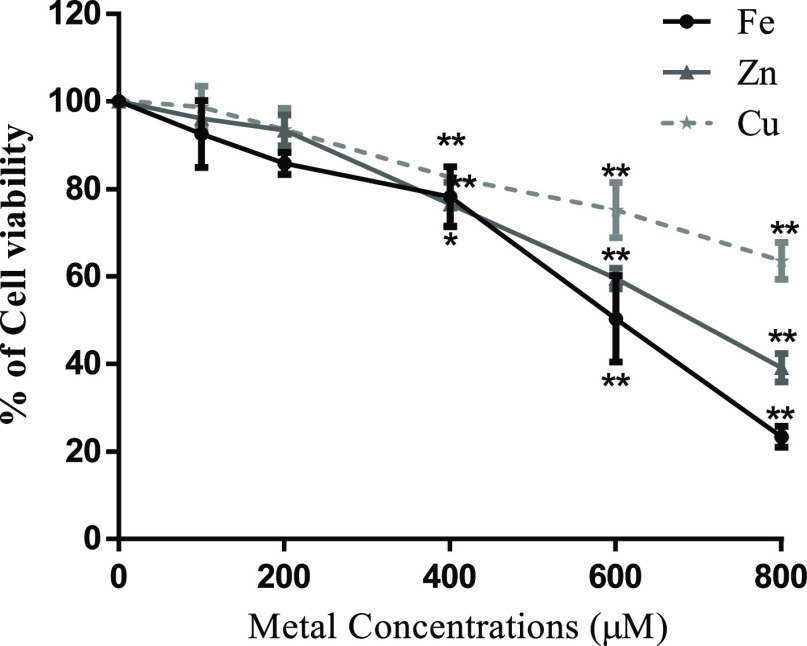
Cell viability analysis was carried out after exposure of SH-SY5Y to different CuSO4 concentrations for 24 h (Figure 2), and the highest concentration of this metal with no significant difference in cell viability was considered sublethal (200 μM) and was used in further experiments. To dissect whether the Cu-induced effects were dependent or independent of ROS generation, we tested FeSO4 (redox metal) and ZnSO4 in addition (nonredox metal). As Figure 2 shows, a similar behavior was observed for the concentration-dependent cell viability test. Thus, 200 μM was also appropriate to be used as sublethal concentrations for Fe and Zn (Figure 2).
Figure 2.
Effect of Cu, Fe, and Zn treatment on cell viability. SH-SY5Y cells were cultured and treated for 24 h with increasing concentrations of CuSO4, FeSO4, and ZnSO4. Cell viability was determined by the resazurin assay. Results were calculated using ANOVA and Dunnett’s multiple-comparison test and expressed mean ± SD percentage of control (n = 3 to 6 for each concentration used). Statistical differences are indicated as *p < 0.05 and **p < 0.01.
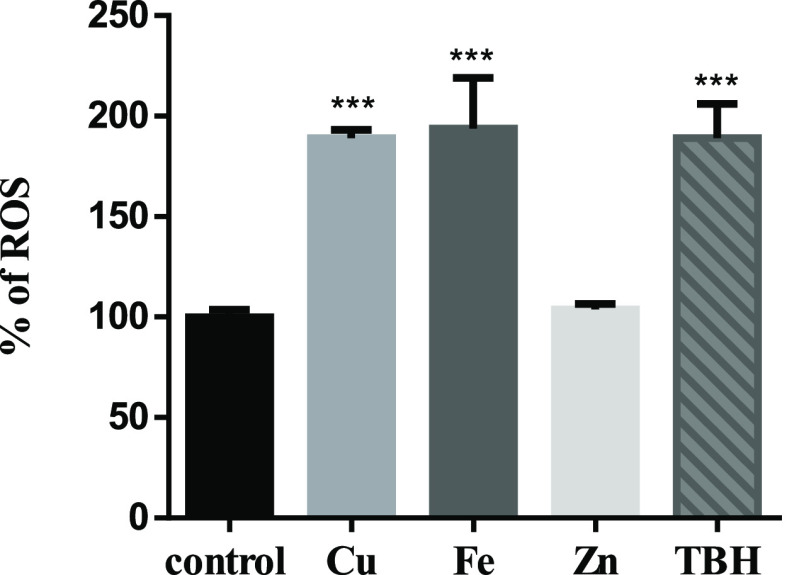
Cu, Fe, and Zn are essential metals for humans, being important in a wide variety of biological processes of cells. Since Cu and Fe are redox-active metals being able to participate in Fenton reactions,56,57 we checked whether ROS production increased with the selected concentrations. Thus, ROS levels were analyzed by flow cytometry after 24 h of treatment. We found that while Cu and Fe increased ROS significantly, Zn had no effect under these conditions (Figure 3). In addition, TBH was used as the positive control of ROS generation. High ROS levels could cause the oxidation of biomolecules such as lipids and proteins, leading finally to cell death.58−60 Therefore, we checked lipid oxidation (TBARS) (Figure 4A) and cell death (Figure 4B) in SH-SY5Y cells treated with the sublethal dose of CuSO4. Although TBARS tends to increase, this variation is not significant. We also observed no significant cell death after sublethal Cu treatment.
Figure 3.
Determination of ROS generation in SH-SY5Y cells by flow cytometry. DCF-DA was used to test ROS production. SH-SY5Y cells were treated for 24 h with 200 μM CuSO4 (light-gray bar), 200 μM FeSO4 (gray bar), or 200 μM ZnSO4 (almost white bar) for 24 h. Cells without metal addition (black bar) were used as control, and 500 μM TBH was used as the positive control of ROS generation (dark-gray bar). Data are expressed mean ± SD (n = 4) as the percentage of control. Significance of statistical difference was calculated using one-way ANOVA and Bonferroni’s multiple-comparison test and was indicated as ***p < 0.001 compared to the control and # compared to Cu treatment.
Figure 4.

Lipid peroxidation (A) and cell death (B) in SH-SY5Y cells. Lipid peroxidation was determined by the TBARS assay (A), whereas PI staining was used to test and cell death (B) after 24 h of Cu treatment (200 μM of CuSO4; gray bar). Untreated cells were used as control (black bar). Data expressed mean ± SD (n = 4) as the percentage of control.
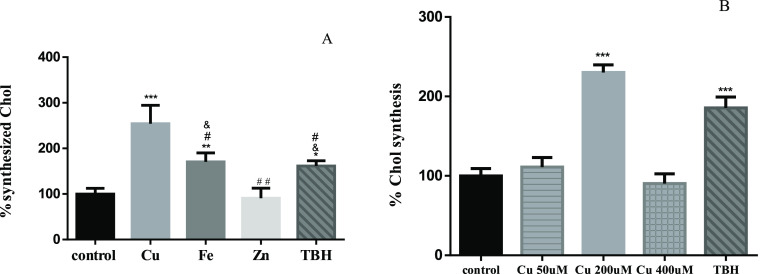
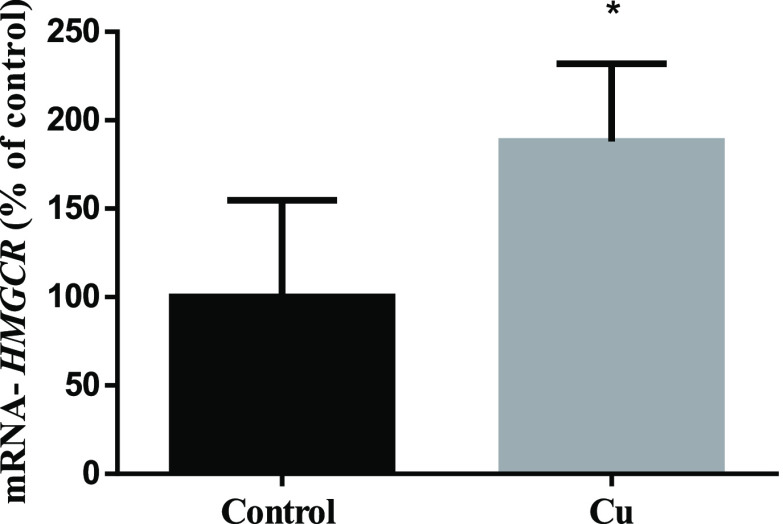
ROS not only trigger oxidative stress and apoptosis but also could act as second messengers.61 Several studies demonstrated that increasing ROS levels mediates the expression and maturation of SREBP2, a transcription factor responsible for inducing the transcription of genes involved in Chol metabolism.62−65 In line with this, we showed a significant increase of Chol synthesis after sublethal Cu treatment (Figure 5A). We did not observe changes after 50 and 400 μM Cu treatment (Figure 5B). It is known that cells exposed to low concentrations of Cu can attenuate its cytotoxic effect by binding it to different ligands.66 In addition, some pieces of evidence showed that exposing SH-SY5Y cells to 50 μM Cu does not increase ROS in a significant manner with respect to control.67 Considering this, we hypothesize that we do not observe Chol synthesis changes after 50 μM Cu exposure because it is too low, making cells able to buffer this low Cu overload. On the other hand, after 400 μM, Cu is too elevated. Cells are probably not able to buffer this high Cu level, and this is the reason why we showed significant cell death (Figure 2). Further experiments are needed to determine the reasons why there were no differences in Chol de novo synthesis with respect to control and to shed light on the dose-dependent effects of Cu on Chol synthesis and APP metabolism. TBH and Fe also showed higher de novo-synthesized Chol (Figure 5A). Interestingly, there is no increase in Chol synthesis after Zn treatment. These data suggest that ROS might contribute to the induction of Chol synthesis, likely by inducing HMGCR expression (rate-limiting enzyme of the de novo pathway) (Figure 6), as it was previously shown.39,68 ROS are also able to increase HMGCR activity by inducing protein phosphatase 2A (PP2A) dephosphorylation activity by p38.69 Surprisingly, the increased Chol synthesis after Cu treatment is even higher than after Fe and TBH treatments, although no differences in ROS generation were observed. Thus, it led us to think that Cu could also induce Chol de novo synthesis in a ROS-independent manner.
Figure 5.
Chol synthesized de novo. (A) SH-SY5Y cells were treated for 24 h with 200 μM CuSO4 (light-gray bar), 200 μM FeSO4 (gray bar), or 200 μM of ZnSO4 (almost white bar) for 24 h. (B) SH-SY5Y cells were treated with 50 (lined light-gray bar), 200 (light-gray bar), and 400 μM (squared light-gray bar) CuSO4. Cells without metal addition (black bar) were used as the control, and 500 μM TBH was used as the positive control of ROS generation (dark-gray bar). Data expressed mean ± SD (n = 4) percentage of control. Significant differences were detected using one-way ANOVA and Bonferroni’s multiple-comparison test and indicated as *** (p < 0,001), ** (p < 0.01), and * (p < 0.05) differences compared with control; # (p < 0.001) and ## (p < 0.01) differences compared with Cu; and (p < 0.01) differences compared with Zn.
Figure 6.
HMGCR expression in SH-SY5Y homogenates. Cells after 24 h of treatment with (gray bar) or without (black bar) 200 μM CuSO4 were collected, and HMGCR expression was measured by qRT-PCR. Data were calculated using the Mann–Whitney test and expressed as mean ± SD (n = 5) percentage of control. Statistical differences are indicated as *p < 0.05.
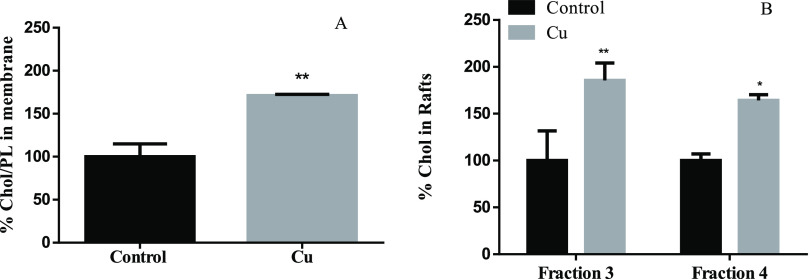
Previous in vitro studies showed that increased total intracellular Chol levels correlate with higher Chol in lipid rafts (also enriched in glycosphingolipids) but not in nonraft areas of the membrane.70,71 Also, high levels of Chol in membranes are positively correlated with β- and γ-secretase activity.31,72 The β-secretases cleaved APP outside the rafts, forming the CTFβ fragment, and then, CTFβ is cleaved by ϒ-secretases inside the rafts, producing the Aβ1-40 and Aβ 1–42 peptides in the amyloidogenic pathway.73 In order to test the possible effect of Cu in Chol accumulation in the membrane, and specifically in membrane rafts, membranes and membrane rafts were isolated by a Ficoll and sucrose gradient, respectively (Figure 7A,B). Interestingly, the increase of Chol synthesis effectively agrees with an increase in the Chol/PL ratio in the membrane (Figure 7A), which is reflected in an increase in the Chol present in membrane rafts (Figure 7B).
Figure 7.
Effect of Cu overloads on the membrane (A) and raft (B) Chol levels. (A) % of Chol/PL ratio compared with control in SH-SY5Y membranes (n = 3) and (B) % of Chol compared with control in membrane rafts (fraction 3 and 4) (n = 3) after 24 h of treatment with (gray bar) or without (black bar) 200 μM CuSO4. Results are expressed as mean ± SD and were calculated using the Mann–Whitney test (A) and two-way ANOVA and Bonferroni’s multiple-comparison test (B). Statistical differences are indicated as *p < 0.05 and **p < 0.01.
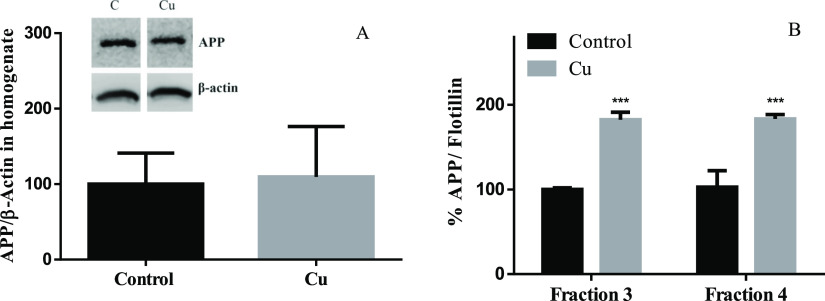
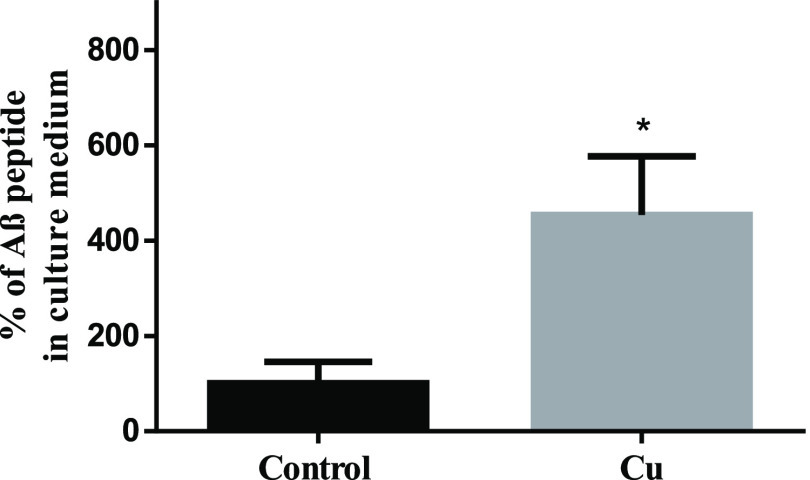
As it was previously mentioned, increasing Chol levels in membranes favors the amyloidogenic pathway of APP, increasing the Aβ levels.31,74 Also, Cu overload (150 μM CuCl2), but not Fe and Zn, promotes the traffic of APP to the cell membrane independent of transcriptional upregulation.75 However, APP in the membrane is mainly, but not exclusively, found outside rafts together with α- and β-secretases.76,77 Nevertheless, in the amyloidogenic pathway, APP should be within the membrane rafts to be cleaved by ϒ-secretases as was previously mentioned.73 To address the possibility that the increase of Chol in membranes influences APP homeostasis, APP levels were determined by western blot in cell homogenates and membrane rafts (Figure 8A,B). No significant differences in APP levels were observed between control and treated cells in homogenates (Figure 8A). However, we found higher levels of APP colocalizing with flotillin (a marker of lipid-raft-fractions 3 and 4)78,79 after Cu treatment (Figure 8B). Our results suggest that sublethal Cu overload does not affect the APP transcription rate but favors its redistribution, specifically to membrane rafts, promoting its amyloidogenic processing. Consequently, Aβ released into the culture medium was 125% higher after Cu treatment (Figure 9). The increased Aβ levels after Cu treatment agree with previous studies, showing that the endocytic pathway carried out as a necessary part of the amyloidogenic processing of APP is modulated by Chol.80
Figure 8.
Effect of Cu treatment on APP levels. SH-SY5Y cells were treated for 24 h with or without 200 μM Cu and APP in the homogenate (A) and in membrane rafts (B). APP expression was normalized to β-actin and flotillin, respectively. Results were calculated using the Mann–Whitney test and expressed as the mean ± SD percentage of control for panel A (n = 4) and two-way ANOVA plus Bonferroni’s test and expressed as the mean ± SD percentage of control fraction 3 for panel B (n = 4). Statistical difference is indicated as ***p < 0.001.
Figure 9.
Effect of Cu treatment on Aβ levels. SH-SY5Y cells were treated for 24 h with or without 200 μM Cu and Aβ in the culture medium. Results were calculated using the Mann–Whitney test and expressed as the mean ± SD percentage of control (n = 4). Statistical difference is indicated as *p < 0.05.
Since the exposure to Cu overload is more common than we think,9,10,81 and knowing that plasmatic Cu could enter the brain by crossing the BBB,11,12 we considered that our results could contribute to shed light on the biochemical mechanisms, explaining the association between Cu and AD-like neurodegeneration onset. Previous studies demonstrated that Aβ accumulation in the hippocampus of the adult brain reduced neurogenesis and neuronal function,82 which is known to be impaired before the onset of the common hallmarks of the disease.83 It was also demonstrated that the suppression of adult hippocampal neurogenesis exacerbated neuronal vulnerability in advanced stages of AD.30
4. Conclusions
Although many complex pathways may be involved in the association between the toxicity of Cu and the settlement of AD, based on our results, we propose that at least part of the pro-amyloidogenic effect of Cu that might favor AD development could be mediated by the alteration of Chol homeostasis (as it is represented in the scheme in Figure 10). We conclude that Cu overload favors Chol de novo synthesis in two ways: 1—in a ROS-dependent manner like other active metals, namely, Fe, and 2—in a direct manner that should be further investigated. The high Chol levels found in the cell membrane, and specifically in membrane rafts, may promote the redistribution of APP into the rafts, favoring the amyloidogenic processing of this protein and finally increasing the levels of Aβ.
Figure 10.
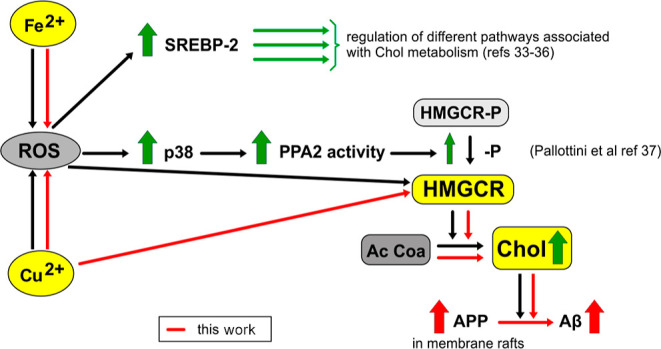
Proposed mechanism of toxicity of Cu eliciting Aβ release following ROS production. ROS are already shown to affect different pathways involved in Chol metabolism. Dark arrows show cellular signals described by other authors (referenced). The increased expression or concentrations of key components of these pathways are indicated by thick vertical arrows. Mechanisms involved in this article are represented as continuous red arrows.
Acknowledgments
This study was supported by a Grant from Agencia Nacional de Promoción Científica y Tecnológica (ANPCyT) (2016-0447 to N.A. and 2016-0949 to M.A.T.), CONICET (11220200102381CO to M.A.T.), and Universidad Nacional de La Plata (M-175 to N.A. and M-234 to M.A.T.) and German Research Foundation DFG AS547/1:1 to M.A. We would like to thank to Julia Tau, Mario Ramos, and Erica Pereyra for their excellent technical assistance.
The authors declare no competing financial interest.
References
- Tapiero H.; Townsend D. M.; Tew K. D. Trace Elements in Human Physiology and Pathology. Copper. Biomed. Pharmacother. 2003, 57, 386. 10.1016/s0753-3322(03)00012-x. [DOI] [PMC free article] [PubMed] [Google Scholar]
- Fraga C. G. Relevance, Essentiality and Toxicity of Trace Elements in Human Health. Mol. Aspect. Med. 2005, 26, 235. 10.1016/j.mam.2005.07.013. [DOI] [PubMed] [Google Scholar]
- Halliwell B.; Gutteridge J. M. C.. Free Radicals in Biology and Medicine; Oxford University Press, 2015. [Google Scholar]
- Uriu-Adams J. Y.; Keen C. L. Copper , Oxidative Stress , and Human Health. Mol. Aspects Med. 2005, 26, 268–298. 10.1016/j.mam.2005.07.015. [DOI] [PubMed] [Google Scholar]
- Arnal N.; Cristalli D. O.; de Alaniz M. J.; Marra C. A. Clinical Utility of Copper , Ceruloplasmin , and Metallothionein Plasma Determinations in Human Neurodegenerative Patients and Their First-Degree Relatives. Brain Res. 2010, 1319, 118–130. 10.1016/j.brainres.2009.11.085. [DOI] [PubMed] [Google Scholar]
- Sensi S. L.; Granzotto A.; Siotto M.; Squitti R. Copper and Zinc Dysregulation in Alzheimer’s Disease. Trends Pharmacol. Sci. 2018, 39, 1049–1063. 10.1016/j.tips.2018.10.001. [DOI] [PubMed] [Google Scholar]
- Bush A. I.; Tanzi R. E. Therapeutics for Alzheimer’s Disease Based on the Metal Hypothesis. Neurotherapeutics 2008, 5, 421. 10.1016/j.nurt.2008.05.001. [DOI] [PMC free article] [PubMed] [Google Scholar]
- Brewer G. J. Avoiding Alzheimer’s Disease: The Important Causative Role of Divalent Copper Ingestion. Exp. Biol. Med. 2019, 244, 114. 10.1177/1535370219827907. [DOI] [PMC free article] [PubMed] [Google Scholar]
- Arnal N.; de Alaniz M. J.; Marra C. A. Alterations in Copper Homeostasis and Oxidative Stress Biomarkers in Women Using the Intrauterine Device TCu380A. Toxicol. Lett. 2010, 192, 373. 10.1016/j.toxlet.2009.11.012. [DOI] [PubMed] [Google Scholar]
- Arnal N.; Astiz M.; de Alaniz M. J.; Marra C. A. Clinical Parameters and Biomarkers of Oxidative Stress in Agricultural Workers Who Applied Copper-Based Pesticides. Ecotoxicol. Environ. Saf. 2011, 74, 1779. 10.1016/j.ecoenv.2011.05.018. [DOI] [PubMed] [Google Scholar]
- Hsu H.-W.; Bondy S. C.; Kitazawa M. Environmental and Dietary Exposure to Copper and Its Cellular Mechanisms Linking to Alzheimer ’ s Disease. Toxicol. Sci. 2018, 163, 338.No. March, 1–8 10.1093/toxsci/kfy025. [DOI] [PMC free article] [PubMed] [Google Scholar]
- Choi B.-S.; Zheng W. Copper Transport to the Brain by the Blood-Brain Barrier and Blood-CSF Barrier. Brain Res. 2009, 1248, 14. 10.1016/j.brainres.2008.10.056. [DOI] [PMC free article] [PubMed] [Google Scholar]
- James S. A.; Volitakis I.; Adlard P. A.; Duce J. A.; Masters C. L.; Cherny R. A.; Bush A. I. Elevated Labile Cu Is Associated with Oxidative Pathology in Alzheimer Disease. Free Radic. Biol. Med. 2012, 52, 298–302. 10.1016/j.freeradbiomed.2011.10.446. [DOI] [PubMed] [Google Scholar]
- Arnal N.; Cristalli D. O.; de Alaniz M. J.; Marra C. A. Clinical Utility of Copper, Ceruloplasmin, and Metallothionein Plasma Determinations in Human Neurodegenerative Patients and Their First-Degree Relatives. Brain Res. 2010, 1319, 118. 10.1016/j.brainres.2009.11.085. [DOI] [PubMed] [Google Scholar]
- Sparks D. L.; Schreurs B. G. Trace amounts of copper in water induce β-amyloid plaques and learning deficits in a rabbit model of Alzheimer’s disease. Proc. Natl. Acad. Sci. U.S.A. 2003, 100, 11065–11069. 10.1073/pnas.1832769100. [DOI] [PMC free article] [PubMed] [Google Scholar]
- Squitti R.; Pasqualetti P.; Dal Forno G.; Moffa F.; Cassetta E.; Lupoi D.; Vernieri F.; Rossi L.; Baldassini M.; Rossini P. M. Excess of Serum Copper Not Related to Ceruloplasmin in Alzheimer Disease. Neurology 2005, 64, 1040–1046. 10.1212/01.wnl.0000154531.79362.23. [DOI] [PubMed] [Google Scholar]
- Drolle E.; Negoda A.; Hammond K.; Pavlov E.; Leonenko Z.. Changes in lipid membranes may trigger amyloid toxicity in Alzheimer’s disease. PLoS One 2017, 12(). https://doi.org/10.1371/journal.pone.0182194. 10.1371/journal.pone.0182194 [DOI] [PMC free article] [PubMed] [Google Scholar]
- Bane T. J.; Cole C. Prevention of Alzheimer disease. Nurse Pract. 2015, 40, 30–35. 10.1097/01.npr.0000463782.57968.c2. [DOI] [PubMed] [Google Scholar]
- Pignitter M.; Stolze K.; Jirsa F.; Gille L.; Goodman B. A.; Somoza V. Effect of Copper on Fatty Acid Profiles in Non- and Semifermented Teas Analyzed by LC-MS-Based Nontargeted Screening. J. Agric. Food Chem. 2015, 63, 8519. 10.1021/acs.jafc.5b02792. [DOI] [PubMed] [Google Scholar]
- Ricciarelli R.; Canepa E.; Marengo B.; Marinari U. M.; Poli G.; Pronzato M. A.; Domenicotti C. Critical Review Cholesterol and Alzheimer ’ s Disease. A Still Poorly Understood Correlation 2012, 64, 931–935. 10.1002/iub.1091. [DOI] [PubMed] [Google Scholar]
- Paolo G. Di; Kim T. Linking Lipids to Alzheimer ’ s Disease : Cholesterol and Beyond. Nat. Rev. Neurosci. 2012, 12, 284–296. 10.1038/nrn3012. [DOI] [PMC free article] [PubMed] [Google Scholar]
- Phan H. T. T.; Hata T.; Morita M.; Yoda T.; Hamada T.; Vestergaard M. d. C.; Takagi M. The effect of oxysterols on the interaction of Alzheimer’s amyloid beta with model membranes. Biochim. Biophys. Acta, Biomembr. 2013, 1828, 2487–2495. 10.1016/j.bbamem.2013.06.021. [DOI] [PubMed] [Google Scholar]
- Gamba P.; Leonarduzzi G.; Tamagno E.; Guglielmotto M.; Testa G.; Sottero B.; Gargiulo S.; Biasi F.; Mauro A.; Viña J.; Poli G. Interaction between 24-hydroxycholesterol, oxidative stress, and amyloid-β in amplifying neuronal damage in Alzheimer’s disease: three partners in crime. Aging Cell 2011, 10, 403–417. 10.1111/j.1474-9726.2011.00681.x. [DOI] [PubMed] [Google Scholar]
- Youdim K. A.; Martin A.; Joseph J. A. Essential Fatty Acids and the Brain: Possible Health Implications. Int. J. Dev. Neurosci. 2000, 18, 383. 10.1016/s0736-5748(00)00013-7. [DOI] [PubMed] [Google Scholar]
- González-Domínguez R.; García-Barrera T.; Gómez-Ariza J. L. Combination of Metabolomic and Phospholipid-Profiling Approaches for the Study of Alzheimer’s Disease. J. Proteonomics 2014, 104, 37–47. 10.1016/J.JPROT.2014.01.014. [DOI] [PubMed] [Google Scholar]
- Fjell A. M.; McEvoy L.; Holland D.; Dale A. M.; Walhovd K. B. What is normal in normal aging? Effects of aging, amyloid and Alzheimer’s disease on the cerebral cortex and the hippocampus. Prog. Neurobiol. 2014, 117, 20–40. 10.1016/j.pneurobio.2014.02.004. [DOI] [PMC free article] [PubMed] [Google Scholar]
- Kempermann G.; Gage F. H.; Aigner L.; Song H.; Curtis M. A.; Thuret S.; Kuhn H. G.; Jessberger S.; Frankland P. W.; Cameron H. A.; Gould E.; Hen R.; Abrous D. N.; Toni N.; Schinder A. F.; Zhao X.; Lucassen P. J.; Frisén J. Human Adult Neurogenesis: Evidence and Remaining Questions. Cell Stem Cell 2018, 23, 25–30. 10.1016/j.stem.2018.04.004. [DOI] [PMC free article] [PubMed] [Google Scholar]
- Georg Kuhn H.; Toda T.; Gage F. H. Adult Hippocampal Neurogenesis: A Coming-of-Age Story. J. Neurosci. 2018, 38, 10401. 10.1523/jneurosci.2144-18.2018. [DOI] [PMC free article] [PubMed] [Google Scholar]
- Mu Y.; Gage F. H. Adult Hippocampal Neurogenesis and Its Role in Alzheimer’s Disease. Mol. Neurodegener. 2011, 6, 85. 10.1186/1750-1326-6-85. [DOI] [PMC free article] [PubMed] [Google Scholar]
- Choi S. H.; Bylykbashi E.; Chatila Z. K.; Lee S. W.; Pulli B.; Clemenson G. D.; Kim E.; Rompala A.; Oram M. K.; Asselin C.; Aronson J.; Zhang C.; Miller S. J.; Lesinski A.; Chen J. W.; Kim D. Y.; Van Praag H.; Spiegelman B. M.; Gage F. H.; Tanzi R. E. Combined adult neurogenesis and BDNF mimic exercise effects on cognition in an Alzheimer’s mouse model. Science 2018, 361, eaan8821 10.1126/science.aan8821. [DOI] [PMC free article] [PubMed] [Google Scholar]
- Xiong H.; Callaghan D.; Jones A.; Walker D. G.; Lue L.-F.; Beach T. G.; Sue L. I.; Woulfe J.; Xu H.; Stanimirovic D. B.; Zhang W. Cholesterol retention in Alzheimer’s brain is responsible for high β- and γ-secretase activities and Aβ production. Neurobiol. Dis. 2008, 29, 422–437. 10.1016/j.nbd.2007.10.005. [DOI] [PMC free article] [PubMed] [Google Scholar]
- Díaz M.; Fabelo N.; Ferrer I.; Marín R. Lipid Raft Aging” in the Human Frontal Cortex during Nonpathological Aging: Gender Influences and Potential Implications in Alzheimer’s Disease. Neurobiol. Aging 2018, 67, 42–52. 10.1016/j.neurobiolaging.2018.02.022. [DOI] [PubMed] [Google Scholar]
- Canerina-Amaro A.; Hernandez-Abad L. G.; Ferrer I.; Quinto-Alemany D.; Mesa-Herrera F.; Ferri C.; Puertas-Avendaño R. A.; Diaz M.; Marin R. Lipid Raft ER Signalosome Malfunctions in Menopause and Alzheimer’s Disease. Front. Biosci., Scholar Ed. 2017, 9, 111. 10.2741/S476. [DOI] [PubMed] [Google Scholar]
- Fabelo N.; Martín V.; Marín R.; Moreno D.; Ferrer I.; Díaz M. Altered lipid composition in cortical lipid rafts occurs at early stages of sporadic Alzheimer’s disease and facilitates APP/BACE1 interactions. Neurobiol. Aging 2014, 35, 1801–1812. 10.1016/j.neurobiolaging.2014.02.005. [DOI] [PubMed] [Google Scholar]
- Gellermann G. P.; Appel T. R.; Tannert A.; Radestock A.; Hortschansky P.; Schroeckh V.; Leisner C.; Lütkepohl T.; Shtrasburg S.; Röcken C.; Pras M.; Linke R. P.; Diekmann S.; Fändrich M. Raft Lipids as Common Components of Human Extracellular Amyloid Fibrils. Proc. Natl. Acad. Sci. U.S.A. 2005, 102, 6297–6302. 10.1073/pnas.0407035102. [DOI] [PMC free article] [PubMed] [Google Scholar]
- Kubo S.-i.; Nemani V. M.; Chalkley R. J.; Anthony M. D.; Hattori N.; Mizuno Y.; Edwards R. H.; Fortin D. L. A Combinatorial Code for the Interaction of α-Synuclein with Membranes. J. Biol. Chem. 2005, 280, 31664–31672. 10.1074/jbc.m504894200. [DOI] [PubMed] [Google Scholar]
- Chadwick W.; Maudsley S.; Brenneman R.; Martin B. Complex and Multidimensional Lipid Raft Alterations in a Murine Model of Alzheimer’s Disease. Int. J. Alzheimer’s Dis. 2010, 604792. 10.4061/2010/604792. [DOI] [PMC free article] [PubMed] [Google Scholar]
- Arnal N.; Dominici L.; Tacconi M. J. T. d.; Marra C. A. Copper-Induced Alterations in Rat Brain Depends on Route of Overload and Basal Copper Levels. Nutrition 2014, 30, 96–106. 10.1016/j.nut.2013.06.009. [DOI] [PubMed] [Google Scholar]
- Gutiérrez-García R.; Del Pozo T.; Suazo M.; Cambiazo V.; González M. Physiological Copper Exposure in Jurkat Cells Induces Changes in the Expression of Genes Encoding Cholesterol Biosynthesis Proteins. BioMetals 2013, 26, 1033–1040. 10.1007/s10534-013-9680-9. [DOI] [PubMed] [Google Scholar]
- Svensson P.-A.; Englund M. C. O.; Markström E.; Ohlsson B. G.; Jernås M.; Billig H.; Torgerson J. S.; Wiklund O.; Carlsson L. M. S.; Carlsson B. Copper Induces the Expression of Cholesterogenic Genes in Human Macrophages. Atherosclerosis 2003, 169, 71–76. 10.1016/s0021-9150(03)00145-x. [DOI] [PubMed] [Google Scholar]
- Fünfschilling U.; Jockusch W. J.; Sivakumar N.; Möbius W.; Corthals K.; Li S.; Quintes S.; Kim Y.; Schaap I. A.; Rhee J. S.; Nave K. A.; Saher G. Critical Time Window of Neuronal Cholesterol Synthesis during Neurite Outgrowth. J. Neurosci. 2012, 32, 7632–7645. 10.1523/JNEUROSCI.1352-11.2012. [DOI] [PMC free article] [PubMed] [Google Scholar]
- Moutinho M.; Nunes M. J.; Rodrigues E. The Mevalonate Pathway in Neurons: It’s Not Just about Cholesterol. Exp. Cell Res. 2017, 360, 55. 10.1016/j.yexcr.2017.02.034. [DOI] [PubMed] [Google Scholar]
- Nieweg K.; Schaller H.; Pfrieger F. W. Marked Differences in Cholesterol Synthesis between Neurons and Glial Cells from Postnatal Rats. J. Neurochem. 2009, 109, 125–134. 10.1111/j.1471-4159.2009.05917.x. [DOI] [PubMed] [Google Scholar]
- Ricciarelli R.; Canepa E.; Marengo B.; Marinari U. M.; Poli G.; Pronzato M. A.; Domenicotti C. Cholesterol and Alzheimer’s Disease: A Still Poorly Understood Correlation. IUBMB Life 2012, 64, 931–935. 10.1002/iub.1091. [DOI] [PubMed] [Google Scholar]
- Rodríguez-Corrales J.; Josan J. S. Resazurin Live Cell Assay: Setup and Fine-Tuning for Reliable Cytotoxicity Results. Methods Mol. Biol. 2017, 1647, 207. 10.1007/978-1-4939-7201-2_14. [DOI] [PubMed] [Google Scholar]
- Lowry O.; Rosebrough N.; Farr A. L.; Randall R. Protein Measurement with the Folin Phenol Reagent. J. Biol. Chem. 1951, 193, 265–275. 10.1016/s0021-9258(19)52451-6. [DOI] [PubMed] [Google Scholar]
- Folch J.; Lees M.; Stanley G. H. S. A Simple Method for the Isolation and Purification of Total Lipides from Animal Tissues. J. Biol. Chem. 1957, 226, 497–509. 10.1016/s0021-9258(18)64849-5. [DOI] [PubMed] [Google Scholar]
- Kritchevsky D.; Davidson L.; Kim H.; Malhotra S. Quantitation of Serum Lipids by a Simple Tlc-Charring Method. Clin. Chim. Acta 1973, 46, 63–68. 10.1016/0009-8981(73)90103-4. [DOI] [PubMed] [Google Scholar]
- Yagi K. A Simple Fluorometric Assay for Lipoperoxide in Blood Plasma. Biochem. Med. 1976, 15, 212. 10.1016/0006-2944(76)90049-1. [DOI] [PubMed] [Google Scholar]
- Koukourakis M. I.; Kalamida D.; Mitrakas A. G.; Liousia M.; Pouliliou S.; Sivridis E.; Giatromanolaki A. Metabolic Cooperation between Co-Cultured Lung Cancer Cells and Lung Fibroblasts. Lab. Invest. 2017, 97, 1321. 10.1038/labinvest.2017.79. [DOI] [PubMed] [Google Scholar]
- Bradford M. M. A rapid and sensitive method for the quantitation of microgram quantities of protein utilizing the principle of protein-dye binding. Anal. Biochem. 1976, 72, 248–254. 10.1016/0003-2697(76)90527-3. [DOI] [PubMed] [Google Scholar]
- Kempermann G.; Gage F. H.; Aigner L.; Song H.; Curtis M. A.; Thuret S.; Kuhn H. G.; Jessberger S.; Frankland P. W.; Cameron H. A.; Gould E.; Hen R.; Abrous D. N.; Toni N.; Schinder A. F.; Zhao X.; Lucassen P. J.; Frisén J. Human Adult Neurogenesis: Evidence and Remaining Questions. Cell Stem Cell 2018, 23, 25. 10.1016/j.stem.2018.04.004. [DOI] [PMC free article] [PubMed] [Google Scholar]
- Lopes F. M.; Schröder R.; Júnior M. L. C. d. F.; Zanotto-Filho A.; Müller C. B.; Pires A. S.; Meurer R. T.; Colpo G. D.; Gelain D. P.; Kapczinski F.; Moreira J. C. F.; Fernandes M. d. C.; Klamt F. Comparison between Proliferative and Neuron-like SH-SY5Y Cells as an in Vitro Model for Parkinson Disease Studies. Brain Res. 2010, 1337, 85–94. 10.1016/j.brainres.2010.03.102. [DOI] [PubMed] [Google Scholar]
- Kovalevich J.; Langford D. Considerations for the Use of SH-SY5Y Neuroblastoma Cells in Neurobiology. Methods Mol. Biol. 2013, 1078, 9. 10.1007/978-1-62703-640-5_2. [DOI] [PMC free article] [PubMed] [Google Scholar]
- Ma Z. X.; Zhang R. Y.; Rui W. J.; Wang Z. Q.; Feng X. Quercetin Alleviates Chronic Unpredictable Mild Stress-Induced Depressive-like Behaviors by Promoting Adult Hippocampal Neurogenesis via FoxG1/CREB/ BDNF Signaling Pathway. Behav. Brain Res. 2021, 406, 113245. 10.1016/j.bbr.2021.113245. [DOI] [PubMed] [Google Scholar]
- Jomova K.; Valko M. Advances in Metal-Induced Oxidative Stress and Human Disease. Toxicology 2011, 283, 65. 10.1016/j.tox.2011.03.001. [DOI] [PubMed] [Google Scholar]
- Farina M.; Silva D.; Batista J.; Aschner M. Neurochemistry International Metals , Oxidative Stress and Neurodegeneration : A Focus on Iron , Manganese and Mercury. Neurochem. Int. 2013, 62, 575. 10.1016/j.neuint.2012.12.006. [DOI] [PMC free article] [PubMed] [Google Scholar]
- Martínez M.-A.; Rodríguez J. L.; Lopez-Torres B.; Martínez M.; Martínez-Larrañaga M. R.; Maximiliano J. E.; Anadón A.; Ares I. Use of Human Neuroblastoma SH-SY5Y Cells to Evaluate Glyphosate-Induced Effects on Oxidative Stress, Neuronal Development and Cell Death Signaling Pathways. Environ. Int. 2020, 135, 105414. 10.1016/J.ENVINT.2019.105414. [DOI] [PubMed] [Google Scholar]
- Arnal N.; De Alaniz M. J. T.; Marra C. A. Cytotoxic Effects of Copper Overload on Human-Derived Lung and Liver Cells in Culture. Biochim. Biophys. Acta, Gen. Subj. 2012, 1820, 931. 10.1016/j.bbagen.2012.03.007. [DOI] [PubMed] [Google Scholar]
- Rakshit J.; Mallick A.; Roy S.; Sarbajna A.; Dutta M.; Bandyopadhyay J. Iron-Induced Apoptotic Cell Death and Autophagy Dysfunction in Human Neuroblastoma Cell Line SH-SY5Y. Biol. Trace Elem. Res. 2020, 193, 138–151. 10.1007/s12011-019-01679-6. [DOI] [PubMed] [Google Scholar]
- Forman H. J.; Maiorino M.; Ursini F. Signaling Functions of Reactive Oxygen Species. Biochemistry 2010, 49, 835. 10.1021/bi9020378. [DOI] [PMC free article] [PubMed] [Google Scholar]
- Fuhrman B.; Gantman A.; Khateeb J.; Volkova N.; Horke S.; Kiyan J.; Dumler I.; Aviram M. Urokinase Activates Macrophage PON2 Gene Transcription via the PI3K/ROS/MEK/SREBP-2 Signalling Cascade Mediated by the PDGFR-β. Cardiovasc. Res. 2009, 84, 145. 10.1093/cvr/cvp184. [DOI] [PubMed] [Google Scholar]
- Seo E.; Kang H.; Choi H.; Choi W.; Jun H. S. Reactive Oxygen Species-Induced Changes in Glucose and Lipid Metabolism Contribute to the Accumulation of Cholesterol in the Liver during Aging. Aging Cell 2019, 18, e12895 10.1111/acel.12895. [DOI] [PMC free article] [PubMed] [Google Scholar]
- Seo K.; Shin S. M. Induction of Lipin1 by ROS-Dependent SREBP-2 Activation. Toxicol. Res. 2017, 33, 219. 10.5487/tr.2017.33.3.219. [DOI] [PMC free article] [PubMed] [Google Scholar]
- Ferris H. A.; Perry R. J.; Moreira G. V.; Shulman G. I.; Horton J. D.; Kahn C. R. Loss of Astrocyte Cholesterol Synthesis Disrupts Neuronal Function and Alters Whole-Body Metabolism. Proc. Natl. Acad. Sci. U.S.A. 2017, 114, 1189. 10.1073/pnas.1620506114. [DOI] [PMC free article] [PubMed] [Google Scholar]
- Scheiber I.; Dringen R.; Mercer J. F. B. Copper: Effects of Deficiency and Overload. Met. Ions Life Sci. 2013, 13, 359–387. 10.1007/978-94-007-7500-8_11. [DOI] [PubMed] [Google Scholar]
- Greco M.; Spinelli C. C.; De Riccardis L.; Buccolieri A.; Di Giulio S.; Musarò D.; Pagano C.; Manno D.; Maffia M. Copper Dependent Modulation of α-Synuclein Phosphorylation in Differentiated SHSY5Y Neuroblastoma Cells. Int. J. Mol. Sci. 2021, 22, 2038. 10.3390/ijms22042038. [DOI] [PMC free article] [PubMed] [Google Scholar]
- Fisher A. L.; Srole D. N.; Palaskas N. J.; Meriwether D.; Reddy S. T.; Ganz T.; Nemeth E. Iron Loading Induces Cholesterol Synthesis and Sensitizes Endothelial Cells to TNFα-Mediated Apoptosis. J. Biol. Chem. 2021, 297, 101156. 10.1016/j.jbc.2021.101156. [DOI] [PMC free article] [PubMed] [Google Scholar]
- Pallottini V.; Martini C.; Cavallini G.; Bergamini E.; Mustard K. J.; Hardie D. G.; Trentalance A. Age-Related HMG-CoA Reductase Deregulation Depends on ROS-Induced P38 Activation. Mech. Ageing Dev. 2007, 128, 688. 10.1016/j.mad.2007.10.001. [DOI] [PubMed] [Google Scholar]
- Cho Y. Y.; Kwon O. H.; Park M. K.; Kim T. W.; Chung S. Elevated Cellular Cholesterol in Familial Alzheimer’s Presenilin 1 Mutation Is Associated with Lipid Raft Localization of β-Amyloid Precursor Protein. PLoS One 2019, 14, e0210535 10.1371/journal.pone.0210535. [DOI] [PMC free article] [PubMed] [Google Scholar]
- Marin R.; Rojo J. A.; Fabelo N.; Fernandez C. E.; Diaz M. Lipid Raft Disarrangement as a Result of Neuropathological Progresses: A Novel Strategy for Early Diagnosis?. Neuroscience 2013, 245, 26. 10.1016/j.neuroscience.2013.04.025. [DOI] [PubMed] [Google Scholar]
- Osenkowski P.; Ye W.; Wang R.; Wolfe M. S.; Selkoe D. J. Direct and Potent Regulation of γ-Secretase by Its Lipid Microenvironment. J. Biol. Chem. 2008, 283, 22529–22540. 10.1074/jbc.m801925200. [DOI] [PMC free article] [PubMed] [Google Scholar]
- Motoki K.; Kume H.; Oda A.; Tamaoka A.; Hosaka A.; Kametani F.; Araki W. Neuronal β-Amyloid Generation Is Independent of Lipid Raft Association of β-Secretase BACE1: Analysis with a Palmitoylation-Deficient Mutant. Brain Behav. 2012, 2, 270. 10.1002/brb3.52. [DOI] [PMC free article] [PubMed] [Google Scholar]
- Huang Y.-N.; Lin C.-I.; Liao H.; Liu C.-Y.; Chen Y.-H.; Chiu W.-C.; Lin S.-H. CHOLESTEROL OVERLOAD INDUCES APOPTOSIS IN SH-SY5Y HUMAN NEUROBLASTOMA CELLS THROUGH THE UP REGULATION OF FLOTILLIN-2 IN THE LIPID RAFT AND THE ACTIVATION OF BDNF/TrkB SIGNALING. Neuroscience 2016, 328, 201–209. 10.1016/j.neuroscience.2016.04.043. [DOI] [PubMed] [Google Scholar]
- Acevedo K. M.; Hung Y. H.; Dalziel A. H.; Li Q. X.; Laughton K.; Wikhe K.; Rembach A.; Roberts B.; Masters C. L.; Bush A. I.; Camakaris J. Copper Promotes the Trafficking of the Amyloid Precursor Protein. J. Biol. Chem. 2011, 286, 8252. 10.1074/jbc.m110.128512. [DOI] [PMC free article] [PubMed] [Google Scholar]
- Araki W.; Tamaoka A. Amyloid Beta-Protein and Lipid Rafts: Focused on Biogenesis and Catabolism. Front. Biosci. 2015, 20, 314–324. 10.2741/4311. [DOI] [PubMed] [Google Scholar]
- Bhattacharyya R.; Barren C.; Kovacs D. M. Palmitoylation of Amyloid Precursor Protein Regulates Amyloidogenic Processing in Lipid Rafts. J. Neurosci. 2013, 33, 11169–11183. 10.1523/jneurosci.4704-12.2013. [DOI] [PMC free article] [PubMed] [Google Scholar]
- Bickel P. E.; Scherer P. E.; Schnitzer J. E.; Oh P.; Lisanti M. P.; Lodish H. F. Flotillin and Epidermal Surface Antigen Define a New Family of Caveolae-Associated Integral Membrane Proteins. J. Biol. Chem. 1997, 272, 13793–13802. 10.1074/jbc.272.21.13793. [DOI] [PubMed] [Google Scholar]
- Glebov O. O.; Bright N. A.; Nichols B. J. Flotillin-1 Defines a Clathrin-Independent Endocytic Pathway in Mammalian Cells. Nat. Cell Biol. 2006, 8, 46–54. 10.1038/ncb1342. [DOI] [PubMed] [Google Scholar]
- Schneider A.; Rajendran L.; Honsho M.; Gralle M.; Donnert G.; Wouters F.; Hell S. W.; Simons M. Flotillin-Dependent Clustering of the Amyloid Precursor Protein Regulates Its Endocytosis and Amyloidogenic Processing in Neurons. J. Neurosci. 2008, 28, 2874–2882. 10.1523/jneurosci.5345-07.2008. [DOI] [PMC free article] [PubMed] [Google Scholar]
- Brewer GJ Copper Toxicity in Alzheimer’s Disease: Cognitive Loss from Ingestion of Inorganic Copper. J. Trace Elem. Med. Biol. 2012, 26, 89–92. 10.1016/j.jtemb.2012.04.019. [DOI] [PubMed] [Google Scholar]
- Morrone C. D.; Bazzigaluppi P.; Beckett T. L.; Hill M. E.; Koletar M. M.; Stefanovic B.; McLaurin J. Regional Differences in Alzheimer’s Disease Pathology Confound Behavioural Rescue after Amyloid-β Attenuation. Brain 2020, 143, 359–373. 10.1093/brain/awz371. [DOI] [PMC free article] [PubMed] [Google Scholar]
- Lazarov O.; Marr R. A. Neurogenesis and Alzheimers Disease: At the Crossroads. Exp. Neurol. 2010, 223, 267–281. 10.1016/j.expneurol.2009.08.009. [DOI] [PMC free article] [PubMed] [Google Scholar]


