

Abstract
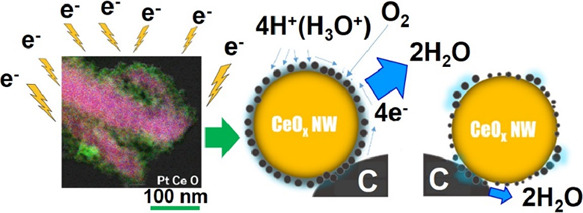
A Pt-nanocoated layer (thickness of approx. 10–20 nm) with Pt–O–Ce bonds was created through the water radiolysis reaction on a CeOx nanowire (NW), which was induced by electron beam irradiation to the mixed suspension of K2PtCl4 aqueous solution and the CeOx NW. In turn, when Pt-nanocoated CeOx NW/C (Pt/C ratio = 0.2) was used in the cathode layer of a membrane electrode assembly (MEA), both an improved fuel cell performance and stability were achieved. The fuel cell performance observed for the MEA using Pt-nanocoated CeOx NW/C with Pt–O–Ce bonds, which was prepared using the electron beam irradiation method, improved and maintained its performance (observed cell potential of approximately 0.8 V at 100 mW cm–2) from 30 to 140 h after the start of operation. In addition, the activation overpotential at 100 mA cm–2 (0.17 V) obtained for MEA using Pt-nanocoated CeOx NW/C was approximately half of the value at 100 mA cm–2 (0.35 V) of MEA using a standard Pt/C cathode. In contrast, the fuel cell performance (0.775 V at 100 mW cm–2 after 80 h of operation) of MEA using a nanosized Pt-loaded CeOx NW (Pt/C = 0.2), which was prepared using the conventional chemical reduction method, was lower than that of MEA using a Pt-nanocoated CeOx/C cathode and showed reduction after 80 h of operation. It is considered why the nanocoated layer having Pt–O–Ce bonds heterogeneously formed on the surface of the CeOx NW and the bare CeO2 surface consisting of Ce4+ cations would become unstable in an acidic atmosphere. Furthermore, when a conventional low-amount Pt/C cathode (Pt/C = 0.04) was used as the cathode layer of the MEA, its stable performance could not be measured after 80 h of operation as a result of flooding caused by a lowering of electrocatalytic activity on the Pt/C cathode in the MEA. In contrast, a low-amount Pt-nanocoated CeOx NW (Pt/C = 0.04) could maintain a low activation overpotential (0.22 V at 100 mA cm–2) of MEA at the same operation time. Our surface first-principles modeling indicates that the high quality and stable performance observed for the Pt-nanocoated CeOx NW cathode of MEA can be attributed to the formation of a homogeneous electric double layer on the sample. Since the MEA performance can be improved by examining a more effective method of electron beam irradiation to all surfaces of the sample, the present work result shows the usefulness of the electron beam irradiation method in preparing active surfaces. In addition, the quantum beam technology such as the electron beam irradiation method was shown to be useful for increasing both performance and stability of fuel cells.
1. Introduction
Fuel cells are an efficient energy conversion technology that directly converts chemical energy of fuels such as hydrogen, methanol, and natural gas to electricity with high efficiency. Among all types of fuel cells, polymer electrolyte membrane fuel cells (PEFCs) have been actively developed for use in vehicular applications and residential-scale cogeneration systems.1−3 To increase the mileage of fuel cell vehicles and to make the cogeneration system smaller for apartment buildings, the improvement of activity on Pt in the cathode layer of membrane electrode assembly (MEA) in PEFCs is a greatly important issue.
Recently, the metal platinum (Pt)–oxide support interaction has been attracting much attention for maximization of activity on Pt/C in MEA. Both of anodic4−34 and cathodic35−56 electrocatalytic reactions on Pt-loaded CeO2,4−21,35−44 TiO2,22−25,45−49 SnO2,26−30,50−53 WO3,31,32,46,54 MoO2,33,55 or NbO234,56 were examined for MEA application in previously published works.
Among the series of Pt and oxide support combinations, the defect interface of Pt-loaded cerium oxide (Pt-CeOx)/C is a unique system as compared to other interfaces on Pt–oxide support electrocatalysts. Since CeOx has a mixed valence of Ce cations (i.e., Ce3+ and Ce4+), CeOx shows electrochemical redox properties, making it unique. One of the characteristic properties of the Pt-CeOx support interaction is the CO tolerance on the Pt/C anode in direct methanol fuel cells (DMFCs). Since CO tolerance on the Pt/C anode, which is enhanced by the Pt-CeOx support interaction, is much stronger than that of other Pt–oxide support interactions, this unique function of the Pt-CeOx interface in the anode layer is briefly described in the present Introduction.
The stable anode performance of Pt-CeOx/C in an alkaline media such as a mixed solution of alcohol and KOH was first reported by Xu et al.4,5 Alternatively, Takahashi et al. reported the anode performance of Pt-CeOx nanoparticles (NP) on conductive carbon in an acidic media with the view of application in PEFCs. They observed a stable anode performance for Pt-CeOx NP/C and a high activity for methanol electro-oxidation reaction (MOR) on Pt-CeOx NP/C electrocatalysts in a mixed aqueous solution of methanol and sulfuric acid.6 They also suggested that the improved anode performance of this system, in acidic media, was a result of the electrochemical redox (Ce4+ ↔ Ce3+) reaction on CeOx at the Pt-CeOx NP interface.7,8 In addition, the effect of the electrochemical redox reaction of cerium oxide (Ce4+ ↔ Ce3+) on the CO oxidation reaction on Pt was improved on the Pt-CeOx NP/carbon nanotube (CNT) by the enhancement of charge transfer between Pt and CeOx on the CNT in the anode layer.9,10 In addition to the Pt-CeOx NP/C series, Pt-CeOx thin film/CNT supported by a carbon gas diffusion layer (GDL)11,16−18 and Pt-CeOx nanowire (NW)/C12 anodes were examined and successfully maximized by improving the interaction between Pt and the two-dimensional CeOx thin film and the one-dimensional CeOx NW at the nanoscale. These electrocatalysts11,12 showed improved anodic performance by an increase of Pt-CeOx interface regions on the electrocatalysts. In particular, the previously published work on Pt-CeOx thin films deposited on a Si(001) substrate or multiwall carbon nanotubes (CNTs) supported by a carbon gas diffusion layer (GDL) using a magnetron sputtering method mentioned that the formation of Pt–O–Ce bonds and the presence of Ptn+ species in the thin film may increase the anode performance (i.e., activity of the oxidation reaction of hydrogen).11 In addition, the close contact between Pt species and CeOx on a CeOx-ZrOx substrate improved the catalytic activity in the reaction of carbon monoxide and water vapor to produce carbon dioxide and hydrogen (i.e., water gas shift reaction (WGS))13 as well as the fuel cell anodic reaction. Those previously published works11−13 clearly indicated the importance of the formation of interfaces containing Pt–O–Ce bonds in improving the activities of the electrochemical oxidation reaction and the conventional catalytic oxidation reaction over Pt-CeOx catalysts.
However, there were no detailed characterization of the defect structure induced by the formation of Pt–O–Ce bonds in the interfacial layer on the anode half of the fuel cell and no conclusion of the effect of the Pt–O–Ce bond formation on the oxygen reduction activity on the cathode, including the overall stability.
To characterize the defect interface structure on the Pt-CeOx NP/C anode, Ou et al. characterized the Pt-CeOx interface structure on electrocatalysts by using high-resolution transmission electron microscopy (HR-TEM) and electron energy loss spectroscopy (EELS) analysis.14 This microanalysis clearly highlighted the key defect interface on Pt-CeOx NP/C electrocatalysts in the anode layer. Their high-resolution TEM observation and EELS analysis revealed the formation of a Ce1–xPtxO2–y-type solid solution at the interface region between Pt and CeO2 NP. This microanalysis work was the first good opportunity to investigate the relationship between the defective interfacial structure and the electrode function of nanosized Pt-CeO2 NP/C. However, since the region of the interface between Pt and CeO2 NP was very narrow and hard to analyze, there was still not enough information to use the microanalysis data for improving the electrode performance.
In addition, in situ IR spectroscopy analysis indicates that adsorption of CO on the Pt surface becomes weak by formation of Pt-CeOx interfaces.15,17 On the other hand, H2O molecule adsorption, not CO molecule adsorption on the defect-rich CeOx surface, must be discussed for the ORR activity and fuel cell performance on the cathode. However, it is known that the broad IR band spectrum taken from H2O molecules adsorbed on the surface cannot be analyzed using IR analysis, and a rational discussion incorporating surface first-principles calculation based on microanalysis results has potential to clarify the situation.
In the previously published work, the first-principles calculation indicated that the subnano-Pt particles, which are the key for keeping the high CO tolerance of Pt, are very stable on the Pt-CeOx thin film with a large Pt-CeOx interface area under the conditions of potential cycling in alkaline conditions.17 In contrast, it was reported that the stability of anodic performance observed for the defect interface on the Pt-CeOx NP and the Pt-CeOx thin film becomes low in acidic solutions because of the high solubility of Pt-free regions of CeO2 interfaces in acidic solution.16,17 Recently, Pt-CeOx thin films on a GDL anode were examined for PEFC application, and the low overpotential on the Pt-CeOx thin-film anode was demonstrated using MEA of PEFCs.20,21 However, the high-solubility problem of Pt-free CeOx interface regions still remains a challenge. Since the interfaces between an electrocatalyst and a Nafion membrane in both of the anode and the cathode layers of MEA are in strong acidic conditions (pH < 1), the design of a Pt-CeOx thin-film surface that fully covers the CeOx interfaces is required for MEA application.
As mentioned above, the contribution of the catalyst surface to the hydrogen production reaction associated with the oxidation reaction has been well-examined in the previously published works for Pt-CeOx samples. However, the characterization data and the fabrication method for the defect interface on the Pt-CeOx cathode, which contributes to the improvement of the fuel cell performance and its stability, were not reported yet.
In addition, it is known that the excess overpotential on Pt in the cathodic fuel cell reaction (i.e., oxygen reduction reaction (ORR)) is much larger than that in the anodic one (i.e., hydrogen oxidation reaction). To design an active Pt-CeOx interface on a Pt/C electrocatalyst in the “state-of-the-art” PEFC devices with the quality exceeding the limit of conventional PEFCs, both a low overpotential and good stability on the cathode (not the anode) in the MEA have to be well-balanced. In this challenge, preparation of the Pt-CeOx interface with Pt–O–Ce bonds that fully covers the surface of the CeOx support in the cathode layer of MEA of PEFCs is required.
In the initial stages of interface design works between Pt and the CeOx support, the Pt-CeOx/C cathode was proposed for the direct methanol fuel cell (DMFC) device. The ORR activity on Pt in Pt-CeOx NP/C was first examined for development of DMFC devices by Yu et al.35 They suggested that the functionalized CeOx surface was the oxygen supplier to the Pt surface. Their interface had a role in improving the ORR activity on Pt, which was affected by methanol crossover from the anode side in the DMFC device. Takahashi et al.36 suggested that the ORR activity on Pt could be improved by the oxygen storage property of the CeOx support, which has strong interactions with Pt under the operating conditions of MEA in PEFC devices. In their idea, the hydrogen that is dissociated on the Pt surface and the oxygen that is generated from the CeOx lattice react at the interface of Pt and CeOx. Then, the water molecules (i.e., the product of the cathodic fuel cell reaction) would be formed at the Pt-CeOx interface. Their idea suggests that the Pt-CeOx NP interface plays a key role as a three-phase boundary (TPB) on the Pt-CeOx NP/C electrocatalyst. In other pioneering works, Lim et al. suggested that the oxygen generated from CeOx contributes to the improvement of the ORR activity on Pt through Pt-CeOx NP interfaces. They also examined the stability of ORR activity on the Pt-CeOx NP/C electrocatalyst and demonstrated the performance of the PEFC with their Pt-CeOx NP/C cathode. This work presents the first report revealing the high stability of ORR activity on the Pt-CeOx NP/C electrocatalyst in acidic conditions for PEFC application.37,38
To improve the slow kinetics of Pt on the cathode side using Pt-CeOx NP/C, Masuda et al. examined the interfacial reactions on the Pt-CeOx NP/C cathode using in situ X-ray absorption fine structure (XAFS) analysis.39 Their results suggested that the surface electrochemical oxidation of Pt can be effectively suppressed by using the electrochemical redox (Ce4+ ↔ Ce3+) reaction on CeOx at the Pt-CeOx NP interface, and the ORR activity on a Pt cathode can be promoted by the electrochemical redox reaction (Ce4+ ↔ Ce3+) on CeOx even at room temperature. Also, Fugane et al. tuned the Pt-CeOx interface structure using an electrochemical conditioning process and examined both of the ORR activity of Pt-CeOx NP/C and its fuel cell device performance.40−42 They optimized the condition of the electrochemical conditioning process for improvement of ORR activity on the Pt-CeOx NP/C electrocatalyst and observed high and stable ORR activity on their electrocatalysts in acidic conditions.43 This result indicated that Pt-CeOx interface coverage on Pt-CeOx NP/C can be improved using optimum conditions of the electrochemical conditioning process. They also fabricated a Pt-CeOx thin-film electrode on a conductive Nb-doped SrTiO3 single-crystal substrate by a stepwise process involving pulse laser deposition, and their high-resolution TEM (HR-TEM) microanalysis obtained clear information about the feature of the active interface structure in the Pt-CeOx thin film on a conductive Nb-doped SrTiO3 single-crystal substrate cathode. Their work based on HR-TEM microanalysis and electrochemistry data highlighted that the Pt-CeOx interface as an active site mainly consisted of a Schottky-type Pt2+ defect cluster and a Ce3+ defect cluster.43 Also, the Pt-CeOx nanowire (NW)/C cathode showed a higher ORR activity on Pt as compared with the conventional Pt/C in acidic conditions. In the work using the Pt-CeOx NW/C cathode, the bulk atomistic simulation based on TEM microanalysis data suggested that the formation of a wide Pt-CeOx defect interface area contributes to improvement of ORR activity on the Pt electrocatalyst for fuel cell application.44 The previously published works suggested that the Pt-CeOx interface had high stability in acidic solution. However, only a small amount of the key interfaces was formed between Pt and CeOx using conventional preparation methods. To improve the fuel cell performance with high stability, the formation of much wider areas of interfaces having Pt–O–Ce bonds is required.
In the case of the conventional chemical reduction method to load Pt nanoparticles on CeOx NW, it is supposed that Pt particles were heterogeneously dispersed on the CeOx NW surface at the microscopic scale and the Pt-CeOx interface region with high ORR activity did not homogeneously form on the cathode. Consequently, it was hard to balance the high performance and good stability of the MEA using Pt-CeOx NW/C cathodes.
To overcome this problem, the authors previously prepared a Pt-nanocoated CeOx NW/C cathode with Pt–O–Ce bonds using a proton beam irradiation method.57 In that previously published work,57 it was reported that the Pt-CeOx NW/C cathode with a Pt–O–Ce bonded nanocoating layer showed high ORR activity by electrochemical measurements. However, the amount of Pt-CeOx NW/C with a nanocoating layer on its surface that can be produced by using high-energy proton beams, which can only be generated using an ion accelerator, was very little. Consequently, it was not suitable for examining fuel cell performance using MEA.
In the present work, the authors try to fabricate the Pt-CeOx NW/C cathode with a surface nanocoating layer having active Pt–O–Ce bonds using the electron beam irradiation method, which can prepare enough of the cathode sample for fuel cell performance tests. Since one of the features of the quantum beam (i.e., proton and electron beam) irradiation method is the use of the water radiolysis process, a brief summary is first given below.
In the expected water radiolysis reaction pathway,58−62 an aqueous electron (eaq–), a hydrogen radical (H·), and a hydroxyl radical (·OH) are formed by the radiolysis reaction of water as shown in eq 1.
| 1 |
H· and ·OH react with ethanol in this radiolysis reaction, and the ethanol radical is reductively formed (refer to eqs 2 and 3).
| 2 |
| 3 |
Equation 2 indicates that ethanol can be a scavenger of the strong oxidant ·OH.
Also, the most important feature of the water radiolysis reaction is that eaq– and H· create fine Pt particles through the reaction when a molecule such as platinum chloride is introduced to the reaction (refer to eqs 4 and 5).
| 4 |
| 5 |
Equations 1–5 suggest that the conventional water radiolysis reaction by electron beam or gamma-ray irradiation is helpful for the preparation of homogeneously dispersed nanosized Pt particles from platinum chloride on oxide supports. Furthermore, eq 5 shows that H· can be a strong reducing agent. In the previously published works, the gamma-ray irradiation58−60 and electron beam irradiation61−63 methods fabricated nanosized metal particles and metal clusters on oxide supports including CeO2 NP. However, it seems to be hard to increase the fuel cell performance (i.e., MEA performance) by only formation of fine Pt particles on the oxide support. To keep the good balance between high performance and good stability of MEA, the authors supposed that it can be achieved by the formation of a homogeneous and active coated layer with Pt–O–Ce bonds on the oxide support CeO2 NW surface, which is included in the cathode layer of MEA.
In order to fabricate the active surface layer with Pt–O–Ce bonds on the CeOx NW support in the cathode layer of MEA, first, we optimize the preparation conditions of the active nanocoated layer on the CeOx NW surface using the electron beam irradiation method. After that, to confirm the formation of the surface nanocoated layer on the oxide support CeOx NW as expected, the microstructures of the obtained cathode samples are observed using TEM and XPS. Then, the MEA performance and its stability, which are observed for the Pt-CeOx NW/C cathode with the surface nanocoated layer and the Pt-CeOx NW/C cathode loaded with nanosized Pt particles prepared by the conventional chemical reduction method, are compared.
In the discussion part of present work, the degree of ease in which to form the defect cluster with active Pt–O–Ce bonds on the CeO2(111) surface is estimated using the binding energy of the defect cluster. Also, the adsorption energy of water on the CeO2(111) surface is calculated to estimate the degree of ease for formation of the homogeneous electric double layer on the cathode. Both energies are calculated by first-principles calculations. Finally, based on the results of microanalysis and first-principles calculations, we discuss the usefulness of the electron beam irradiation method for the preparation of MEA with both high performance and good stability using the Pt-CeOx NW/C cathode with a nanocoated layer having Pt–O–Ce bonds.
2. Experimental Section
2.1. Preparation of CeOx NW and Pt-Nanocoated CeOx NW/C
Pt-nanocoated CeOx NW/C samples were prepared in a stepwise process. The CeOx NW was synthesized using a solvothermal synthesis method. The starting materials used were commercially available cerium chloride (CeCl3·H2O) (Nacalai Tesque Company, Japan) and superdehydrated ethanol (C2H5OH) (Fuji Wako Chemicals, Japan). To prepare the cerium cation micelle as a precursor of the CeOx NW, urea ((H2N)2CO) (Nacalai Tesque Company, Japan) and cetyl tetraethylammonium bromide (C19H42BrN) (CTAB, Wako Pure Chemical Industries, Ltd., Japan) were used as a base for controlling the pH during the reaction and a surfactant for micelle formation in the present solvothermal synthesis method. The detailed preparation process of the CeOx NW is provided elsewhere.36
To prepare the active nanocoated layer having Pt–O–Ce bonds on the CeOx NW, the electron beam irradiation method was used. The electron beam was irradiated using a 2 MV, 60 kW electron accelerator of the Cockcroft–Walton type. To minimize electron beam damage on the sample surface, a cooling stage was used.
To prepare the reference sample for comparison of MEA performances, nanosized Pt-loaded CeOx NW/C (Pt-CeOx NW/C) was prepared by using the conventional chemical reduction process. In the conventional chemical reduction method, the CeOx NWs and K2PtCl4 were mixed in distilled water for 12 h at room temperature. After that, an aqueous sodium borohydride (NaBH4) solution was dropped into the mixed suspension for reduction of K2PtCl4 on the CeOx NWs. In addition, the suspension with CeOx NWs was filtered, and the filtrate was rinsed with distilled water and ethanol. Subsequently, the filtrate was dried at room temperature in a nitrogen gas flow for 12 h. In the last step, the two kinds of Pt-CeOx NW/C (Pt/C = 0.2) samples, which were prepared by the electron beam irradiation method and the conventional chemical reduction method, were mixed with conductive carbon (C, Vulcan XC-72R, Cabot Co., USA) in ethanol. Then, the mixed suspension was filtrated and dried in a N2 gas flow for 2 days. Eventually, Pt-CeOx NW/C (CeOx/C in a weight ratio = 0.2, Pt/C in a weight ratio = 0.2) cathode samples were prepared.
2.2. Characterization of Samples
The morphologies and microstructures of the cathode samples were characterized using a scanning transmission electron microscope (STEM). STEM observation was performed at an electron accelerating voltage of 200 kV (JEM-ARM 200F, JEOL Ltd., Japan, at the NIMS TEM station, and HF 5000, Hitachi High-Technologies Company, Japan, at the Center for Microscopy and Microanalysis of the University of Queensland, Australia). In addition, elemental mapping was performed using the scanning transmission electron microscope–energy-dispersive spectroscopy (STEM–EDS) analysis technique. The surface chemical compositions of Pt-CeOx NW/C samples were characterized using soft X-ray photoelectron spectroscopy (SXPS) with an Al Kα light source. A detailed description of the process of estimating the Ce3+/Ce4+ ratio is given elsewhere.43
2.3. Surface First-Principles Calculation
The first-principles calculations were performed using ABINIT code.64 The electron–ion interaction was described by the projector-augmented wave (PAW) method,65,66 and the PAW atomic data were taken from the JTH PAW atomic dataset table.67
The plane wave cutoff energy was taken to be 22 Ha. Three different supercell sizes were used, namely, 1 × 1, 1 × 2, and 1 × 3, in the present calculations. A 4 × 4 × 1 k-point mesh was used to sample Brillouin zone integration for the 1 × 1 supercell. For 1 × 2 and 1 × 3 supercells, the same k-point spacing was used. The structures were deemed relaxed after the potential residual had fallen below 1.0 × 10⁻⁸. In our calculations, the cubic CeO2(111) surface was modeled by a symmetric slab containing five Ce atom layers and 10 O layers. The formation energy (Ef) of the short-range defect cluster was defined by
| 6 |
where Etot is the total energy of the
system with a defect structure, Esurface is the total energy of the system without
a defect structure, and  , EPtref,
and
, EPtref,
and  are the energies of reference
states for
CeO2, dopant Pt, and O2, respectively. According
to the definition of eq 6, a negative formation energy indicates that the short-range defect
cluster will be formed spontaneously.
are the energies of reference
states for
CeO2, dopant Pt, and O2, respectively. According
to the definition of eq 6, a negative formation energy indicates that the short-range defect
cluster will be formed spontaneously.
Also, the adsorption energy (Ea) of water molecules on the surface was defined as
| 7 |
where Esurf is the total energy of the system without H2O,  is the energy of the reference state for
H2O, Etotal is the total energy
of the system with H2O, and nH2O is the number of H2O molecules in this
system. In the case of present calculations, a positive value means
preferring to adsorb H2O on the surface.
is the energy of the reference state for
H2O, Etotal is the total energy
of the system with H2O, and nH2O is the number of H2O molecules in this
system. In the case of present calculations, a positive value means
preferring to adsorb H2O on the surface.
2.4. Evaluation of Activity on Pt-Nanocoated CeOx NW/C in the Cathode Layer of MEA
2.4.1. Preparation of MEA
Both anode and cathode layers were prepared by applying anode and cathode catalyst inks to wet-proof carbon paper (i.e., gas diffusion layer (GDL)), respectively. To prepare the catalyst ink, the cathode powder (i.e., Pt-CeOx NW/C (Pt/C = 0.2) or conventional Pt/C (Pt/C = 0.2; HiSPEC3000, Johnson Matthey Corporation, Japan)) and Nafion solution (5 wt % solution, Fujifilm Wako Pure Chemical Corporation, Japan) were mixed by a homogenizer mixer from 1 to 2 min. Then, additional mixing was performed using a shaker at 2500 rpm for 30 min. The anode catalyst powder (i.e., conventional Pt/C) and the Nafion solution were also mixed in the same way as the preparation of the cathode ink. The formed catalyst inks were directly spread on the GDL using a brush. The amount of Pt in the Pt/C cathode ink was 0.15 mgPt cm–2 on the GDL. Also, the amount of Pt in the Pt/C anode ink was 0.15 mgPt cm–2 on the GDL as well. To make MEA, a commercially available Nafion membrane (NR212, DuPont, Japan) was sandwiched by two electrodes and pressed at 150 °C for 20 min. The pressing pressure was 2.5 MPa.
2.4.2. MEA Performance
The electrocatalyst performance in the cathode layer of MEA was examined using an MEA test holder (Mic Lab Corporation, Japan). During the measurement of the electrode performance, hydrogen gas humidified at 70 °C (80 mL min–1) and oxygen gas humidified at 70 °C (80 mL min–1) were flowed into the anode and cathode sides, respectively. The IR-free polarization characteristics (i.e., cell potential (IR-free) vs cell current density curves) and IR-included polarization characteristics (i.e., I (current density) vs V (cell potential) curves) recorded from the MEA were evaluated by a current interrupt method at 70 °C. A potentiostat/galvanostat (HAL3001A, Hokuto Denko, Japan) as a fast solid-state switch was used for this measurement. Data were collected using a digital storage oscilloscope (DS5612A, Iwatsu, Japan).
For measurement of the cell potentials between OCV and zero, the current was varied by adjusting the resistance of the external load. In order to obtain data at higher current densities, an external voltage was applied to the cell using a function generator (HB305, Hokuto Denko, Japan). In addition, all I–V curves were obtained under the steady-state condition, which is fixed with reference to the NEDO fuel cell measurement protocol.68
3. Results and Discussion Section
3.1. Optimization of Preparation Conditions of Nanocoated Layers Containing Pt–O–Ce Bonds on Pt-CeOx NW/C
Since the three-dimensional nanoparticles are easily agglomerated and two-dimensional nanosheet materials have a stacking problem, it is hard to prepare the homogeneous and active nanocoated layer on the CeOx support as a cathode component of the MEA. To coat the homogeneous surface layer having Pt–O–Ce bonds on the CeOx support, we selected the CeOx NW as an oxide support, refer to Figures S1 and S2 of the Supporting Information. The as-prepared CeOx NW in the present work consisted of one-dimensional polycrystalline CeOx nanoparticles (particle sizes of 4–5 nm), and the aspect ratio of the CeOx NW was greater than 20.
As mentioned in the Introduction, the authors successfully formed a Pt-nanocoated layer on the CeOx NWs using the proton irradiation method. Furthermore, our electrochemical measurements confirmed that the formation of Pt–O–Ce bonds together with fine Pt particles in this nanocoated layer enhances the ORR on the Pt/C cathode.57 However, it is impossible to prepare the cathode powder for MEA using a small amount of high-energy proton radiation emitted from the tip of a small glass capillary attached to the ion accelerator. Therefore, to obtain the necessary amount of cathode powder for fabrication of MEA, electron irradiation experiments were conducted by adding C2H5OH to a suspension consisting of K2PtCl4 aqueous solution and CeOx NWs (C2H5OH/K2PtCl4 molar ratio = 5), as in the case of proton irradiation experiments. In addition, to obtain the similar effect of Pt nanocoating layer formation on CeOx NWs to that in the proton irradiation experiment, the electron dose was first set to 500 kGy.
However, contrary to our expectations, nanosized Pt particles (particle size of approximately 3–10 nm) were only inhomogeneously deposited on the CeOx NW without formation of a Pt-nanocoated layer on the CeOx NW under electron beam irradiation to the mixed suspension, refer to Figure 1. This tendency did not change even when the dose amount of electrons was changed. At an electron dose of 100 kGy, Pt particles were slightly deposited on the surface of CeOx NWs, but the number of Pt particles on the CeOx NW was not enough, refer to Figure S3. On the other hand, at an electron dose amount of 1 MGy, the number of deposited Pt particles on the CeOx NW increased sufficiently, but coarse Pt particles were observed due to the grain growth of Pt particles, refer to Figure S4. Based on the obtained results, it is found that the Pt-nanocoated layer on CeOx NWs could not be formed by changing the dose amount of the electron beam.
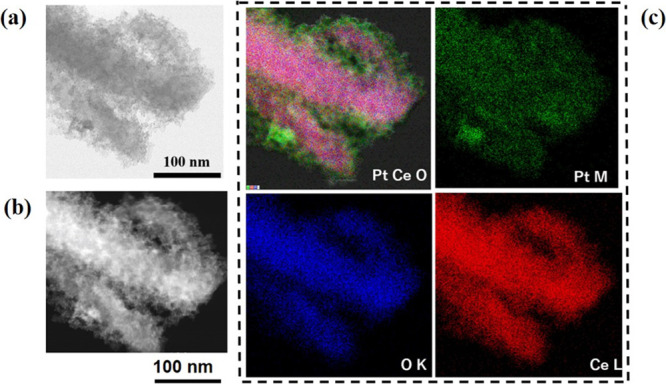
Figure 1.

STEM–EDS analysis observed for Pt-CeOx NW (Pt/C = 0.2) using a high-resolution image, a dark-field image, a high-resolution dark-field image, a Ce L mapping image, an O K mapping image, and a Pt L mapping image. Electron beam dose level, 500 kGy; C2H5OH/K2PtCl4 molar ratio = 5.
Since the radical density generated by proton irradiation is two orders of magnitude greater than that by electron beam irradiation, it seemed to be so difficult to produce the required hydrogen radical (H·) density on the CeOx NW surface even if the dose amount of the electron beam was adjusted.
Initially, since C2H5OH plays a scavenger function for the hydroxyl radical (·OH), we expected that a higher molar ratio of C2H5OH/K2PtCl4, such as 5, would inhibit the formation of ·OH effectively and increase the density of H· that was thought to be generated simultaneously, resulting in the formation of the uniform Pt nanocoating layer on the CeOx NW surface the same as the proton irradiation experiment. However, the result shown in Figure 1 suggested that the generation of the hydroxyl radical (·OH) plays an important role in activating the CeOx NW surface and forming the Pt-nanocoated layer with Pt–O–Ce bonds on the CeOx NW surface. Based on the suggestion from the results in Figure 1 and Figures S3 and S4, we attempted to activate the surface of CeOx NWs and form a Pt nanocoating layer on the CeOx NW by decreasing the molar ratio of C2H5OH/K2PtCl4 from 5 to 0.1.
As expected based on the results in Figure 1 and Figures S3 and S4, the TEM observation result shows that Pt homogeneously covered the surface of the CeOx NW to form an interfacial layer, refer to Figure 2. The width of the Pt nanocoating layer observed in Figure 2 was 10–20 nm. On the other hand, when the molar ratio of C2H5OH/K2PtCl4 decreased from 0.1 to 0.05 under the same electron dose amount (i.e., 500 kGy), the Pt nanocoating layer that includes Pt nanoparticles (average particle size of approximately 3 nm) appeared to be partially formed on the CeOx NWs, refer to Figure 3. According to the STEM–EDS analysis data in Figure 3, when the molar ratio of C2H5OH/K2PtCl4 was less than 0.05, the scavenging effect of C2H5OH on ·OH was insufficient. As a result, it becomes difficult to form a uniform Pt nanocoating layer on the CeOx NW by the reduction of K2PtCl4 due to the low density of H· on the surface of CeOx NWs.
Figure 2.
STEM–EDS analysis data using a STEM image (a), a dark-field image (b), and elemental analysis mapping (c) including a combination map of the Pt M map, the Ce L map, and the O K map, the O K map, the Pt M map, and the Ce L map (c) observed for Pt-nanocoated CeOx NW/C (Pt/C = 0.2). Electron beam dose level, 500 kGy; C2H5OH/K2PtCl4 molar ratio = 0.1.
Figure 3.

STEM–EDS analysis results observed for Pt-CeOx NW/C (Pt/C = 0.2) using a high-resolution dark-field image (a) and a low-magnification dark-field image, a Pt M mapping image, a Ce L mapping image, and an O K mapping image (b). Electron beam dose level, 500 kGy; C2H5OH/K2PtCl4 molar ratio = 0.05.
In contrast, the interface defect structure on the CeOx NW support was suddenly changed by electron beam irradiation when the molar ratio of C2H5OH/K2PtCl4 in the mixed suspension became 0.5. Very tiny Pt species whose particle size was around 2 or 3 Å were homogeneously incorporated on the CeOx NW surface, refer to Figures S5 and S6 of the Supporting Information. This change of the microstructure suggests that the Pt species diffused into the CeOx NWs through the grain boundaries and dissolved into the CeOx lattice. Although the particle size of Pt as the electrode active material seemed to be very small (around 2 or 3 Å) in this case, it was unlikely to contribute to the improvement of fuel cell performance as a cathode of MEA when Pt particles were incorporated into the lattice of CeOx NWs. When the molar ratio of C2H5OH/K2PtCl4 was further increased to 5, not only the electrode active material Pt incorporated into the CeOx NW lattice but also its particle size became approximately 5–10 nm due to the grain growth of Pt, refer to Figure 1.
Based on all data from Figures 1–3, it can be confirmed that the Pt-nanocoated layer could be homogeneously formed on the defect-rich CeOx NW surface by proper control of the CeOx NW surface activation effect by the strong oxidant ·OH, which is produced through water radiolysis under electron beam irradiation. The electron dose amount and the molar ratio of C2H5OH/K2PtCl4 were 500 kGy and 0.1, which were decided as optimum conditions, respectively.
3.2. Characterization of the Surface Composition of the Pt-Nanocoated CeOx NW
To characterize the difference between the defect interface on nanosized Pt-CeOx NW/C prepared by the chemical reduction method of K2PtCl4 using sodium tetrahydroborate (NaBH4) as a reducing agent (i.e., the conventional chemical reduction method) and the defect structure of the Pt-nanocoated CeOx NW obtained in the present work, microanalysis using XPS and TEM was performed.
The two spin–orbital splitting doublets Pt 4f7/2 and 4f5/2 were observed in the Pt 4f spectrum taken from Pt-nanocoated CeOx NW/C as shown in Figure 4. The peak at 71.1 eV is attributable to metallic Pt (Pt0). The other extra peak located at a binding energy of 72.0 eV is labeled as Pt–O–X (X: Ce cation or oxygen vacancy) and corresponds to slightly ionized Pt.12,44,57 This slightly ionized Pt peak, which is located midway between metallic Pt and Pt2+ (i.e., PtO located at 72.6 eV), appeared in the Pt 4f spectrum due to the formation of Pt–O–Ce bonds at the interface between Pt and CeOx. Based on the results shown in Figure 4, the peak area ratio of Pt–O–X (X: Ce cation or oxygen vacancy) species when the peak area of metallic Pt species was 1 was 0.53, refer to Table 1.
Figure 4.

XPS Pt 4f and Ce 3d spectra recorded from Pt-nanocoated layer CeOx NW/C, which was prepared using the electron beam irradiation method. Pt–O–X (X: Ce cation or oxygen vacancy); electron beam dose level, 500 kGy; C2H5OH/K2PtCl4 molar ratio = 0.1.
Table 1. Surface Chemical Compositions of the Samples Using XPS.
| Pt0 | Pt4+ | Pt2+ | Pt–O–X (X: Ce cation or VO··) | Ce3+/Ce4+ | |
|---|---|---|---|---|---|
| Pt-nanocoated CeOx NW/C | 1 | 0.29 | 0.40 | 0.53 | 0.26 |
| nanosized Pt-loaded CeOx NW/C | 1 | 0.23 | 0.34 | 0.44 | 0.18 |
| CeOx NW/C | - | - | - | - | 0.03 |
On the other hand, the Pt 4f spectrum taken from nanosized Pt-CeOx NW/C, which was prepared using the conventional chemical reduction method, consisted of two spin–orbital splitting doublets Pt 4f7/2 and 4f5/2 as well, refer to Figure S7 in the Supporting Information. The peak area ratio of Pt–O–X (X: Ce cation or oxygen vacancy) species to metallic Pt species taken from the Pt 4f spectrum of Pt-CeOx NW/C prepared using the conventional chemical reduction method (i.e., 0.44) was less than that value estimated for the sample shown in Figure 4. The observed Pt 4f spectra using XPS analysis suggested that Pt–O–Ce bonds were widely formed on the CeOx NW surface using the electron beam irradiation method.
In addition, the Ce 3d spectrum taken from the sample that was prepared using the electron beam irradiation method consisted of both Ce3+ (labeled as u0, v0, u′, and v′, where the symbols u and v are spin–orbital partners of 3 d5/2 and 3 d3/2, respectively) and Ce4+ (labeled as u, v, u″, v″, u‴, and v‴), refer to Figure 4 and Table 1. The Ce3+/Ce4+ ratio estimated from the Ce 4d spectrum was 0.26. It was higher than that ratio estimated from the sample that was prepared using the conventional reduction method (i.e., 0.18) as shown in Figure S7 and Table 1. The surface of the as-prepared CeOx NW only, which was analyzed for comparison, mainly consisted of Ce4+ species and a very small amount of Ce3+ species (i.e., Ce3+/Ce4+ ratio ≈ 0.03), refer to Figure S8 and Table 1. We concluded that Ce3+ species on the CeOx NWs with Pt-nanocoated layers and nanosized Pt-CeOx NWs originate from the formation of surface defect structures having Pt–O–Ce bonds. Furthermore, the XPS analysis data, where the Ce3+/Ce4+ ratio (= 0.26) estimated from the chemical composition analysis of the CeOx NW surface with a Pt-nanocoated layer was larger than the Ce3+/Ce4+ ratio (= 0.18) estimated from that of the nanosized Pt-CeOx NW surface, suggests that the surface defect structure consisting of Pt–O–Ce bonds was widely formed on the CeOx NW surface under electron beam irradiation.
Also, the comparison of TEM–EDS elemental map images taken from the nanosized Pt-CeOx NW (refer to Figure S9) and the Pt-nanocoated CeOx NW (refer to Figure 2) clearly agrees with the analysis data of the surface chemical composition using XPS. Based on all microanalysis data taken from the Pt-nanocoated CeOx NW and the nanosized Pt-loaded CeOx NW, we concluded that the Pt-nanocoated layer with Pt–O–Ce bonds was homogeneously formed on the CeOx NW using the electron beam irradiation method.
3.3. Activity on Pt-Nanocoated CeOx NW/C in the Cathode Layer of MEA
To examine the formation effect of the Pt-nanocoated layer with Pt–O–Ce bonds on the CeOx NW for fabrication of high-quality MEA, which has good balance between high fuel cell performance and high stability, the authors examined the performance of MEA whose cathode consisted of Pt-nanocoated CeOx NW/C. Especially, we focused on the fuel cell performance in the activation overpotential region (i.e., the Tafel region) using MEA.
In general, the large excess overpotential on electrocatalysts in MEA can be examined using the polarization curve (Figure 5a) and the Tafel line (Figure 5b) derived from the polarization curve, which were observed for the MEA. In the Tafel region, the excess overpotential observed for the anode layer of the MEA was at a negligible level, and the influence of ORR activity observed for Pt-nanocoated CeOx NW/C in the cathode layer on the fuel cell performance of MEA can be examined. Also, when estimating the activation overpotential of the Tafel region from the polarization curve (I–V curve) observed from the MEA, a linear regression equation (y = −ax + b) was first created using the measured values in the Tafel region. Then, from the linear regression equation, the cell potential at any current density (x) in the Tafel region was obtained, and the difference (= 1.17 – y) between the theoretical electromotive force (= 1.17 V) and the calculated y value corresponds to the activation overpotential at that current density.
Figure 5.

Typical polarization curve vs current density (a) and Tafel plot (b) derived from the polarization curve (a) observed for the Pt-nanocoated CeOx NW/C cathode in MEA at 140 h of fuel cell operation time. Operation temperature, 70 °C; electrolyte: Nafion 212; anode: Pt/C (Pt/C = 0.2; Pt, 0.15 mgPt cm–2); cathode: Pt-nanocoated CeOx NW/C (Pt/C = 0.2; Pt, 0.15 mgPt cm–2); cathode gas: wet H2 at 80 mL min–1; anode gas: wet O2 at 80 mL min–1.
Therefore, the authors created the Tafel lines from the polarization curve (Figure 5a) obtained from MEA using Pt-nanocoated CeOx NW/C. Then, we obtained the linear regression equation using the values of current density and cell potential in the Tafel region, refer to Figure 5b. In addition to measurement of performance in the Tafel region, the examination of stability of the initial performance of MEA is important to employ the Pt-nanocoated CeOx/C cathode for fuel cell device applications.
According to the previously published MEA evaluation and analysis protocol guideline,68 the linear regression equations obtained from the Tafel lines obtained from the polarization curves observed from MEAs using the standard Pt/C cathode and MEAs using the Pt/C cathode with slightly lower activity are shown in eqs 8 and 9, respectively.
| 8 |
which is an estimation from MEA with a standard Pt/C cathode.
| 9 |
which is an estimation from MEA with a low-activity Pt/C cathode.
The activation overpotentials at a current density of 100 mA cm–2 calculated from these linear regression equations (i.e., eqs 8 and 9) were 0.35 and 0.49 V for an MEA using a standard Pt/C cathode and an MEA using a Pt/C cathode with slightly lower performance, respectively.
On the other hand, the activation overpotential at 100 mA cm–2 (after 140 h of operation) estimated from the linear regression equation (refer to Figure 5b) in the Tafel region obtained from the MEA using the Pt-nanocoated CeOx NW/C cathode was 0.17 V. The activation overpotential estimated from the MEA with the Pt-nanocoated CeOx NW/C cathode was approximately half as compared to the previously reported MEA with a standard Pt/C cathode (0.35 V),68 indicating that the MEA with the Pt-nanocoated CeOx NW/C cathode showed better performance than the previously reported standard MEA even after 140 h of operation of the MEA.
To conclude the usefulness of the fabricated Pt-nanocoated layer on the CeOx NW in MEA, the stability of the initial performance was examined as well. Consequently, we focused on the cell potential (IR-free) at a 100 mA cm–2 cell current density in the present work. Also, the operation time dependence of the cell potential (IR-free) at 100 mA cm–2 was observed for Pt-nanocoated CeOx NW/C (Pt/C = 0.2), nanosized Pt-CeOx NW/C (Pt/C = 0.2) fabricated using the chemical reduction method, and conventional nanosized Pt/C (Pt/C = 0.2) in the same MEA operation condition, refer to Figure 6. The initial performance of nanosized Pt-CeOx NW/C (Pt/C = 0.2) was at a low level. During the operation of MEA, the active Pt metal on the CeOx NW surface would be leached out. The performance of nanosized Pt-CeOx NW/C (Pt/C = 0.2) was improved, refer to open triangle plots in Figure 6. However, it did not reach the performance level observed for the conventional nanosized Pt/C in MEA. This suggests that the density of the three-phase boundary (TPB) that is created by the active metal Pt, Nafion ionomer solution, and hydrogen gas in the cathode layer of MEA did not reach a high level. Then, the cell potential (IR-free) at 100 mA cm–2 did not reach that of the conventional nanosized Pt/C in the present work.
Figure 6.
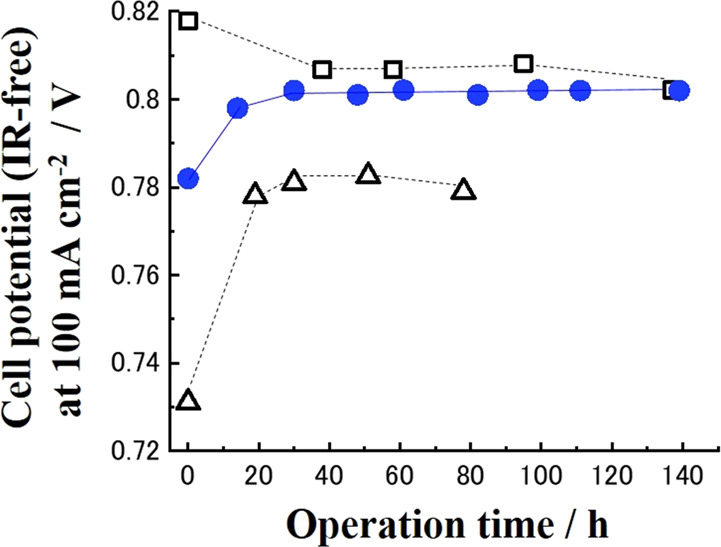
Cell potential (IR-free) at 100 mA cm–2 vs operation time. Pt-nanocoated CeOx NW/C (blue filled circles), nanosized Pt-loaded CeOx NW/C (open triangles), and conventional Pt/C (open squares). Operation temperature, 70 °C; electrolyte: Nafion 212; anode: Pt/C (Pt/C = 0.2; Pt, 0.15 mgPt cm–2); cathode: Pt-nanocoated CeOx NW/C (Pt/C = 0.2), nanosized Pt-loaded CeOx NW/C (Pt/C = 0.2), and conventional nanosized Pt/C (Pt/C = 0.2; Pt, 0.15 mgPt cm–2); cathode gas: wet H2 at 80 mL min–1; anode gas: wet O2 at 80 mL min–1.
In contrast, the initial performance observed for Pt-nanocoated CeOx NW/C (Pt/C = 0.2) was conspicuously higher than that of nanosized Pt-CeOx NW/C (Pt/C = 0.2). After we observed some improvement of performance from Pt-nanocoated CeOx NW/C (Pt/C = 0.2) as well as nanosized Pt-CeOx NW/C (Pt/C = 0.2), the stable performance for MEA with the Pt-nanocoated CeOx NW/C (Pt/C = 0.2) cathode layer was observed during 140 h, refer to blue-colored circle plots in Figure 6. Note that the activation overpotential at 140 h of operation for the MEA using the conventional nanosized Pt/C cathode and the activation overpotential at 80 h of operation for the MEA using the nanosized Pt-CeOx NW/C cathode, which were used for comparison in Figure 6, were estimated to be 0.17 and 0.18 V, respectively (refer to Figures S10 and S11 of the Supporting Information). These data suggested that the activation overpotentials at 100 mA cm–2 of the MEAs compared in Figure 5 were all lower than the values of the MEA using the standard Pt/C cathode previously reported and highlighted that the values observed for MEA using Pt-nanocoated CeOx NW/C after 140 h of operation were at a high level.
Usually, it is well-known that the degradation of the initial performance of conventional Pt/C in the cathode layer of MEA is observed as shown in Figure 6. The well-dispersed small Pt particles whose size was around 2 nm on conductive carbon were easily agglomerated under operation conditions of MEA. Consequently, the initial performance of MEA using the conventional nanosized Pt/C cathode was gradually decreased by agglomeration of nanosized Pt particles and lowering of TPB density in the cathode layer. In contrast, the initial performance observed for Pt-nanocoated CeOx NW/C (Pt/C = 0.2) in the cathode layer can remain at a high level and was seen to be stable as a result of the formation of the nanocoated layer on the CeOx NW support. Note that Pt-CeOx NW/C (Pt/C = 0.2) samples fabricated by out-of-optimal conditions of electron beam irradiation did not show good performance as the Pt-nanocoated CeOx NW/C (Pt/C = 0.2), refer to Figure S12.
To highlight the advantage of the Pt-nanocoated layer, which was fabricated using the electron beam irradiation method for fuel cell applications, the effect of Pt nanocoating layer formation on the reduction of the Pt content in the cathode layer of MEA was examined. Figure 7 presents the relationship between the observed cell potential (IR-free) at 100 mA cm–2 and the operation time of MEA using Pt-nanocoated CeOx NW/C (Pt/C = 0.04) and conventional Pt/C (Pt/C = 0.04). In the case of those lower-amount Pt cathode samples, each Pt content in Pt-nanocoated CeOx NW/C (Pt/C = 0.04) and conventional P/C (Pt/C = 0.04) in the cathode layer of MEA was 0.03 mgPt cm–2, which was one-fifth as compared with the samples shown in Figure 6. At the start point of the performance of MEA, both Pt-nanocoated CeOx NW/C (Pt/C = 0.04) and conventional P/C (Pt/C = 0.04) showed similar fuel cell performance. However, conventional P/C (Pt/C = 0.04) clearly showed performance degradation after 40 h of operation time. After 60 h of operation time, we observed severe flooding phenomenon at a 100 mA cm–2 current density, refer to the subfigure in Figure 7. It would be attributable to the agglomeration of nanosize Pt during operation and associated degradation of ORR activity on Pt. In contrast, the fuel cell performance observed for Pt-nanocoated CeOx NW/C (Pt/C = 0.04) in the cathode layer of MEA was slightly increased with increasing operation time as shown in open blue-colored circle plots in Figure 7. The activation overpotential at 84 h of operation time for the MEA using a low-amount Pt-nanocoated CeOx NW/C (Pt/C = 0.04) cathode was estimated to be 0.22 V. The value of the activation overpotential (0.22 V) at 100 mA cm–2 estimated from the Tafel line of the MEA using this low-amount Pt sample was higher than that of the Pt-nanocoated CeOx NW/C (Pt/C = 0.2) (0.17 V) shown in Figure 6, but it was still lower than the value of the activation overpotential (0.35 V)68 of the MEA using the previously reported standard Pt/C.
Figure 7.

Cell potential (IR-free) at 100 mA cm–2 vs operation time. Pt-nanocoated CeOx NW/C (open blue circles) and conventional Pt/C (open squares). Operation temperature, 70 °C; electrolyte: Nafion 212; anode: Pt/C (Pt/C = 0.2; Pt, 0.15 mgPt cm–2); cathode: Pt-nanocoated CeOx NW/C (Pt/C = 0.04; Pt content, 0.03 mgPt cm–2) and conventional nanosized Pt/C (Pt/C = 0.04; Pt content, 0.03 mgPt cm–2); cathode gas: wet H2 at 80 mL min–1; anode gas: wet O2 at 80 mL min–1.
This clearly indicates that the Pt-nanocoated layer on the CeOx NW is useful to keep favorable balance between high performance and stability when we try to prepare the low Pt-loaded cathode for fuel cell applications.
3.4. Modeling for a Conclusion about the Role of a Pt-Nanocoated Layer on the CeOx NW
To consider why the formation of Pt-nanocoated layers on CeOx NWs in the cathode layer of MEAs contributes to maintaining a favorable balance between high performance and stability of MEAs when preparing a low Pt-loaded cathode, surface first-principles calculation was conducted using ABINIT code. The surface energy of CeO2(111) was calculated for the (1 × 1) surface, the (1 × 2) surface, and the (1 × 3) surface in advance and is given in Table 2 and Figure S13 of the Supporting Information. The calculated CeO2(111) surface energies in Table 2 agree with previously reported results.70−75
Table 2. Surface Energies of the (111) CeO2 Surface.
In the previously published work76 that investigated Pt and Pt-vacancy cluster formation on 3D, 2D, and 1D CeO2 nanostructures, the CeO2 nanostructures exposed (110) surfaces for the 3D model. For the 2D model, only the interface between CeO2(100) and TiO2(112) surfaces was considered. However, it is well-known that the (111) surface of CeO2 is the most thermodynamically stable surface, and this conclusion had been confirmed by dynamic force microscopy, scanning tunneling microscopy, and computer simulations.77−83 In addition, the Pt adsorption energy on the CeO2(110) surface (−2.36 to −2.73 eV) in the previously published work76 was much lower than that on the CeO2(111) surface (−5.0 to −6.7 eV). It means that the use of the CeO2(111) surface in the modeling work is essential for reasonable design of the active interface between Pt and CeO2.The authors concluded that the defect clusters were formed in the Pt-nanocoated layer on the CeOx NW based on microanalysis data by following defect cluster formation reactions and the combination of those clusters.
For the CeOx NW,
| 10 |
| 11 |
| 12 |
where the Kröger–Vink notation is used to explain the defect structure formation.
The lattice defect and defect cluster formation reactions (i.e., eqs 10–12) on the CeOx NW surface would be promoted by the irradiation energy of the electron beam. In addition to the formation reaction of surface defect clusters on the CeOx NW, the nanosized Pt particle formation (i.e., eqs 4 and 5) was induced on the CeOx NW, refer to Figures 1 and 3 and Table 1. The calculated formation energies indicated that the lattice defect of Ce3+ (i.e., 2CeCe′VO··), the lattice defect of Pt2+ (i.e., PtCe″VO··), and the Pt2+ defect cluster (i.e., 2CeCe′PtCe″2VO··) are stably formed on the CeO2(111) surface, refer to Table 3.
Table 3. Formation Energy of the Defect Cluster on the CeO2(111) Surfacea.
| lattice defect and cluster | n(Pt2+)/n(Ce3+) | Ef (eV) |
|---|---|---|
| PtCe″-VO·· | ∞ | 0.67 |
| 2CeCe′-VO·· | 0.0 | 3.40 |
| 2CeCe′-PtCe″-2VO·· | 0.5 | 2.64 |
n(Pt2+) and n(Ce3+) are the number of lattice defects of Pt2+ and Ce3+.
To form the high-density TPB in the cathode layer of MEA, the formation of a hydrophilic interface on the cathode sample is required. Namely, the interaction between the Pt-vacancy cluster and H2O is a key to consider the homogeneous electrical double layer on the active site on the cathode. However, the previously published work76 only calculated the formation energies and adsorption energies of the single Pt atom and Pt-vacancy clusters. The adsorption energy of H2O on active sites on the cathode was unconsidered. In the present work, the adsorption energies of H2O on the Pt atom and Pt-vacancy clusters were calculated. Moreover, the concentration of Pt vacancies and adsorption sites of H2O were also systematically investigated. Consequently, the effect of the formation of Pt-vacancy clusters on adsorption of H2O could be directly obtained in the present work.
In general, electrocatalysis on Pt proceeds through the electrical double layer, which consists of adsorbed H2O on Pt. To form the high-density TPB in the cathode layer, in addition to calculating the formation energy of Pt2+ defect clusters on the CeO2(111) surface, the adsorption energies of water molecules on the CeO2(111) surface were calculated for the (1 × 1) surface, the (1 × 2) surface, and the (1 × 3) surface in advance, refer to Table 4 and Figures S14–S16. Our surface first-principles calculation indicates that hydrogen bonds were stably formed on the cubic CeO2(111) surface. The bond between H and O in H2O molecules was basically parallel to the Ce–O bond on the surface. After we checked the stable adsorption of H2O on the cubic CeO2(111) surface, the adsorption energies of H2O on the lattice defect of Ce3+ (i.e., 2CeCe′VO··), the lattice defect of Pt2+ (i.e., PtCe″VO··), and the Pt2+ defect cluster (i.e., 2CeCe′PtCe″2VO··) were also calculated, refer to Table 5. Our surface first-principles calculation predicted that hydrogen bonds can be formed between H2O molecules and Pt lattice defects or Pt2+ defect clusters. The H–O bond is parallel to the Pt–O bond as well as the Ce–O bond.
Table 4. Adsorption Energy of H2O on the (111) CeO2 Surface.
| adsorption energy of H2O (eV) | |
|---|---|
| (1 × 1) surface | 0.53 |
| (1 × 2) surface | 0.53 |
| (1 × 3) surface | 0.53 |
Table 5. Adsorption Energy of H2O on Lattice Defects and Defect Clustersa.
| lattice defect and cluster | n(Pt2+)/n(Ce3+) | Ef (eV) |
|---|---|---|
| PtCe″-VO·· + H2O | ∞ | 1.59 |
| 2CeCe′-VO·· + 2H2O | 0.0 | 0.49 |
| 2CeCe′-PtCe″-2VO·· + 3H2O | 0.5 | 0.48 |
n(Pt2+) and n(Ce3+) are the number of lattice defects of Pt2+ and Ce3+.
In the next step, the relationship among formation energy (Ef), adsorption energy of H2O (Ea), and the n(Pt2+)/n(Ce3+) ratio was examined based on the surface first-principles calculation data, where n means the number of lattice defects of Pt2+ and Ce3+. Our surface first-principles calculation indicates that there is a trade-off relation between improvement of hydrophilicity on the Pt-nanocoated layer on the CeOx NW and stable formation of lattice defects or defect clusters, refer to Figure 8a. To figure out a better fabrication condition of a high-density TPB in the cathode layer of MEA application, we concluded the optimal range that can make a good balance between formation energy (Ef) and adsorption energy of H2O (Ea) based on surface first-principles simulation results. Since enough H2O molecules were provided in the cathode layer of MEA in the operation of fuel cell devices, it was concluded that the calculated energy (Ef + 3Ea) indicated the optimal region for formation of the active Pt-nanocoated layer on the CeOx NW in the cathode layer of MEA, refer to Figure 8b.
Figure 8.

Relationship among formation energies (Ef), adsorption energies (Ea) of water, and the n(Pt2+)/n(Ce3+) ratio (a) and the n(Pt2+)/n(Ce3+) ratio vs Ef + Ea (squares), Ef + 2Ea (triangles), and Ef + 3Ea (circles) (b). Ef, formation energy; Ea, adsorption energy of water; n(Pt2+) and n(Ce3+) are the number of lattice defects of Pt2+ and Ce3+.
Based on results of our surface first-principles calculation, the feature of the active interface structure formed by the electron beam irradiation method was summarized from the viewpoint of crystallography. The size of defect clusters was approximately 11 Å, refer to Figure 9. To conclude why this defect cluster can be stable on the CeOx NW and plays a key role in the cathode layer of MEA, the defect cluster indicated by surface first-principles calculation was applied to the C-type rare-earth structure (111) surface (space group Ia3), which is a related crystal structure of the fluorite CeO2(111) surface (space group Fm3̅m). The C-type rare-earth structure has more oxygen vacancy sites in the unit cell as compared with the fluorite structure. Twenty-five percent of oxygen sites are vacant and appear ordered on the surface. The representative example of the C-type rare-earth structure can be seen in Ce2O3, Y2O3, and so on.
Figure 9.

Schematic diagram of the defect interface structure of Pt-nanocoated CeOx NW based on the first-principles calculation results.
A large amount of Ce2O3 appeared on the CeOx NW matrix under electron beam irradiation, refer to Table 1. To conclude the defect structure of the Pt-nanocoated layer on the CeOx NW based on the surface first-principles calculation results, first, the C-type rare-earth structure (111) surface, which consisted of Ce3+ and lattice oxygen (VO··), was considered. The distance between two oxygen vacancies that belong to Pt2+ defect clusters (i.e., 2CeCe′PtCe′2VO··) in long length corresponds to the distance between ordered oxygen vacancies on the Ce2O3(111) surface (i.e., approximately 11 Å), refer to Figure 9. Since the size of Pt2+ defect clusters (i.e., 2CeCe′PtCe″2VO··) fits to the C-type rare-earth structure Ce2O3(111) surface, the Pt2+ defect cluster can be stably formed on the Ce2O3(111) surface. This suggests that the defect cluster (i.e., 2CeCe′PtCe″2VO··) can be the main component of active sites on the Pt-nanocoated layer on CeOx NW/C.
In addition to the defect structural feature of the Pt-nanocoated layer on CeOx NW/C, our surface first-principles calculation predicted hydrophilic surface formation on Pt and hydrophobic surface formation on CeO2, refer to Figure 10a. In the case of the nanosized Pt-loaded CeOx NW, which was fabricated using the conventional chemical reduction method, nanosized Pt particles were precipitated on the CeOx NW surface. However, the hydrophilic surface would not be widely formed on that sample because Pt particles were nonuniformly precipitated on the CeOx NW surface in the nanoscale, refer to Figure S9 of the Supporting Information. Consequently, it is concluded that the heterogeneous electrical double layer was formed on nanosized Pt-CeOx NW/C. Moreover, the density of the TPB area would be at a low level on conductive carbon in the cathode layer of MEA, refer to Figure 10b. Eventually, it is concluded that the water formation reaction (i.e., fuel cell reaction on the cathode) on Pt was not activated in the cathode layer of MEA and the performance observed for MEA cannot be at an optimum level.
Figure 10.

Schematic diagram of three-phase boundaries on Pt-nanocoated CeOx NW/C (a) and nanosized Pt-loaded CeOx NW/C (b) in the cathode layer of MEA.
In contrast, the homogeneous electrical double layer is widely formed around the Pt2+ defect cluster layer-coated CeOx NW. It is because the Pt2+ defect cluster (i.e., 2CeCe′PtCe″2VO··), which has good balance between formation energy of defect clusters and adsorption energy of water, is widely formed in the interface on the Pt2+ defect cluster layer-coated CeOx NW. Note that the radical species created by the water electrolysis reaction under electron beam irradiation widely modified the surface of the electrocatalyst. After the nanocoating layer of Pt2+ defect clusters is homogeneously formed on the CeOx NW surface, we can expect the formation of a high-density TPB region on the cathode layer of MEA. Consequently, the water formation reaction is promoted on the Pt-CeOx NW/C electrocatalyst in the cathode layer of MEA. As a consequence, a sufficient level of performance of MEA with the Pt2+ defect cluster layer-coated CeOx NW/C electrocatalyst was observed. Also, it is concluded that we can observe the stable performance of MEA due to high stability of Ce3+ species and Pt2+ defect clusters (i.e., 2CeCe′PtCe″2VO··) in acidic conditions. In addition, Pt nanoparticles avoid the severe agglomeration in the Pt-nanocoated layer on the CeOx NW and can keep a high ORR activity in the cathode layer of MEA. Therefore, the high and stable performance observed for Pt-nanocoated CeOx NW/C (Pt/C = 0.04) after 60 h of operation of MEA is a significant improvement to the performance of the conventional Pt-saving Pt/C cathode in MEA, which reveals rapid degradation of MEA performance.
4. Conclusions
To fabricate a high-quality cathode in MEA, which can keep high performance and stability during MEA operation, a Pt-nanocoated layer on CeOx was fabricated using the electron beam irradiation method. The homogeneous Pt-nanocoated layer was successfully formed on the CeOx NW when the electron beam dose amount was 500 kGy and the C2H5OH/K2PtCl4 molar ratio in the suspension with the CeOx NW was 0.1. The effect of the formation of the nanocoating layer on the CeOx NW was evident in the MEA performance test using the low platinum-loaded cathode samples. Pt-nanocoated CeOx NW/C whose Pt content was 0.03 mgPt cm–2 in the cathode layer revealed good balance between fuel cell performance and stability after 60 h of operation time when conventional Pt/C whose Pt content was 0.03 mgPt cm–2 in the cathode layer of MEA showed conspicuous degradation of MEA performance. The Pt2+ defect cluster (i.e., 2CeCe′PtCe″2VO··) formed in the Pt-nanocoated layer on the CeOx NW contributes to both formation of a homogeneous and wide electrical double layer and inhibition of agglomeration of nanosized Pt particles as shown by our surface first-principles calculation. Then, good balance between high performance and stability during operation of MEA, which is difficult for conventional low-Pt amount Pt/C, was achieved by formation of a Pt-nanocoated layer on the CeOx NW using the electron beam irradiation method. In addition, it is expected that the design of a high-quality extremely low-amount Pt-loaded cathode for MEA applications will be also possible by further enhancement of Pt–O–Ce bonds in the nanocoated layer through the modification of electron beam irradiation of the sample surfaces.
Acknowledgments
The authors express gratitude to research work support by Mr. Hiroshi Okubo (Center for Green Research for Energy and Environmental Materials, National Institute for Materials Science (NIMS)). Also, the authors appreciate the kind support for fabrication of ceria nanowire samples without electron beam irradiation from Dr. Bretislav Smid (Charles University, Czech Republic). In the end, the authors really appreciate kind improvement of our English sentences by Emeritus Professor John Drennan (University of Queensland, Australia) for the publication of our work.
Supporting Information Available
The Supporting Information is available free of charge at https://pubs.acs.org/doi/10.1021/acsomega.2c03348.
Morphology and elemental analysis data observed for the as-prepared CeOx nanowire (NW); high-resolution image observed for the as-prepared CeOx NW; STEM images and EDS elemental mapping data observed for the samples prepared in the condition of C2H5OH/K2PtCl4 molar ratio = 5 (electron beam dose levels of 100 kGy and 1 MGy); TEM and STEM images observed for the sample prepared in the condition of C2H5OH/K2PtCl4 molar ratio = 0.5 (electron beam dose level of 500 kGy); line scan analysis data of Pt and Ce and the dark-field image observed for the thin area of the sample prepared in the condition of C2H5OH/K2PtCl4 molar ratio = 0.5 (electron beam dose level of 500 kGy); Pt 4f and Ce 3d spectra taken from the sample prepared using sodium tetrahydroborate (NaBH4) as a reducing agent of K2PtCl4; XPS Ce 3d spectrum taken from CeOx NW/C; TEM–EDS analysis data observed for the nanosized Pt-loaded CeOx NW/C sample; polarization curve at 140 h of operation recorded from conventional nanosized Pt/C and the Tafel plot derived from the polarization curve; polarization curve at 80 h of operation recorded from nanosized Pt-loaded CeOx NW/C and the Tafel plot derived from the polarization curve; operation time dependence of MEA performances observed for Pt-CeOx NW/C samples fabricated under a lower electron dose amount (i.e., 100 kGy) and a higher dose amount (i.e., 1 MGy); supercell of the model surface of CeO2(111) for the (1 × 1) surface, the (1 × 2) surface, and the (1 × 3) surface, which is used in the present surface first-principles calculation; stable water adsorption model on the CeO2(111) surface, which is calculated using (1 × 1), (1 × 2), and (1 × 3) supercells; surface lattice defect models in (1 × 1), (1 × 2), and (1 × 3) supercells; surface water adsorption models on lattice defects in (1 × 1), (1 × 2), and (1 × 3) supercells (PDF)
The present work was partially supported by the NIMS Joint Research Hub Program and the research program of the Center for Green Research for Energy and Environmental Materials, NIMS. Also, this work was partially supported by the joint training Ph.D. student program (CSC Student ID 201806060019) of Chinese government.
The authors declare no competing financial interest.
Supplementary Material
References
- Springer T. E.; Zawodzinski T. A.; Gottesfeld S. Polymer electrolyte fuel cell model. J. Electrochem. Soc. 1991, 138, 2334–2342. 10.1149/1.2085971. [DOI] [Google Scholar]
- Kordesch K. V.; Simader G. R. Environmental impact of fuel cell technology. Chem. Rev. 1995, 95, 191–207. 10.1021/cr00033a007. [DOI] [Google Scholar]
- Steele B. C. H.; Heinzel A. Materials for fuel-cell technologies. Nature 2001, 414, 345–352. 10.1038/35104620. [DOI] [PubMed] [Google Scholar]
- Xu C. W.; Shen P. K. Novel Pt/CeO2/C catalysts for electrooxidation of alcohols in alkaline media. Chem. Commun. 2004, 19, 2238–2239. 10.1039/B408589B. [DOI] [PubMed] [Google Scholar]
- a Xu C.; Shen P. K. Electrochemical oxidation of ethanol on Pt–CeO2/C catalysts. J. Power Sources 2005, 142, 27–29. 10.1016/j.jpowsour.2004.10.017. [DOI] [Google Scholar]; b Xu C.; Zeng R.; Shen P. K.; Wei Z. Synergistic effect of CeO2 modified Pt/C catalysts on the alcohols oxidation. Electrochim. Acta 2005, 51, 1031–1035. 10.1016/j.electacta.2005.05.041. [DOI] [Google Scholar]
- Takahashi M.; Mori T.; Kobayashi H.; Drennan J.; Ou D. R.; Nishimura C. Preparation and characterization of nano-hetero Pt-pure CeO2 electrodes supported by carbon materials for direct methanol fuel cells applications. Trans. Mater. Res. Soc. Jpn. 2005, 30, 951–954. [Google Scholar]
- Takahashi M.; Mori T.; Vinu A.; Kobayashi H.; Drennan J.; Ou D. R. Preparation and anode property of Pt - CeO2 electrodes supported on carbon black for direct methanol fuel cell applications. J. Mater. Res. 2006, 21, 2314–2322. 10.1557/jmr.2006.0281. [DOI] [Google Scholar]
- a Takahashi M.; Mori T.; Ye F.; Vinu A.; Kobayashi H.; Drennan J. Design of high quality Pt–CeO2 composite anodes supported by carbon black for direct methanol fuel cells application. J. Am. Ceram. Soc. 2007, 90, 1291–1294. 10.1111/j.1551-2916.2006.01483.x. [DOI] [Google Scholar]; b Takahashi M.; Mori T.; Vinu A.; Ou D. R.; Kobayashi H.; Drennan J. Development of high quality Pt-CeO2 electrodes supported on carbon black for direct methanol fuel cell applications. Adv. Appl. Ceram. 2008, 107, 57–63. 10.1179/174367607X202582. [DOI] [Google Scholar]
- Wang J.; Xi J.; Bai Y.; Shen Y.; Sun J.; Chen L.; et al. Structural designing of Pt-CeO2/CNTs for methanol electro-oxidation. J. Power Sources 2007, 164, 555–560. 10.1016/j.jpowsour.2006.11.041. [DOI] [Google Scholar]
- Guo D. J.; Jing Z. H. A novel co-precipitation method for preparation of Pt-CeO2 composites on multi-walled carbon nanotubes for direct methanol fuel cells. J. Power Sources 2010, 195, 3802–3805. 10.1016/j.jpowsour.2009.12.115. [DOI] [Google Scholar]
- Matolin V.; Matolinova I.; Vaclavu M.; Khalakhan I.; Vorokhta M.; Fiala R.; et al. Platinum-doped CeO2 thin film catalysts prepared by magnetron sputtering. Langmuir 2010, 26, 12824–12831. [DOI] [PubMed] [Google Scholar]
- Chauhan S.; Richards G.; Mori T.; Yan P. F.; Hill J.; Ariga K.; et al. Fabrication of a nano-structured Pt-loaded cerium oxide nanowire and its anode performance in the methanol electro-oxidation reaction. J. Mater. Chem. A 2013, 1, 6262–6270. 10.1039/c3ta10652g. [DOI] [Google Scholar]
- Kim Y. T.; You S. J.; Park E. D. Water–gas shift reaction over Pt and Pt–CeOx supported on CexZr1–xO2. Int. J. Hydrogen Energy 2012, 37, 1465–1474. 10.1016/j.ijhydene.2011.10.014. [DOI] [Google Scholar]
- Ou D. R.; Mori T.; Togasaki H.; Takahashi M.; Ye F.; Drennan J. Microstructures and metal-support interaction of the Pt-CeO2/C catalysts for direct methanol fuel cell application. Langmuir 2011, 27, 3859–3866. 10.1021/la1032898. [DOI] [PubMed] [Google Scholar]
- Mori T.; Fugane K.; Chauhan S.; Ito M.; Masuda T.; Noguchi H.; et al. Design of Pt-CeOx hetero-interface on electrodes in polymer electrolyte membrane fuel cells. IOP Conf. Ser.: Mater. Sci. Eng. 2014, 54, 012010 10.1088/1757-899X/54/1/012010. [DOI] [Google Scholar]
- Ou D. R.; Mori T.; Fugane K.; Togasaki H.; Ye F.; Drennan J. Stability of ceria supports in Pt-CeOx/C catalysts. J. Phys. Chem. C 2011, 115, 19239–19245. 10.1021/jp205640k. [DOI] [Google Scholar]
- Brummel O.; Waidhas F.; Faisal F.; Fiala R.; Vorokhta M.; Khalakhan I.; Dubau M.; Figueroba A.; Kovács G.; Aleksandrov H. A.; Vayssilov G. N.; Kozlov S. M.; Neyman K. M.; Matolín V.; Libuda J. Stabilization of small platinum nanoparticles on Pt-CeO2 thin film electrocatalysts during methanol oxidation. J. Phys. Chem. C 2016, 120, 19723–19736. 10.1021/acs.jpcc.6b05962. [DOI] [Google Scholar]
- Neitzel A.; Johánek V.; Lykhach Y.; Skála T.; Tsud N.; Vorokhta M.; Matolín V.; Libuda J. Reduction of Pt2+ species in model Pt-CeO2 fuel cell catalysts upon reaction with methanol. Appl. Surf. Sci. 2016, 387, 674–681. 10.1016/j.apsusc.2016.06.156. [DOI] [Google Scholar]
- Lykhach Y.; Brummel O.; Bruix A.; Fabris S.; Matolinova I.; Matolin V.; Pt-CeO2 catalysts for fuel cell applications: From surface science to electrochemistry, in Encyclopedia of interfacial chemistry, surface science and electrochemistry ;Wandelt K. (Edited) 2018, Elsevier: Amsterdam, Netherlands, 1st edition, 189–201. [Google Scholar]
- Fiala R.; Vaclavu M.; Rednyk A.; Khalakhan I.; Vorokhta M.; Lavkova J.; Potin V.; Matolinova I.; Matolin V. Pt-CeOx thin film catalysts for PEMFC. Catal. Today 2015, 236–241. 10.1016/j.cattod.2014.03.069. [DOI] [Google Scholar]
- Nováková J.; Dubau M.; Fuka Š.; Duchoň T.; Johánek V.; Fiala R.; Veltruská K.; Potin V.; Matolín V.; Matolínová I. Role of nitrogenated carbon in tuning Pt-CeOx based anode catalysts for higher performance of hydrogen-powered fuel cells. Appl. Surf. Sci. 2020, 515, 146054. 10.1016/j.apsusc.2020.146054. [DOI] [Google Scholar]
- Gebauer C.; Jusys Z.; Jurgen Behm R. On the role of the support in Pt anode catalyst degradation under simulated H2 fuel starvation conditions. J. Electrochem.Soc. 2018, 165, J3342–J3349. 10.1149/2.0461815jes. [DOI] [Google Scholar]
- Li G.; Yao S.; Zhu J.; Liu C.; Xing W. The enhancement effect of nitrogen, fluorine-codoped titanium dioxide on the carbon supported platinum nano-catalyst for methanol electrooxidation reaction. J. Power Sources 2015, 278, 9–17. 10.1016/j.jpowsour.2014.11.118. [DOI] [Google Scholar]
- Chao W.-K.; Huang R.-H.; Huang C.-J.; Hsueh K.-L.; Shieu F.-S. Effect of hygroscopic platinum/titanium dioxide particles in the anode catalyst layer on the PEMFC performance. J. Electrochem.Soc. 2010, 157, B1012–B1018. 10.1149/1.3428725. [DOI] [Google Scholar]
- Hasa B.; Kalamaras E.; Papaionnou E. I.; Sygellou L.; Katsaounis A. Electrochemical oxidation of alcohols on Pt-TiO2 binary electrodes. J. Hydrogen Energy 2013, 38, 15395–15404. 10.1016/j.ijhydene.2013.09.110. [DOI] [Google Scholar]
- Dou M.; Hou M.; Liang D.; Lu W.; Shao Z.; Yi B. SnO2 nanocluster supported Pt catalyst with high stability for proton exchange membrane fuel cells. Electrochim. Acta 2013, 92, 468–473. 10.1016/j.electacta.2013.01.070. [DOI] [Google Scholar]
- Guo D.-J. Electrooxidation of ethanol on novel multi-walled carbon nanotube supported platinum–antimony tin oxide nanoparticle catalysts. J. Power Sources 2011, 196, 679–682. 10.1016/j.jpowsour.2010.07.075. [DOI] [Google Scholar]
- Wang X.; Hu X.; Huang J.; Zhang W.; Ji W.; Hui Y.; Yao X. Electrospinning synthesis of porous carbon fiber supported Pt-SnO2 anode catalyst for direct ethanol fuel cell. Solid State Sci. 2019, 94, 64–69. 10.1016/j.solidstatesciences.2019.05.018. [DOI] [Google Scholar]
- Xu P.-P.; Guo D.-J.; Cui S.-K.; Xiang D.-X.; Peng Y.-F.; Qi F.-J. One-step synthesis of antimony-doped tin oxide/multi-walled carbon nanotube composites: a promising support for platinum catalysts in a direct methanol fuel cell. J. Nanopart. Res. 2014, 16, 2687. 10.1007/s11051-014-2687-5. [DOI] [Google Scholar]
- Xing L.; Wang Y.; Sui C.; Zhang N. Investigation of Pt/SnO2/C catalyst for dimethyl ether oxidation in DDFC. Int. J. Electrochem. Sci. 2020, 15, 2375–2384. 10.20964/2020.03.26. [DOI] [Google Scholar]
- Shen P. K.; Tseung A. C. C. Anodic oxidation of methanol on Pt/WO3 in acidic media. J. Electrochem.Soc. 1994, 141, 3082–3090. 10.1149/1.2059282. [DOI] [Google Scholar]
- Cui X.; Guo L.; Cui F.; He Q.; Shi J. Electrocatalytic activity and CO tolerance properties of mesostructured Pt/WO3 composite as an anode catalyst for PEMFCs. J. Phys. Chem. C 2009, 113, 4134–4138. 10.1021/jp8079205. [DOI] [Google Scholar]
- Ugalde-Reyes O.; Hernández-Maya R.; Ocampo-Flores A. L.; Alvarez-Ramırez F.; Sosa-Hernández E.; Angeles-Chavez C.; Roqueroa P. Study of the electrochemical activities of Mo-modified Pt catalysts, for application as anodes in direct methanol fuel cells: effect of the aggregation route. J. Electrochem.Soc. 2015, 162, H132–H141. 10.1149/2.0521503jes. [DOI] [Google Scholar]
- Sasaki K.; Adzic R. R. Monolayer-level Ru-and NbO2-supported platinum electrocatalysts for methanol oxidation. J. Electrochem. Soc. 2008, 155, B180–B186. 10.1149/1.2816238. [DOI] [Google Scholar]
- Yu H. B.; Kim J. H.; Lee H. I.; Scibioh M. A.; Lee J.; Han J.; Yoon S. P.; Ha H. Y. Development of nanophase CeO2-Pt/C cathode catalyst for direct methanol fuel cell. J. Power Sources 2005, 140, 59–65. 10.1016/j.jpowsour.2004.08.015. [DOI] [Google Scholar]
- Takahashi M.; Mori T.; Togasaki H.; Fugane K.; Tada A.; Matolin V.; Drennan J. Influence of Pt and CeO2 interaction in Pt-CeO2 electrode on anode and cathode performance for fuel cell applications. Trans. Mater. Res. Soc. Jpn. 2008, 33, 1101–1104. 10.14723/tmrsj.33.1101. [DOI] [Google Scholar]
- Lim D.-H.; Lee W. -D.; Choi D.-H.; Kwon H.-H.; Lee H.-I. The effect of cerium oxide nanoparticles on a Pt/C electrocatalyst synthesized by a continuous two-step process for low-temperature fuel cell. Electrochem. Commun. 2008, 10, 592–596. 10.1016/j.elecom.2008.02.001. [DOI] [Google Scholar]
- Lim D.-H.; Lee W.-D.; Choi D.-H.; Lee H.-I. Effect of ceria nanoparticles into the Pt/C catalyst as cathode material on the electrocatalytic activity and durability for low-temperature fuel cell. Appl. Catal. B. 2010, 94, 85–96. 10.1016/j.apcatb.2009.10.024. [DOI] [Google Scholar]
- Masuda T.; Fukumitsu H.; Fugane K.; Togasaki H.; Matsumura D.; Tamura K.; Nishihata Y.; Yoshikawa H.; Kobayashi K.; Mori T.; Uosaki K. Role of cerium oxide in the enhancement of activity for oxygen reduction reaction at Pt-CeOx nanocomposite electrocatalyst - An in situ electrochemical X-ray absorption fine structure study. J. Phys. Chem. C 2012, 116, 10098–10102. 10.1021/jp301509t. [DOI] [Google Scholar]
- Fugane K.; Mori T.; Ou D. R.; Suzuki A.; Yoshikawa H.; Masuda T.; Uosaki K.; Yamashita Y.; Ueda S.; Kobayashi K.; Okazaki N.; Matolinova I.; Matolin V. Activity of oxygen reduction reaction on small amount of amorphous CeOx promoted Pt cathode for fuel cell application. Electrochim. Acta 2011, 56, 3874–3883. 10.1016/j.electacta.2011.02.034. [DOI] [Google Scholar]
- Mori T.; Ou D. R.; Zou J.; Drennan J. Present status and future prospect of design of Pt-cerium oxide electrodes for fuel cell applications. Prog. Nat. Sci.: Mater. Int. 2012, 22, 561–571. 10.1016/j.pnsc.2012.11.010. [DOI] [Google Scholar]
- Fugane K.; Mori T.; Ou D. R.; Yan P. F.; Ye F.; Yoshikawa H.; Drennan J. Improvement of cathode performance on Pt-CeOx by optimization of electrochemical pretreatment condition for PEFC application. Langmuir 2012, 28, 16692–16700. 10.1021/la302912r. [DOI] [PubMed] [Google Scholar]
- Fugane K.; Mori T.; Yan P. F.; Masuda T.; Yamamoto S.; Ye F.; Yoshikawa H.; Auchterlonie G.; Drennan J. Defect structure analysis of hetero-interface between Pt and CeOx promoter on Pt electro-catalyst. ACS Appl. Mater. Int. 2015, 7, 2698–2707. 10.1021/am507754w. [DOI] [PubMed] [Google Scholar]
- Chauhan S.; Mori T.; Masuda T.; Ueda S.; Richards G.; Hill J.; et al. Design of low Pt concentration electro-catalyst surfaces with high oxygen reduction reaction activity promoted by formation of heterogeneous interface between Pt and CeOx nanowire. ACS Appl. Mater. Int. 2016, 8, 9059–9070. 10.1021/acsami.5b12469. [DOI] [PubMed] [Google Scholar]
- Watanabe M.; Uchida H.; Emori M. Polymer electrolyte membrane incorporated with nanometer-size particles of Pt and/or metal-oxides: experimental analysis of the self-humidification and suppression of gas-crossover in fuel cells. J. Phys. Chem. B 1998, 102, 3129–3137. 10.1021/jp973477e. [DOI] [Google Scholar]
- Shim J.; Lee C.-R.; Lee H.-K.; Lee J.-S.; Cairns E. J. Electrochemical characteristics of Pt-WO3/C and Pt-TiO2/C electrocatalysts in a polymer electrolyte fuel cell. J. Power Sources 2001, 102, 172–177. 10.1016/S0378-7753(01)00817-5. [DOI] [Google Scholar]
- Uchida H.; Ueno Y.; Hagihara H.; Watanabe M. Self-humidifying electrolyte membranes for fuel cells preparation of highly dispersed TiO2 particles in Nafion 112. J. Electrochem. Soc. 2003, 150, A57–A62. 10.1149/1.1523412. [DOI] [Google Scholar]
- Selvaganesh S. V.; Selvarani G.; Sridhar P.; Pitchumani S.; Shukla A. K. A Durable PEFC with carbon-supported Pt -TiO2 cathode: A cause and effect study. J. Electrochem. Soc. 2010, 157, B1000–B1007. 10.1149/1.3421970. [DOI] [Google Scholar]
- Vinod Selvaganesh S.; Dhanasekaran P.; Bhat S. D. Nanocomposite TiO2-f-MWCNTs as durable support for Pt in polymer electrolyte fuel cells. J. Solid State Electrochem. 2017, 21, 2997–3009. 10.1007/s10008-017-3628-x. [DOI] [Google Scholar]
- Watanabe M.; Venkatesan S.; Laitinen H. A. Preparation of dispersed platinum on conductive tin oxide and its catalytic activity for oxygen reduction. J. Electrochem. Soc. 1983, 130, 59–64. 10.1149/1.2119683. [DOI] [Google Scholar]
- Okanishi T.; Matsui T.; Takeguchi T.; Kikuchi R.; Eguchi K. Chemical Interaction between Pt and SnO2 and influence on adsorptive properties of carbon monoxide. Appl. Catal., A 2006, 298, 181–187. 10.1016/j.apcata.2005.09.035. [DOI] [Google Scholar]
- Parrondo J.; Mijangos F.; Rambabu B. Platinum/tin oxide/carbon cathode catalyst for high temperature PEM fuel cell. J. Power Sources 2010, 195, 3977–3983. 10.1016/j.jpowsour.2010.01.027. [DOI] [Google Scholar]
- Takasaki F.; Matsuie S.; Takabatake Y.; Noda Z.; Hayashi A.; Shiratori Y.; Ito K.; Sasaki K. Carbon-free Pt electrocatalysts supported on SnO2 for polymer electrolyte fuel cells: electrocatalytic activity and durability. J. Electrochem. Soc. 2011, 158, B1270–B1275. 10.1149/1.3625918. [DOI] [Google Scholar]
- Yan Z.; Wei W.; Xie J.; Meng S.; Lu X.; Zhu J. An ion exchange route to produce WO3 nanobars as Pt electrocatalyst promoter for oxygen reduction reaction. J. Power Sources 2013, 222, 218–224. 10.1016/j.jpowsour.2012.08.070. [DOI] [Google Scholar]
- Yan Z.; Xie J.; Jing J.; Zhang M.; Wei W.; Yin S. MoO2 nanocrystals down to 5 nm as Pt electrocatalyst promoter for stable oxygen reduction reaction. Int. J. Hydrogen Energy 2012, 37, 15948–15955. 10.1016/j.ijhydene.2012.08.033. [DOI] [Google Scholar]
- Sasaki K.; Zhang L.; Adzic R. R. Niobium oxide-supported platinum ultra-low amount electrocatalysts for oxygen reduction. Phys. Chem. Chem. Phys. 2008, 10, 159–167. 10.1039/B709893F. [DOI] [PubMed] [Google Scholar]
- Chauhan S.; Mori T.; Kobayashi T.; Yamamoto S.; Ito S.; Auchterlonie G.; Wepf R.; Ueda S.; Ye F. Surface layer of Pt-O-Ce bonds on CeOx nanowire with high ORR activity converted by proton beam irradiation. J. Am. Ceram. Soc. 2021, 104, 1945–1952. 10.1111/jace.17618. [DOI] [Google Scholar]
- Belloni J.; Mostafavi M.; Remita H.; Marignier J. L.; Delcourt M. O. Radiation-induced synthesis of mono- and multi-metallic clusters and nanocolloids. New J. Chem. 1998, 22, 1239–1255. 10.1039/a801445k. [DOI] [Google Scholar]
- Gachard E.; Remita H.; Khatouri J.; Keita B.; Nadjo L.; Belloni J. Radiation-induced and chemical formation of gold clusters. New J. Chem. 1998, 22, 1257–1265. 10.1039/a804445g. [DOI] [Google Scholar]
- Belapurkar A. D.; Kapoor S.; Kulshreshtha S. K.; Mittal J. P. Radiolytic preparation and catalytic properties of platinum nanoparticles. Res. Bull. 2001, 36, 145–151. 10.1016/S0025-5408(01)00499-8. [DOI] [Google Scholar]
- Belloni J. Nucleation, growth and properties of nanoclusters studied by radiation chemistry: Application to catalysis. Cat. Today 2006, 113, 141–156. 10.1016/j.cattod.2005.11.082. [DOI] [Google Scholar]
- Kageyama S.; Sugano Y.; Hamaguchi Y.; Kugai J.; Ohkubo Y.; Seino S.; Nakagawa T.; Ichikawa S.; Yamamoto T. A. Pt/TiO2 composite nanoparticles synthesized by electron beam irradiation for preferential CO oxidation. Mater. Res. Bull. 2013, 48, 1347–1351. 10.1016/j.materresbull.2012.11.028. [DOI] [Google Scholar]
- Kugai J.; Moriya T.; Seino S.; Nakagawa T.; Ohkubo Y.; Ueno K.; Nitani H.; Yamamoto T. Structure of bicomponent metal–oxide composites synthesized by electron beam irradiation method. J. Alloys Compd. 2013, 577, 125–130. 10.1016/j.jallcom.2013.04.135. [DOI] [Google Scholar]
- Perdew J. P.; Burke K.; Ernzerhof M. Generalized gradient approximation made simple. Phys. Rev. Lett. 1996, 77, 3865–3868. 10.1103/PhysRevLett.77.3865. [DOI] [PubMed] [Google Scholar]
- Torrent M.; Jollet F.; Bottin F.; Zérah G.; Gonze X. Implementation of the projector augmented-wave method in the ABINIT code: Application to the study of iron under pressure. Comput. Mater. Sci. 2008, 42, 337–351. 10.1016/j.commatsci.2007.07.020. [DOI] [Google Scholar]
- Jollet F.; Torrent M.; Holzwarth N. Generation of Projector Augmented-Wave atomic data: A 71 element validated table in the XML format. Comput. Phys. Commun. 2014, 185, 1246–1254. 10.1016/j.cpc.2013.12.023. [DOI] [Google Scholar]
- Amadon B.; Lechermann F.; Georges A.; Jollet F.; Wehling T. O.; Lichtenstein A. I. Plane-wave based electronic structure calculations for correlated materials using dynamical mean-field theory and projected local orbitals. Phys. Rev. B 2008, 77, 205112. 10.1103/PhysRevB.77.205112. [DOI] [Google Scholar]
- New Energy and Industrial Technology Development Organization (NEDO) PEFC evaluation project, cell evaluation and analysis protocol guideline (electrocatalyst, support, membrane and MEA), edited by Daido University, Ritsumeikan University, Tokyo Institute of Technology, and Japan Automobile Research Institute, January 30th, 2014, pp. 12 and 15. [Google Scholar]
- Skorodumova N. V.; Baudin M.; Hermansson K. Surface properties of CeO2 from first principles. Phys. Rev. B 2004, 69, 075401 10.1103/PhysRevB.69.075401. [DOI] [Google Scholar]
- Tasker P. W. The structure and properties of fluorite crystal surfaces. J. Phys. Colloques 1980, 41, C6-488–C6-491. 10.1051/jphyscol:19806127. [DOI] [Google Scholar]
- Baudin M.; Wójcik M.; Hermansson K. Dynamics, structure and energetics of the (111), (011) and (001) surfaces of ceria. Surf. Sci. 2000, 468, 51–61. 10.1016/S0039-6028(00)00766-4. [DOI] [Google Scholar]
- Gennard S.; Cora F.; Richard C.; Catlow A. Comparison of the bulk and surface properties of ceria and zirconia by ab Initio investigations. J. Phys. Chem. B 1999, 103, 10158–10170. 10.1021/jp9913923. [DOI] [Google Scholar]
- Vyas S.; Grimes R. W.; Gay D. H.; Rohl A. L. Structure, stability and morphology of stoichiometric ceria crystallites. J. Chem. Soc., Faraday Trans. 1998, 94, 427–434. 10.1039/a707052g. [DOI] [Google Scholar]
- Conesa J. C. Computer modeling of surfaces and defects on cerium dioxide. Surf. Sci. 1995, 339, 337–352. 10.1016/0039-6028(95)00595-1. [DOI] [Google Scholar]
- Plata J. J.; Remesal E. R.; Graciani J.; Márquez A. M.; Rodríguez J. A.; Sanz J. F. Understanding the Photocatalytic Properties of Pt/CeOx/TiO2: Structural Effects on Electronic and Optical Properties. ChemPhysChem 2019, 20, 1624–1629. 10.1002/cphc.201900141. [DOI] [PubMed] [Google Scholar]
- Nörenberg H.; Briggs G. A. D. Defect Structure of Nonstoichiometric CeO2 (111) Surfaces Studied by Scanning Tunneling Microscopy. Phys. Rev. Lett. 1997, 79, 4222–4225. 10.1103/PhysRevLett.79.4222. [DOI] [Google Scholar]
- Nörenberg H.; Briggs G. A. D. Defect formation on CeO2 (111) surfaces after annealing studied by STM. Surf. Sci. 1999, 424, L352–L355. 10.1016/S0039-6028(99)00212-5. [DOI] [Google Scholar]
- Namai Y.; Fujui K.; Iwasawa Y. Atom-resolved noncontact atomic force microscopic observations of CeO2(111) surfaces with different oxidation states: surface structure and behavior of surface oxygen atoms. J. Phys. Chem. B 2003, 107, 11666–11673. 10.1021/jp030142q. [DOI] [Google Scholar]
- Namai Y.; Fukui K.-I.; Iwasawa Y. Atom-resolved noncontact atomic force microscopic and scanning tunneling microscopic observations of the structure and dynamic behavior of CeO2 (111) surfaces. Catal. Today 2003, 85, 79–91. 10.1016/S0920-5861(03)00377-8. [DOI] [Google Scholar]
- Esch F.; Fabris S.; Zhou L.; Montini T.; Africh C.; Fornasiero P.; Comelli G.; Rosei R. Electron localization determines defect formation on ceria substrates. Science 2005, 309, 752–755. 10.1126/science.1111568. [DOI] [PubMed] [Google Scholar]
- Torbrügge S.; Reichling M.; Ishiyama A.; Morita S.; Custance Ó. Evidence of subsurface oxygen vacancy ordering on reduced CeO2 (111). Phys. Rev. Lett. 2007, 99, 056101 10.1103/PhysRevLett.99.056101. [DOI] [PubMed] [Google Scholar]
- Ma J.; Ye F.; Ou D. R.; Li L.; Mori T. Structures of defect clusters on ceria (111) surface. J. Phys. Chem. C 2012, 116, 25777–25782. 10.1021/jp306699r. [DOI] [Google Scholar]
Associated Data
This section collects any data citations, data availability statements, or supplementary materials included in this article.