



Abstract

The need to find a rapid and worthwhile technique for the in situ detection of the content of delta-9-tetrahydrocannabinol (THC) and cannabidiol (CBD) in Cannabis sativa L. is an ever-increasing problem in the forensic field. Among all the techniques for the detection of cannabinoids, Raman spectroscopy can be identified as the most cost-effective, fast, noninvasive, and nondestructive. In this study, 42 different samples were analyzed using Raman spectroscopy with 1064 nm excitation wavelength. The use of an IR wavelength laser showed the possibility to clearly identify THC and CBD in fresh samples, without any further processing, knocking out the contribution of the fluorescence generated by visible and near-IR sources. The results allow assigning all the Raman features in THC- and CBD-rich natural samples. The multivariate analysis underlines the high reproducibility of the spectra and the possibility to distinguish immediately the Raman spectra of the two cannabinoid species. Furthermore, the ratio between the Raman bands at 1295/1440 and 1623/1663 cm–1 is identified as an immediate test parameter to evaluate the THC content in the samples.
Introduction
Cannabis sativa L. is known for being a class of plants with a wide variety of derived products from food and textile fiber to psychotropic substances.1−3
In the 60s, cannabinoids have been classified as the main biological active components of the Cannabis plants.
In the past, the term cannabinoids referred to a group of compounds with a typical C21 structure present in C. sativa. The modern definition, with greater emphasis on chemistry and pharmacology, includes instead all those molecular structures that interact with cannabinoid receptors.4 This new classification has created numerous subcategories that take into account the origin of the compound and its synthetic or natural origin. In the common nomenclature, the term “phytocannabinoid” is used for natural plant compounds, with the term “endocannabinoids” used for the endogenous ligands of cannabinoid receptors. The synthetic agonists of these receptors have been classified according to their degree of pharmacological proximity with phytocannabinoids, which are divided into “classic” vs “nonclassic”.5,6
Over 60 cannabinoids are present in Cannabis, most of which belong to the subclasses of the cannabigerol (CBG), cannabichromene (CBC), cannabidiol (CBD), and delta-9-tetrahydrocannabinol (Δ9-THC) types.4,7−9
While THC is a psychoactive and often illicit drug, CBD and CBG are legal substances that have a variety of pharmacological properties such as reducing chronic pain, inflammation, anxiety, and depression. All the cannabinoids are biosynthesized from the cannabigerolic acid that is present in the plants in a range of concentrations of 25–35% w/w, Scheme 1.
Scheme 1. Subclasses of Cannabinoids Mainly Present in Cannabis Plants.

The amount of the ratio of THC/CBD divides Cannabis plants into three chemotypes. A ratio bigger than 1 is a characteristic of drug plants (chemotype I), while a ratio near 1 or smaller is a characteristic of chemotypes II and III of intermediate-type plants and fiber-type plants, respectively.
Over the past decade, substantial efforts have been made to develop Cannabis strains capable of producing large quantities of CBD and CBG. Ideally, these plant varieties should produce a very limited amount of THC, and usually, it must be below 0.3%. This threshold is applied by different European states and USA to distinguish between legal and illicit hemp/Cannabis.10,11
The consumption of psychoactive substances is continuously increasing, and the European Monitoring Centre for Drugs and Drug Addiction (EMCDDA) reports a 25% increase, in the last 25 years, of the illicit market.12 For this reason, it is essential to explore fast and valuable ways of identifying these psychoactive substances.13−17
Different techniques are used to determine the amount of cannabinoids in Cannabis: high-performance liquid chromatography (HPLC) and gas chromatography (GC) combined with both a flame ionization detector (FID) and mass spectrometer (MS).18−21
The analysis using these techniques involves a pretreatment of the samples. Most of the time, extraction methods are used, and the choice of the extraction method depends on the nature of the starting material. In addition to traditional methods such as maceration, distillation, or boiling, many other modern extraction methods and techniques can be applied for the extraction of natural cannabinoids. These methods include Soxhlet, accelerated solvent extraction, pressurized liquid extraction (PLE), microwave-assisted extraction (MAE), ultrasonic-assisted extraction (UAE), supercritical fluid extraction (SFE), solid-phase extraction (SPE), and solid-phase microextraction (MSPE).22−26 It is worthy of importance that all the aforementioned methods are not portable and destructive and often require long processing times.
Raman spectroscopy can be selected as a valuable and cost-effective technique for the detection of cannabinoids. In the literature, few attempts have been made to introduce Raman spectroscopy for the identification and quantification of phytocannabinoids.13,27,28 The use of such a technique is often hampered by the high fluorescence generated by the excitation wavelength that overlaps the Raman signal.
Recently, Sanchez et al.29 proposed the use of NIR–Raman spectroscopy (RS) for confirmatory, noninvasive, and nondestructive differentiation between hemp and Cannabis. They showed the results obtained using an 830 nm lasers source, 10s acquisition time, and 495 mW power for the analysis of the extracted oil from different types of Cannabis. This method requires pretreatment of the samples, which includes an extraction procedure using organic solvents and requires the use of a high-power laser for the Raman measurements.
Herein, we present that using 1064 nm Raman spectroscopy, it is possible to detect the cannabinoids focalizing the measurement in the glandular trichomes of the plant that appear as reddish circular bubbles in the inflorescence. The investigated samples, coming from the Scientific group of Scientific Investigation Department (RIS) of Cagliari (Italy), were analyzed without a previous treatment. Each sample was observed using an optical microscope, and the spectra were acquired at several points to verify the homogeneity. The multivariate analysis was applied to verify the reproducibility of the spectra and to prove the possibility to rapidly distinguish the Raman spectra of THC and CBD.
Experimental Section
Materials
Cannabis samples have been provided by the Scientific Investigation Department (RIS) of Cagliari.
A set of 42 samples with different amounts of THC and CBD was studied. The samples come from different plantations seized from the Scientific Investigation Department (RIS) of Cagliari for the investigation of the content of cannabinoids.
GC-FID analysis has been performed at the Scientific Investigation Department. For the analysis, a methanolic solution of each sample has been prepared, and androsterone (purchased from Sigma-Aldrich) has been used as an internal standard.
For the Raman measurements, performed at the Physics department of the University of Cagliari, all the samples have been analyzed without a previous treatment, and the spectra were collected from the leaves and inflorescences. Different regions (glandular trichome-rich, inflorescence, leaves, and stems) has been distinguished using a microscope (objective 20×). For each sample, at least eight different points were analyzed, and the average of them was considered as a representative.
Characterization Techniques
For GC-FID analysis, an Agilent Technologies 7890 series gas chromatograph (GC) was employed, equipped with a split injector and an ULTRA 2 fused silica column: 5% phenyl-methylpolysiloxane, 20 m × 0.32 mm i.d., film thickness of 0.52 μm. The analysis has been performed under isothermal conditions at 240 °C for 16 min. The injector was maintained at 290 °C. Helium was the carrier gas at 1.4 mL/min; the sample (1 μL) was injected in the split mode (1:50). The GC was fitted with a FID, model 7890B. FID conditions were set as follows: temperature was 300 °C; hydrogen was the carrier gas at 40 mL/min; and nitrogen was the makeup gas at 25 mL/min.
Raman spectra were acquired in the back scattering geometry with excitation wavelength at 1064 nm generated using a Nd:YAG laser, to avoid luminescence contribution in the visible range. The system operates in the Stokes region up to 2500 cm–1. Measurements were performed in air at room temperature with a BWTEK i-Raman ex spectrometer with a spectral resolution of 9 cm–1.
Samples of air-dried C. sativa L. bracteal leaves from inflorescences of both legal and illegal chemotypes were observed by optical microscopy to better interpret Raman microscopy results. A stereomicroscope equipped with the HD cam TiEsseLab TrueChrome HD IIS (Tiesselab, Italy) and software TiEsseLab IS CAPTURE Rel. 3.6.7 (Tiesselab, Italy) was used to take measurements on the structures of interest and to capture the related images. A compound microscope was also used to observe in the bright field and magnify up to 400× the structures of interest.
Multivariate analysis was used for the statistical study of the collected data. All the collected spectra were analyzed in a range that includes wavenumbers from 655 to 1800 cm–1, and then, the data were normalized from 0 to 1 for the direct comparison.
Results and Discussion
The Raman spectrum of a natural plant is often very difficult to acquire due to the high fluorescence generated by chlorophyll B and carotenoids. Figure 1 reports the spectrum obtained by exciting the Cannabis using a near-infrared laser (785 nm). A very broad luminescence overlaps the part of the spectrum that contains the Raman signal, obstructing clear information about the presence of cannabinoid species. On the other hands, the use of a 1064 nm laser as an excitation source allows collecting very clear spectra and underlining the difference in terms of vibrational modes of the two cannabinoids.
Figure 1.

Raman spectrum of fresh inflorescence with 785 nm excitation wavelength.
Figure 2 shows the experimental Raman spectra, collected using 1064 nm laser excitation, of CBD (red)- and THC (blue)-rich plants. The quantitative analysis for both CBD and THC in the samples was obtained by GC-FID measurements (see the Supporting Information) using androstane as an internal standard. The exact composition is reported in Figure 2 and in Table 1 (sample 6 and sample 26). The spectra were collected without a previous treatment of the sample, directly on the inflorescence, overcoming the extraction procedure from the plants and/or post-processing of the experimental data.
Figure 2.

Raman spectra of CBD- and THC-rich plants, collected using 1064 nm laser excitation (sample 6 and sample 26, respectively in Table 1).
Table 1. GC-FID Results of the Analyzed Samples with the Corresponding Amounts of THC and CBD.
| sample | % THC | % CBD |
|---|---|---|
| 1 | 1.60% | 0.30% |
| 2 | 1.90% | 0.27% |
| 3 | 6.90% | 0.30% |
| 4 | 7.78% | 0.25% |
| 5 | 10.49% | 0.29% |
| 6 | 7.41% | 0.21% |
| 7 | 6.42% | 0.24% |
| 8 | 6.42% | 0.24% |
| 9 | 8.42% | 0.27% |
| 10 | 6.23% | 0.26% |
| 11 | 8.61% | 0.22% |
| 12 | 5.80% | 0.21% |
| 13 | 4.14% | 0.21% |
| 14 | 3.61% | 0.29% |
| 15 | 2.02% | 0.09% |
| 16 | 4.34% | 0.13% |
| 17 | 3.68% | 0.17% |
| 18 | 4.12% | 0.13% |
| 19 | 3.01% | 0.11% |
| 20 | 3.35% | 0.11% |
| 21 | 3.56% | 0.10% |
| 22 | 5.11% | 0.18% |
| 23 | 4.15% | 0.15% |
| 24 | 3.20% | 0.17% |
| 25 | 7.49% | 0.24% |
| 26 | 0.45% | 10.80% |
| 27 | 0.45% | 10.80% |
| 28 | 0.26% | 5.22% |
| 29 | 0.29% | 5.48% |
| 30 | 0.19% | 3.53% |
| 31 | 0.33% | 6.26% |
| 32 | 0.33% | 6.53% |
| 33 | 0.23% | 4.54% |
| 34 | 2.87 | 5.69 |
| 35 | 0.55 | 6.49 |
| 36 | 0.60 | 8.61 |
| 37 | 1.28 | 13.80 |
| 38 | 1.58 | 14.07 |
| 39 | 0.99 | 10.89 |
| 40 | 1.45 | 12.46 |
| 41 | 1.30 | 10.62 |
| 42 | 0.90 | 9.51 |
Both the samples present several vibrational bands between 780 and 1600 cm–1 due to the similarity in terms of the chemical structure of THC and CBD (Scheme 1). However, most of the peaks present very similar spectral shifts but with substantial differences from a more accurate analysis.
The main vibrational bands of the THC-rich plant are observed at 775, 780, 835, 1185, 1295, 1321, 1365, 1570, 1600, 1623, and 1666 cm–1, while in CBD-rich plants, vibrational bands at 775, 865, 985, 1012, 1080, 1104, 1302, 1340, 1370, 1437, 1643, and 1663 cm–1 were observed.29,30 The assignment of these bands is reported in Table S1 (Supporting Information).
The Raman spectrum of the THC-rich plant exhibits a prominent vibrational band at 1295 cm–1, which in the spectrum of the CBD-rich plant is not well-pronounced. In addition THC shows a peak located at 1185 cm–1 not observed in CBD.29 A substantial difference is also observed in the region of the aromatic vibrations, where a vibrational band located at 1623 cm–1 is representative only of the THC-rich plant, while a very intense vibrational band at 1440 cm–1 reflects the presence of a high amount of CBD in the sample.
The structures with the Raman information on the cannabinoid’s composition appeared as densely colored circles of sub-millimetric dimensions. Optical microscopy allowed us to identify said structures as glandular trichomes densely covering the observed bracteal leaves in both legal and illegal chemotypes. (Figure 3 and SI) The observed samples presented glandular and simple trichomes, the former producing the substances observed by the Raman microscopy approach. Optical microscopy alone was not able to discriminate legal and illegal chemotypes in the observed samples.32
Figure 3.

Optical microscopy images of CBD- and THC-rich plants.
Glandular trichomes are a widespread structure in the plant kingdom performing a variety of tasks in plants (e.g.,, resistance to abiotic stressors, protection against herbivory, and defense against pathogens). The morphology of these structures could vary a lot among different species and within the same species/individuals too. Cannabis sativa L. is featured by the presence of stalked glandular trichomes producing and storing the substances (mainly secondary metabolites and terpenes) of economic and legal interest (Figure 4).33−36 It is worth noting that the spectra are not uniform in all the parts of the plant. Different regions can be easily distinguished by means of the objective of the microscope (20×). The Raman features reported and discussed in the previous section come from the glandular trichome-rich parts of the inflorescence (e.g., bracteal leaves, inflorescence axis, etc.), while the Raman spectra obtained from the other parts of the plants (leaves and stems) (Figure 4) do not give deep information. The main features at 1155 and 1525 cm–1 are related to cellulose and carotenoids, respectively, while no clear bands from cannabinoids are detected regardless of the cannabinoid species.31
Figure 4.

Raman spectrum of leaves collected using 1064 nm laser excitation.
In this work, 42 different plants were analyzed using Raman spectroscopy, and GC-FID spectroscopy was used to confirm the results. From each plant, at least four different points were analyzed, and the average of them was considered as a representative. Then, the samples were divided in two families: THC-rich samples (in blue in Table 1) and CBD-rich samples (in red in Table 1). The multivariate analysis was performed separately for each group. The spectra were normalized and then truncated to include wavenumbers in the range of 655–1800 cm–1 and scaled to unit variance via standard normal variate correction to give all spectral regions equal importance.
In this analysis, the principal component allows us to examine the relationship of the data. Each principal component represents the linear combination of the variables and gives a maximized variance. In this case, the variables to be considered are the maximum and minimum points of the spectrum or, in other words, the spectra themselves. It follows that the main components of the multivariate analysis represent the spectrum “common” to the various samples, and the coefficients represent how similar the spectra obtained from the various samples are.
The principal component has a variance of approximately 84%, and the second component has a variance of approximately 10% (eigenvalues of 7.83 and 1.17, respectively).
Figures 5 and 6 show the principal components of each family (THC- and CBD-rich, respectively) compared with the single spectrum from the fresh plants. The similarity between the principal component and the spectrum acquired in the plant underlines the high reproducibility of the experimental data and the possibility to perform the analysis without the use of statistical treatment of the acquired spectra.
Figure 5.

Principal component for the THC-rich plants compared with a single spectrum of a plant of the same family.
Figure 6.

Principal component for the CBD-rich plants compared with a single spectrum of a plant of the same family.
The deeper analysis of the spectra could give some analytical parameters for the evaluation of the cannabinoid content. The main peaks of the two groups are related to the C-C-H bending vibration of the aliphatic chain of the THC at 1295 cm–1 and the CH2 vibration at 1440 cm–1 for the CBD-rich sample.37 It is worth analyzing the ratio between the peak at 1295 cm–1 and the peak at 1440 cm–1. Second, the ratio between the peak at 1623 cm–1 and the one at 1663 cm–1 can give important insights into the presence of the two cannabinoids. (Figures 7 and 8)
Figure 7.
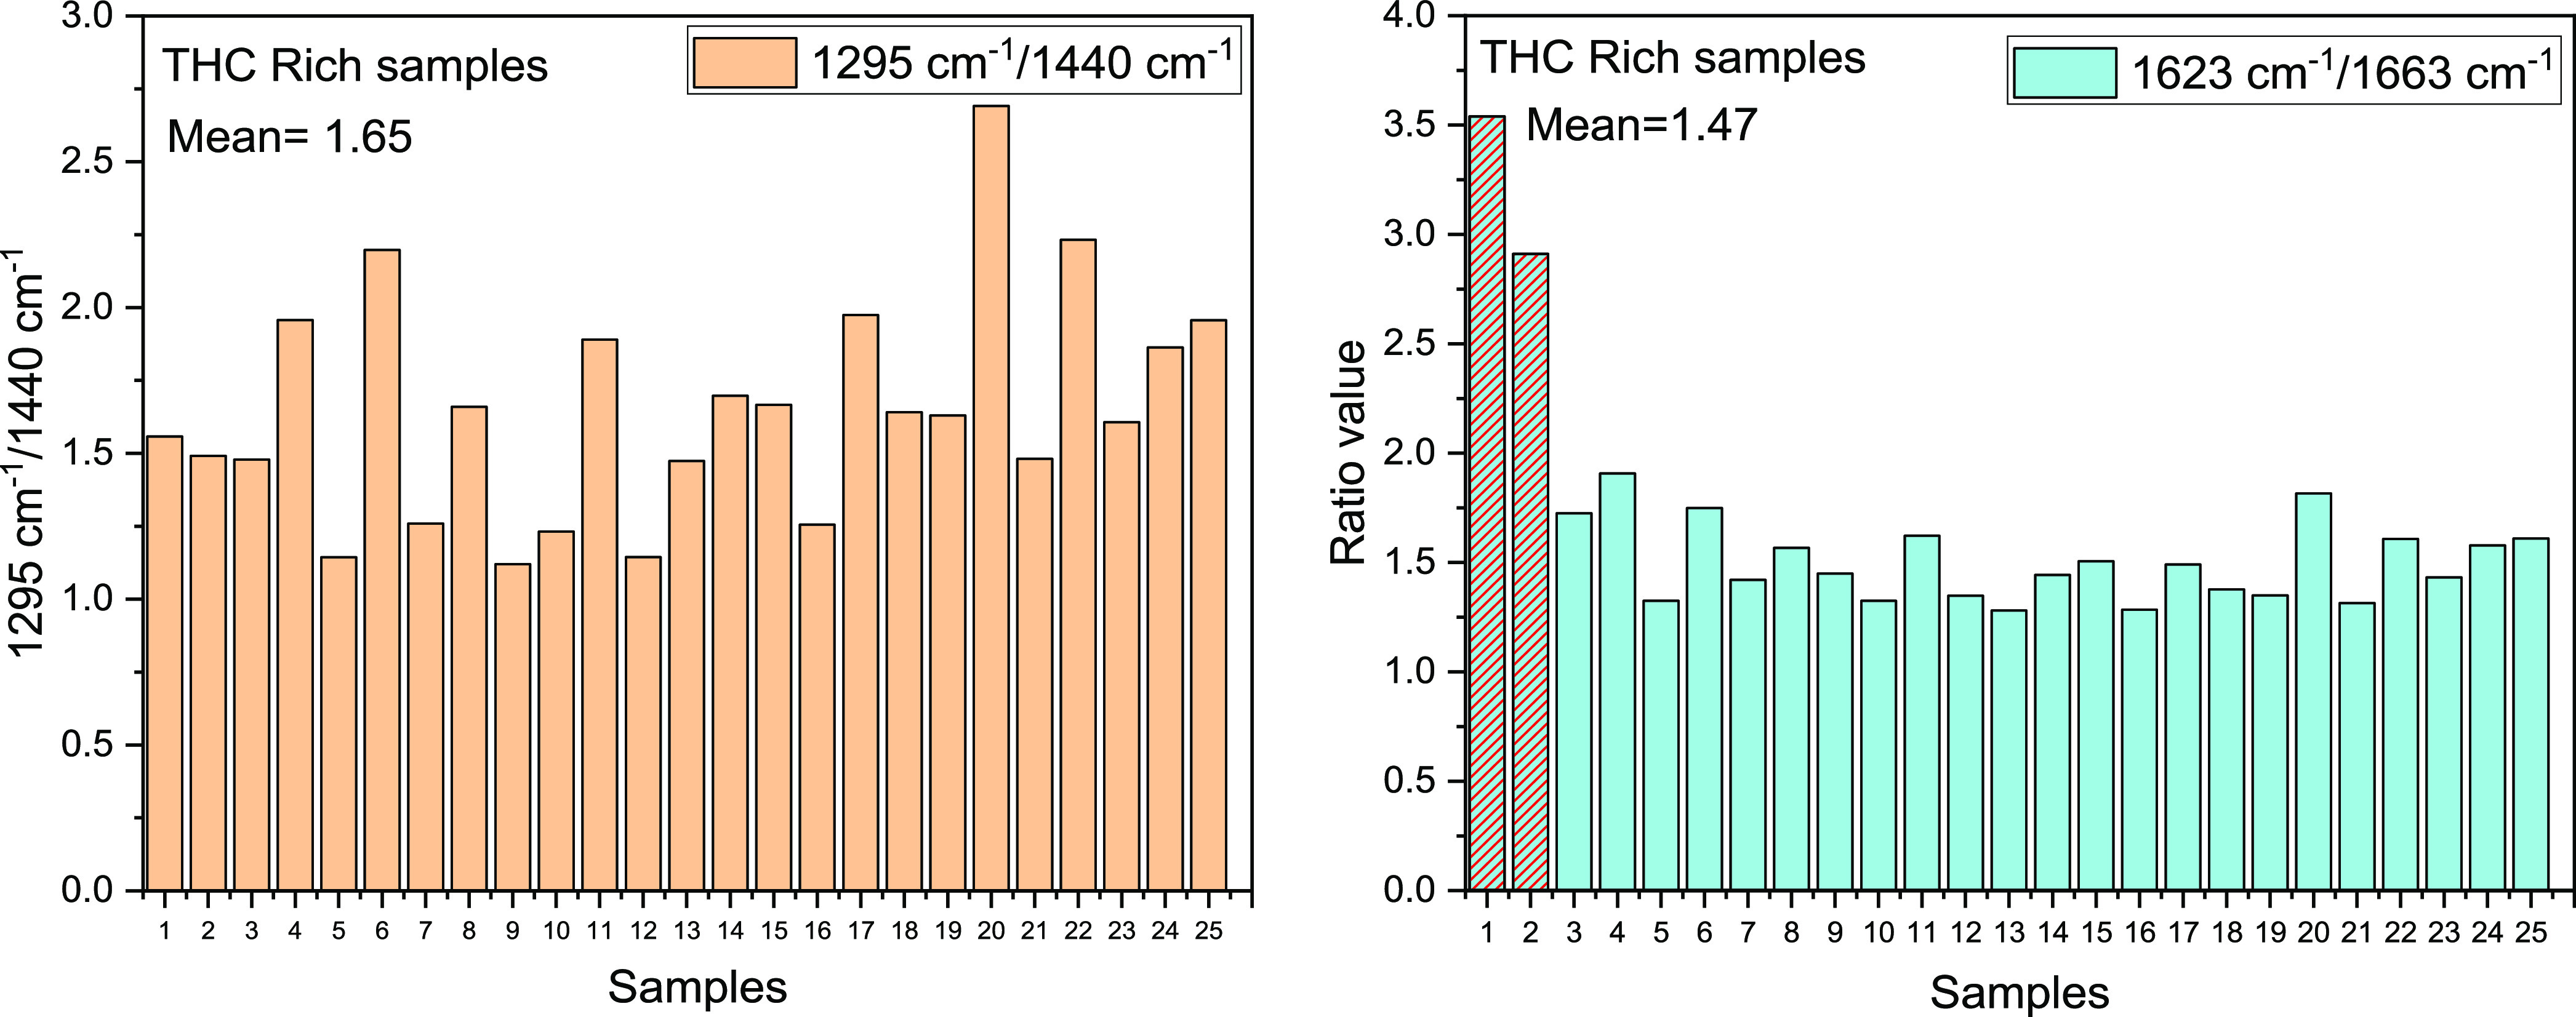
Mean of the ratio between 1295/1440 and 1623/1663 cm–1 peaks for the THC-rich samples.
Figure 8.
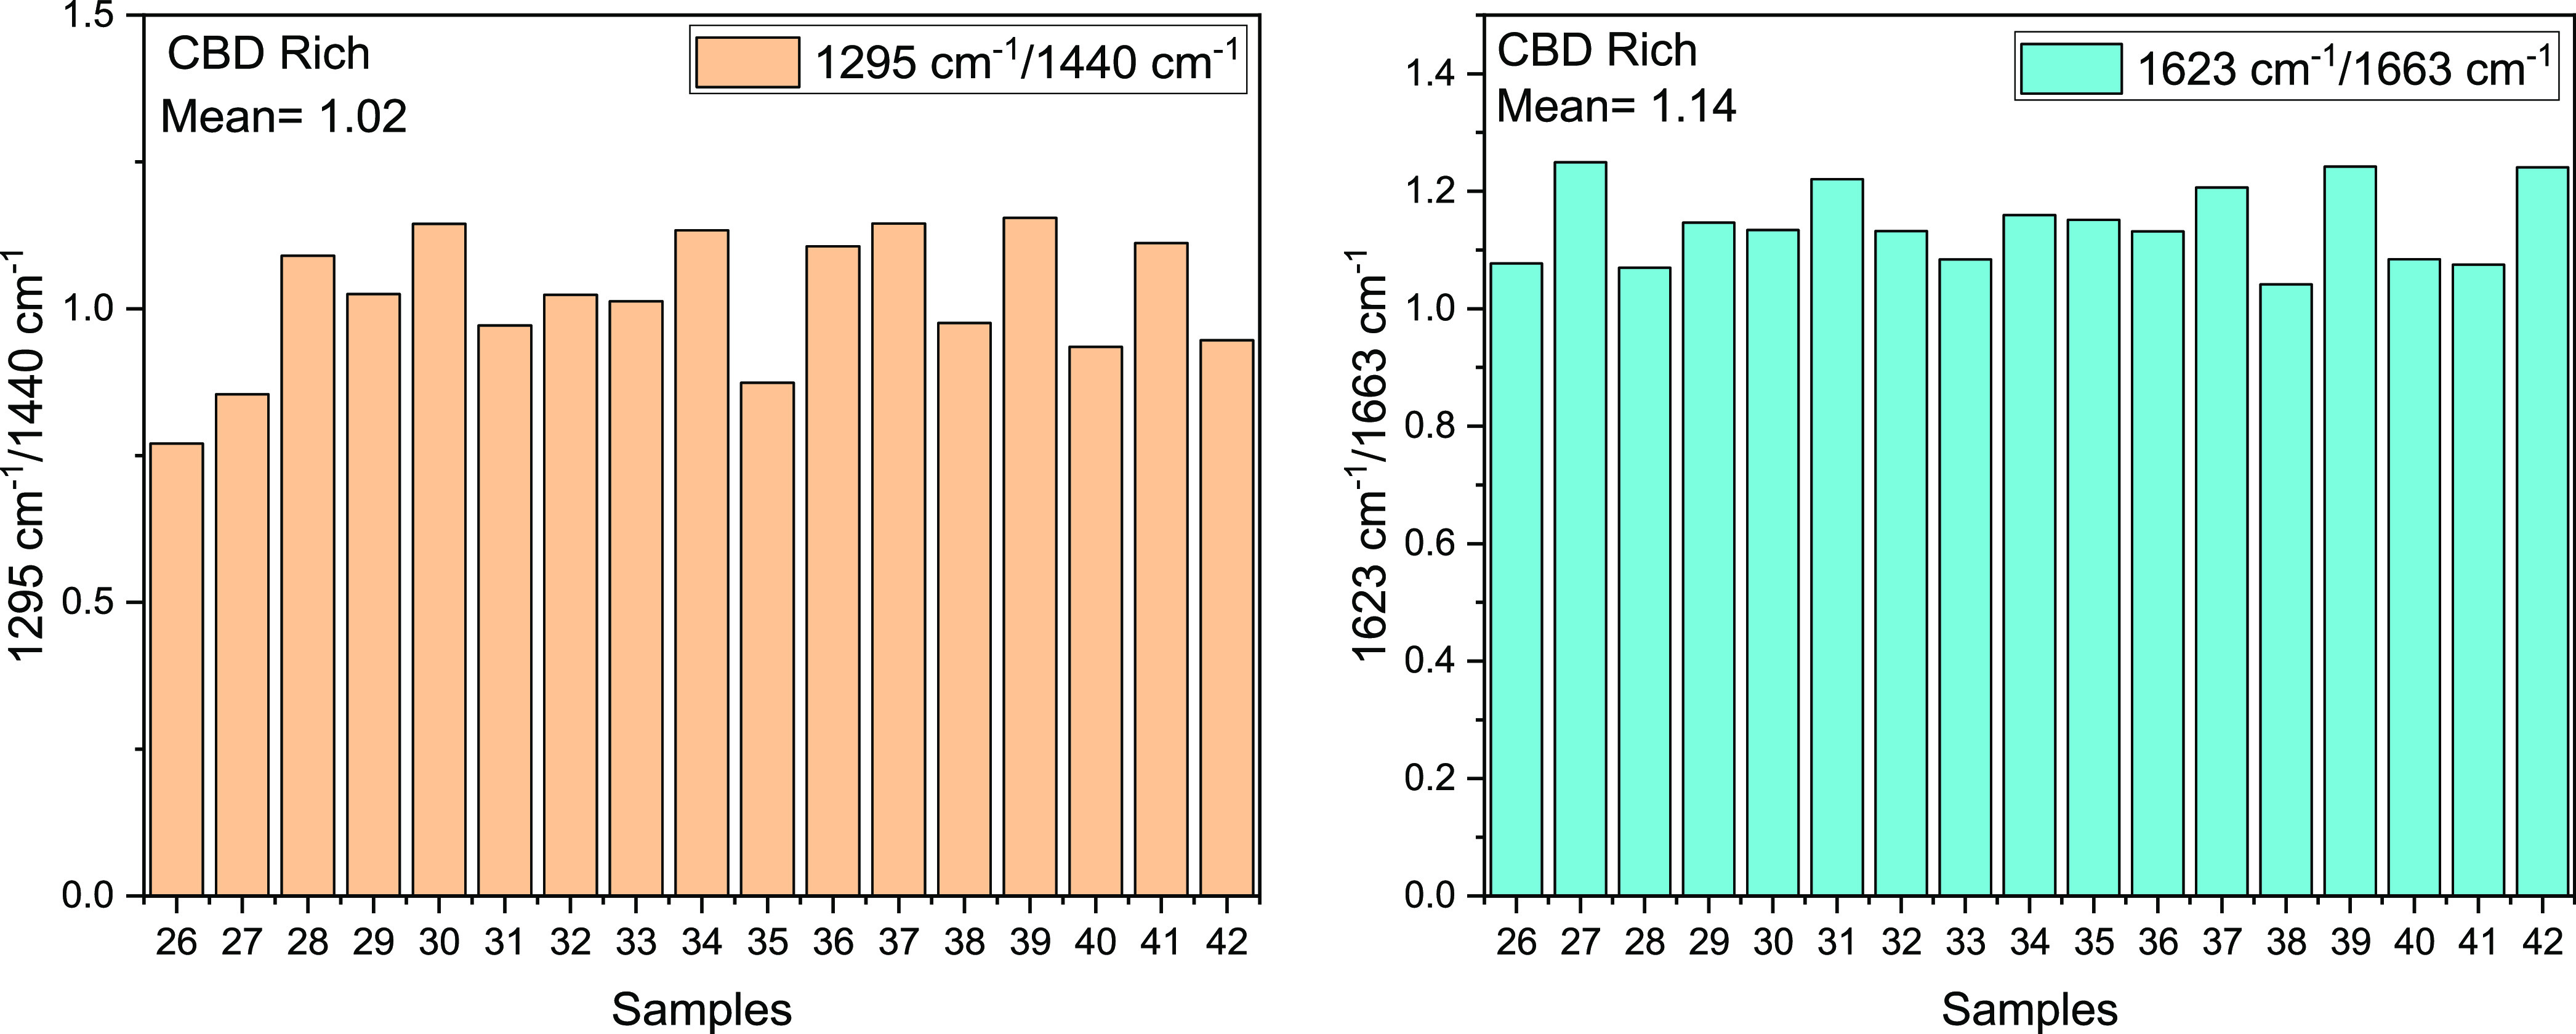
Mean of the ratio between 1295/1440 and 1623/1663 cm–1 peaks for the CBD-rich samples.
The analysis showed a clear distinction in the two families, THC-rich samples showing always higher ratio values as compared to the ones of CBD-rich samples, with mean values considerably higher (1.65 and 1.47, for the THC-rich samples and 1.02 and 1.14 in the CBD-rich plants).
The analytical treatment of the experimental data points out the anomalous behavior of the Raman spectra of samples 1 and 2 with respect to all the other peaks and more in particular with sample 15. These samples have a close content of THC, but the ratio between the aromatic chain vibrations at 1623 and 1663 cm–1 is relatively higher than that of all the other samples. However, it is important to underline that the samples 1 and 2 are mixed ground dry samples, and the variation in the ratio is connected to the abrupt decrease of the peak at 1663 cm–1, assigned to the vibration of the carboxylic group of the THCA.38 We argue that this variation is connected to the conversion of the THCA to THC (see Scheme 1) generated by the temperature increase. On the other hand, sample 15 (coming from fresh inflorescence) still presents the THCA contribution (Figure 9).
Figure 9.

Comparison of Raman spectra of ground mixed sample and fresh inflorescence.
Furthermore, the dry samples present a lower relative contribution of the band at 1295 cm–1, related to the fragmentation of the aliphatic chains and damages due to the mechanic process.
We propose that, due to shredding, the fragile glandular trichome heads are broken, and their content sticks out, and consequently, it is subjected to a series of chemical and physical environmental stress factors (light radiation, atmospheric oxygen, temperature variation) that lead it to degrade compared to that contained in the “protected” environment of the intact trichome heads of the fresh samples (Figure 9).
More specific analysis on the external effect on cannabinoids is mandatory to confirm the hypothesis and to produce new evidence on the Raman spectra.
Conclusions
The Raman spectra of two different families of Cannabis, THC- and CBD-rich, have been acquired, and all the main Raman modes were assigned. The spectra were acquired on 42 natural samples with excitation wavelength at 1064 cm–1. Furthermore, with respect to previous studies, we demonstrate the possibility to quickly distinguish the spectra between the two cannabinoids without any data processing, also thanks to the absence of natural fluorescence.
Multivariate analysis underlines the high reproducibility of the experimental data on natural samples, but it is shown that it was not necessary to distinguish the chemotype of the plants.
The analytical signatures of THC and CBD Raman spectra were identified in the ratio between the peaks at 1295 and 1440 cm–1 and between 1623 and 1663 cm–1, whereas higher values of the ratios have been clearly observed for the THC-rich samples.
Finally, a preliminary analysis on dry ground samples and fresh inflorescence evidences some interesting insights into the Raman spectra. The decrease of the peak at 1663 cm–1 in dry ground samples is related to the total conversion of THCA into THC (because of the grinding-induced temperature effect), while the relative decrease of the band at 1250 cm–1, assigned to aliphatic chain vibrations, is proposed to be related to the physical environmental stress generated by the grinding.
In summary, we proved the high potential of Raman spectroscopy in the IR region, where the absence of fluorescence permits us to acquire and analyze the experimental data directly on fresh plants. Therefore, Raman spectroscopy is indeed highly proposed as a fast and reliable tool for the identification of illegal items and/or for the evaluation of the cannabinoid content in fresh plants.
Supporting Information Available
The Supporting Information is available free of charge at https://pubs.acs.org/doi/10.1021/acs.analchem.2c01629.
GC-FID results for THC-rich samples and for CBD-rich samples; optical images obtained with optical microscopy of THC- and CBD-rich plants; and assignation of the Raman modes in THC- and CBD-rich plants (PDF)
The authors declare no competing financial interest.
Supplementary Material
References
- Kriese U.; Schumann E.; Weber W. E.; Beyer M.; Brühl L.; Matthäus B. Oil Content, Tocopherol Composition and Fatty Acid Patterns of the Seeds of 51 Cannabis Sativa L. Genotypes. Euphytica 2004, 137, 339–351. 10.1023/B:EUPH.0000040473.23941.76. [DOI] [Google Scholar]
- Satriani A.; Loperte A.; Pascucci S. The Cultivation of Industrial Hemp as Alternative Crop in a Less-Favoured Agricultural Area in Southern Italy: The Pignola Case Study. Pollutants 2021, 1, 169–180. 10.3390/pollutants1030014. [DOI] [Google Scholar]
- Jiang H. E.; Li X.; Zhao Y. X.; Ferguson D. K.; Hueber F.; Bera S.; Wang Y. F.; Zhao L. C.; Liu C. J.; Li C.; Sen A. New Insight into Cannabis Sativa (Cannabaceae) Utilization from 2500-Year-Old Yanghai Tombs, Xinjiang, China. J. Ethnopharmacol. 2006, 108, 414–422. 10.1016/j.jep.2006.05.034. [DOI] [PubMed] [Google Scholar]
- Andre C. M.; Hausman J. F.; Guerriero G. Cannabis Sativa: The Plant of the Thousand and One Molecules. Front. Plant Sci. 2016, 7, 1–17. 10.3389/fpls.2016.00019. [DOI] [PMC free article] [PubMed] [Google Scholar]
- Pertwee R. G. Emerging Strategies for Exploiting Cannabinoid Receptor Agonists as Medicines. Br. J. Pharmacol. 2009, 156, 397–411. 10.1111/j.1476-5381.2008.00048.x. [DOI] [PMC free article] [PubMed] [Google Scholar]
- Pertwee R. G. Cannabinoid Pharmacology: The First 66 Years. Br. J. Pharmacol. 2006, 147, S163–S171. 10.1038/sj.bjp.0706406. [DOI] [PMC free article] [PubMed] [Google Scholar]
- ElSohly M. A.; Slade D. Chemical Constituents of Marijuana: The Complex Mixture of Natural Cannabinoids. Life Sci. 2005, 78, 539–548. 10.1016/j.lfs.2005.09.011. [DOI] [PubMed] [Google Scholar]
- ElSohly M. A., Marijuana and the Cannabinoids, 1384; ISBN 9781588294562.
- Fischedick J. T.; Hazekamp A.; Erkelens T.; Choi Y. H.; Verpoorte R. Metabolic Fingerprinting of Cannabis Sativa L., Cannabinoids and Terpenoids for Chemotaxonomic and Drug Standardization Purposes. Phytochemistry 2010, 71, 2058–2073. 10.1016/j.phytochem.2010.10.001. [DOI] [PubMed] [Google Scholar]
- Mead A. Legal and Regulatory Issues Governing Cannabis and Cannabis-Derived Products in the United States. Front. Plant Sci. 2019, 10, 697. 10.3389/fpls.2019.00697. [DOI] [PMC free article] [PubMed] [Google Scholar]
- Clarke R. C.; Merlin M. D.; FISHER J.; Grigorenko N. V.; Kuddus M.; Ginawi I. A. M.; Al-Hazimi A.; Mark Liechty.; Long T.; Wagner M.; Demske D.; Leipe C.; Tarasov P. E.; Russo E. B.; Satyal P.; Setzer W. N.; All U. T. C.; Winfield I. J.; Vergara D.; Baker H.; Clancy K.; Keepers K. G.; Mendieta J. P.; Pauli C. S.; Tittes S. B.; White K. H.; Kane N. C.; Wang I. J.; Brenner J. C.; Butsic V.; Warf B.; Bonini S. A.; Premoli M.; Tambaro S.; Kumar A.; Maccarinelli G.; Memo M.; Mastinu A.; Rokaya M. B.; Maršík P.; Münzbergová Z.; Journal P. R. A Practical and Natural Taxonomy for Cannabis Author (s): Ernest Small and Arthur Cronquist Published by: Wiley Stable URL: Https://Www.Jstor.Org/Stable/1220524. CRC. Crit. Rev. Plant Sci. 1976, 25, 83–90. [Google Scholar]
- Heroin M.; New C.; Amphetamines C.. European Monitoring Centre for Drugs and Drug Addiction (2021) European Drug Report 2021: Trends and Developments. Https://Www.Rte.Ie/Documents/News/2021/06/European-Drug-Report-2021.Pdf ( (18 June 2021), ), 2021.
- Classification of Various Marijuana Varieties by Raman Microscopy and Chemometrics _ Enhanced Reader.Pdf. [DOI] [PMC free article] [PubMed]
- Guirguis A.; Girotto S.; Berti B.; Stair J. L. Identification of New Psychoactive Substances (NPS) Using Handheld Raman Spectroscopy Employing Both 785 and 1064 Nm Laser Sources. Forensic Sci. Int. 2017, 273, 113–123. 10.1016/j.forsciint.2017.01.027. [DOI] [PubMed] [Google Scholar]
- Rojkiewicz M.; Kuś P.; Kusz J.; Książek M. Spectroscopic and Crystallographic Characterization of Two Cathinone Derivatives: 1-(4-Fluorophenyl)-2-(Methylamino)Pentan-1-One (4-FPD) Hydrochloride and 1-(4-Methylphenyl)-2-(Ethylamino)Pentan-1-One (4-MEAP) Hydrochloride. Forensic Toxicol. 2018, 36, 141–150. 10.1007/s11419-017-0393-6. [DOI] [PMC free article] [PubMed] [Google Scholar]
- Zawilska J. B.; Andrzejczak D. Next Generation of Novel Psychoactive Substances on the Horizon - A Complex Problem to Face. Drug Alcohol Depend. 2015, 157, 1–17. 10.1016/j.drugalcdep.2015.09.030. [DOI] [PubMed] [Google Scholar]
- Zloh M.; Samaras E. G.; Calvo-Castro J.; Guirguis A.; Stair J. L.; Kirton S. B. Drowning in Diversity? A Systematic Way of Clustering and Selecting a Representative Set of New Psychoactive Substances. RSC Adv. 2017, 7, 53181–53191. 10.1039/c7ra09066h. [DOI] [Google Scholar]
- Burnier C.; Esseiva P.; Roussel C. Quantification of THC in Cannabis Plants by Fast-HPLC-DAD: A Promising Method for Routine Analyses. Talanta 2019, 192, 135–141. 10.1016/j.talanta.2018.09.012. [DOI] [PubMed] [Google Scholar]
- Tzimas P. S.; Petrakis E. A.; Halabalaki M.; Skaltsounis L. A. Effective Determination of the Principal Non-Psychoactive Cannabinoids in Fiber-Type Cannabis Sativa L. by UPLC-PDA Following a Comprehensive Design and Optimization of Extraction Methodology. Anal. Chim. Acta 2021, 1150, 338200 10.1016/j.aca.2021.338200. [DOI] [PubMed] [Google Scholar]
- Citti C.; Braghiroli D.; Vandelli M. A.; Cannazza G. Pharmaceutical and Biomedical Analysis of Cannabinoids: A Critical Review. J. Pharm. Biomed. Anal. 2018, 147, 565–579. 10.1016/j.jpba.2017.06.003. [DOI] [PubMed] [Google Scholar]
- Nie B.; Henion J.; Ryona I. The Role of Mass Spectrometry in the Cannabis Industry. J. Am. Soc. Mass Spectrom. 2019, 30, 719–730. 10.1007/s13361-019-02164-z. [DOI] [PMC free article] [PubMed] [Google Scholar]
- Valizadehderakhshan M.; Shahbazi A.; Kazem-Rostami M.; Todd M. S.; Bhowmik A.; Wang L. Extraction of Cannabinoids from Cannabis Sativa L. (Hemp)-Review. Agriculture 2021, 11, 384. 10.3390/agriculture11050384. [DOI] [Google Scholar]
- Sticher O. Natural Product Isolation. Nat. Prod. Rep. 2008, 25, 517–554. 10.1039/b700306b. [DOI] [PubMed] [Google Scholar]
- Nuapia Y.; Tutu H.; Chimuka L.; Cukrowska E. Selective Extraction of Cannabinoid Compounds from Cannabis Seed Using Pressurized Hot Water Extraction. Molecules 2020, 25, 1335. 10.3390/molecules25061335. [DOI] [PMC free article] [PubMed] [Google Scholar]
- Drinić Z.; Vladić J.; Koren A.; Zeremski T.; Stojanov N.; Kiprovski B.; Vidović S. Microwave-Assisted Extraction of Cannabinoids and Antioxidants from Cannabis Sativa Aerial Parts and Process Modeling. J. Chem. Technol. Biotechnol. 2020, 95, 831–839. 10.1002/jctb.6273. [DOI] [Google Scholar]
- Agarwal C.; Máthé K.; Hofmann T.; Csóka L. Ultrasound-Assisted Extraction of Cannabinoids from Cannabis Sativa L. Optimized by Response Surface Methodology. J. Food Sci. 2018, 83, 700–710. 10.1111/1750-3841.14075. [DOI] [PubMed] [Google Scholar]
- Callado C. S.-C.; Núñez-Sánchez N.; Casano S.; Ferreiro-Vera C. The Potential of near Infrared Spectroscopy to Estimate the Content of Cannabinoids in Cannabis Sativa L.: A Comparative Study. Talanta 2018, 190, 147–157. 10.1016/j.talanta.2018.07.085. [DOI] [PubMed] [Google Scholar]
- Grekopoulos J. E. Construction and Validation of Quantification Methods for Determining the Cannabidiol Content in Liquid Pharma-Grade Formulations by Means of Near-Infrared Spectroscopy and Partial Least Squares Regression. Med. Cannabis Cannabinoids 2019, 2, 43–55. 10.1159/000500266. [DOI] [PMC free article] [PubMed] [Google Scholar]
- Sanchez L.; Baltensperger D.; Kurouski D. Raman-Based Differentiation of Hemp, Cannabidiol-Rich Hemp, and Cannabis. Anal. Chem. 2020, 92, 7733–7737. 10.1021/acs.analchem.0c00828. [DOI] [PubMed] [Google Scholar]
- Sanchez L.; Filter C.; Baltensperger D.; Kurouski D. Confirmatory Non-Invasive and Non-Destructive Differentiation between Hemp and Cannabis Using a Hand-Held Raman Spectrometer. RSC Adv. 2020, 10, 3212–3216. 10.1039/c9ra08225e. [DOI] [PMC free article] [PubMed] [Google Scholar]
- Horiue H.; Sasaki M.; Yoshikawa Y.; Toyofuku M.; Shigeto S. Raman Spectroscopic Signatures of Carotenoids and Polyenes Enable Label-Free Visualization of Microbial Distributions within Pink Biofilms. Sci. Rep. 2020, 10, 7704 10.1038/s41598-020-64737-3. [DOI] [PMC free article] [PubMed] [Google Scholar]
- Tanney C. A. S.; Backer R.; Geitmann A.; Smith D. L. Cannabis Glandular Trichomes: A Cellular Metabolite Factory. Front. Plant Sci. 2021, 12, 1923. 10.3389/fpls.2021.721986. [DOI] [PMC free article] [PubMed] [Google Scholar]
- Sirikantaramas S.; Taura F.; Tanaka Y.; Ishikawa Y.; Morimoto S.; Shoyama Y. Tetrahydrocannabinolic Acid Synthase, the Enzyme Controlling Marijuana Psychoactivity, Is Secreted into the Storage Cavity of the Glandular Trichomes. Plant Cell Physiol. 2005, 46, 1578–1582. 10.1093/pcp/pci166. [DOI] [PubMed] [Google Scholar]
- Kim E.-S.; Mahlberg P. G. Secretory Cavity Development in Glandular Trichomes of Cannabis Sativa L. (Cannabaceae). Am. J. Bot. 1991, 78, 220. 10.1002/j.1537-2197.1991.tb15749.x. [DOI] [Google Scholar]
- Kim A. E.; Mahlberg P. G.; American S.; Mar N.; Kim E.; Mahlberg P. G.. Immunochemical Localization of Tetrahydrocannabinol (THC) in Cryofixed Glandular Trichomes of Cannabis (Cannabaceae) Stable, URL: Http://Www.Jstor.Org/Stable/2446007, Accessed: 03-03-2016 12: 13 UTC Your Use of the JSTOR Archive Indicates Your Accept. 2016, 84 ( (3), ), 336–342. [PubMed]
- Marks M. D.; Tian L.; Wenger J. P.; Omburo S. N.; Soto-Fuentes W.; He J.; Gang D. R.; Weiblen G. D.; Dixon R. A. Identification of Candidate Genes Affecting Δ9-Tetrahydrocannabinol Biosynthesis in Cannabis Sativa. J. Exp. Bot. 2009, 60, 3715–3726. 10.1093/jxb/erp210. [DOI] [PMC free article] [PubMed] [Google Scholar]
- Yu M. M. L.; Schulze H. G.; Jetter R.; Blades M. W.; Turner R. F. B. Raman Microspectroscopic Analysis of Triterpenoids Found in Plant Cuticles. Appl. Spectrosc. 2007, 61, 32–37. 10.1366/000370207779701352. [DOI] [PubMed] [Google Scholar]
- Hoshino S.; Hosoya H.; Nagakura S. Ultraviolet, Infrared, and Raman Spectra of Protonated Carboxylic Acids. Can. J. Chem. 1966, 44, 1961–1965. 10.1139/v66-292. [DOI] [Google Scholar]
Associated Data
This section collects any data citations, data availability statements, or supplementary materials included in this article.