

Abstract
Human heat-shock protein 90 (HSP90) has four functional domains, including NH2-terminal (N), charged linker region (LR), middle (M) and COOH-terminal (C) domains. In kidney stone disease (or nephrolithiasis/urolithiasis), HSP90 serves as a receptor for calcium oxalate monohydrate (COM), which is the most common crystal to form kidney stones. Nevertheless, roles of HSP90 and its four domains in kidney stone formation remained unclear and under-investigated. We thus examined and compared their effects on COM crystals during physical (crystallization, growth and aggregation) and biological (crystal–cell adhesion and crystal invasion through extracellular matrix (ECM)) pathogenic processes of kidney stone formation. The analyses revealed that full-length (FL) HSP90 obviously increased COM crystal size and abundance during crystallization and markedly promoted crystal growth, aggregation, adhesion onto renal cells and ECM invasion. Comparing among four individual domains, N and C domains exhibited the strongest promoting effects, whereas LR domain had the weakest promoting effects on COM crystals. In summary, our findings indicate that FL-HSP90 and its four domains (N, LR, M and C) promote COM crystallization, crystal growth, aggregation, adhesion onto renal cells and invasion through the ECM, all of which are the important physical and biological pathogenic processes of kidney stone formation.
Graphical abstract

Supplementary Information
The online version contains supplementary material available at 10.1007/s00018-022-04483-z.
Keywords: HSP90, Kidney stone disease, Modulator, Nephrolithiasis, Promoter, Urolithiasis
Introduction
Kidney stone disease, a common renal disorder, is caused by development and deposition of solid crystals formed by mineral salts within the kidney [1]. Among various forms of crystals, calcium oxalate monohydrate (COM) is most frequently observed in stone formers (patients) [2]. Because of annual increases in incidence and prevalence of kidney stone disease [3–5], a wide range of studies have been carried out to gain essential information for thorough understanding of stone pathogenesis and mechanisms of its formation. Recently, proteomics has been applied to unravel the stone-forming processes and to identify stone modulators. More than a thousand of proteins have been identified from urine of the stone formers [6] and kidney stone matrices [7]. Additionally, alterations of protein expression in renal tubular epithelial cells (RTECs) by COM crystals have been identified via proteomics approach [8–17]. Interestingly, functional analyses have demonstrated that some of such altered proteins play roles as modulators (promoters or inhibitors) [18, 19] and COM crystal receptors [20–22] during the stone-forming processes.
Heat-shock protein 90 (HSP90) is a chaperone that plays roles in regulating various cellular processes, including cell cycle [23], cell proliferation [24], signaling pathways [25] and proteostasis (protein homeostasis) [26]. In humans, HSP90α is the main isoform of HSP90 in cytoplasm and is highly expressed under stressful conditions [27]. HSP90 has four domains, which are essential for its functions [28]. NH2-terminal (N) domain is necessary for ATP binding [29] and co-chaperone recognition [30]. Middle (M) domain has been suggested to get involved in ATP hydrolysis [31] and HSP90-client and HSP90-co-chaperone interactions [32]. Charged linker region (LR) domain, a flexible connector between N and M domains, displays an important role to regulate arrangement of N and M domains for client binding [33]. COOH-terminal (C) domain is essential for HSP90 dimerization [34] and HSP90-co-chaperone interactions [35]. As one of the stress-inducible proteins, HSP90 is associated with several diseases, e.g., Alzheimer’s disease [36], sclerosis [37], cancers [38] and human coronavirus infections [39].
The roles of HSP90 in kidney stone disease have been recently explored. A previous study has shown that HSP90 expressed on apical membranes of RTECs may serve as one of the COM crystal receptors [8]. Subsequently, its COM crystal-binding capability have been functionally validated using COM crystal–cell adhesion assay [21, 22]. Moreover, HSP90 has been observed to form complexes with other potential COM crystal receptors, including α-tubulin, β-actin and vimentin [22]. These data indicate that HSP90 serves as a COM crystal receptor and is also an interacting partner of several other COM crystal-binding proteins. However, the roles for HSP90 and its four domains (N, LR, M and C) in COM crystal modulation and kidney stone-forming processes remained unclear and under-investigated. This study therefore examined and compared their effects on COM crystals during physical (crystallization, growth and aggregation) and biological (crystal–cell adhesion and crystal invasion through extracellular matrix (ECM)) pathogenic processes of kidney stone formation.
Materials and methods
Human HSP90 constructs
Five HSP90 constructs for its full-length (FL) and N, LR, M and C domains were generated using a previously published protocol [40]. Briefly, cDNAs encoding FL human HSP90 and its four domains were individually amplified using polymerase chain reaction (PCR). The PCRs were prepared by mixing each cDNA template with Q5 High-Fidelity DNA Polymerase (New England BioLabs; Beverly, MA) and specific primer pair (Table 1). For cloning, the restriction site for NotI was incorporated in both forward and reverse primers. PCRs were performed with initial denaturation at 98 °C for 3 min followed by 35 cycles of denaturation at 98 °C for 30 s, annealing at 55 °C for 30 s and extension at 72 °C for 2 min. The final extension step was done at 72 °C for 10 min.
Table 1.
All primers used for construction of full-length HSP90 and its four domains
| Primer | Nucleotide sequence (5'–3')a |
|---|---|
| Full-length (FL) construct | |
| FL-Forward | GATTGCGGCCGCGATGCCTGAGGAAACCCAG |
| FL-Reverse | GATTGCGGCCGCTTAGTCTACTTCTTCCAT |
| NH2-terminal (N) domain construct | |
| N-Forward | GATTGCGGCCGCGATGCCTGAGGAAACCCAG |
| N-Reverse | GATTGCGGCCGCTTATTCAGCCTCATCATCGCT |
| Charged linker region (LR) domain construct | |
| LR-Forward | GATTGCGGCCGCAATGGAAAAGGAAGACAAAGAAGAAG |
| LR-Reverse | GATTGCGGCCGCTTAATCCTTCTTTTCTTCTTCCTC |
| Middle (M) domain construct | |
| M-Forward | GATTGCGGCCGCTATGGGTGACAAGAAGAAGAAG |
| M-Reverse | GATTGCGGCCGCTTACATGTAACCCATTGTTGAGTTG |
| COOH-terminal (C) domain construct | |
| C-Forward | GATTGCGGCCGCGATGGCAGCAAAGAAACACCTG |
| C-Reverse | GATTGCGGCCGCTTAGTCTACTTCTTCCAT |
aThe underlined sequences are NoltI restriction site
After amplification, all PCR products were cut with NotI restriction enzyme (New England BioLabs) and cloned into bacterial expression vector, pET-32b(+) (Novagen, Merck KGaA; Darmstadt, Germany). The vectors carrying individual HSP90 constructs were separately transformed into 10-beta competent Escherichia coli (New England BioLabs) using heat-shock method. The positive colonies were picked and checked for the presence of inserts using colony PCR. Finally, the plasmid vectors containing the inserts were isolated using GF-Plasmid DNA extraction kit (Vivantis; Selangor, Malaysia), and the nucleotide sequences and orientation of inserts were verified by DNA sequencing.
Preparation of recombinant HSP90 constructs
To express the recombinant proteins, vectors carrying individual HSP90 constructs were introduced into BL21 (DE3) competent E. coli (Novagen) using heat-shock method. After 16-h incubation with isopropyl-β-D-thiogalactopyranoside (IPTG) at 18 °C, the bacterial cultures were centrifuged at 5,000 × g and 4 °C for 10 min to pellet the cells. Cellular proteins were extracted by a lysis/binding buffer (25 mM Tris, 500 mM NaCl, 5% glycerol; pH 7.5). Centrifugation was performed at 12,000 × g and 4 °C for 20 min to pellet cell debris, and all cellular proteins including recombinant proteins were then collected.
The recombinant HSP90 constructs produced by pET-32b(+) vector were fused with thioredoxin, hexa-histidine and S-protein tag (Trx-His-S). These fusion recombinant proteins in the protein lysates were purified using Ni–NTA His·Bind Resin beads (Novagen). The lysates were incubated with 500 µl of the beads at 4 °C for 1 h on a tube rotator. The mixtures were gently added into columns followed by washing with washing buffer (lysis/binding buffer with 10 mM imidazole). Thereafter, the tagged proteins were eluted from columns by adding 2.5 ml of elution buffer (lysis/binding buffer with 250 mM imidazole) into the center of the columns.
The Trx-His-S tag fused with purified recombinant HSP90 constructs was removed by incubating with recombinant enterokinase (EK) in specific digestion conditions as shown in Table 2. After the digestion at 25 °C for 16 h, EKapture agarose (Novagen) was employed to remove EK, and Ni–NTA His·Bind Resin beads (Novagen) were used for capturing cleaved fusion tag protein and uncleaved recombinant proteins. After brief centrifugation to pellet the beads, the purified recombinant HSP90 proteins in supernatants were collected. Protein concentrations in individual samples were measured using Bio-Rad Protein Assay (Bio-Rad Laboratories; Hercules, CA). Finally, molar concentrations were adjusted to be identical for all samples.
Table 2.
Digestion conditions for Trx-His-S tagged HSP90 constructs
| HSP90 construct | Enterokinase (U) | Urea (M) |
|---|---|---|
| FL | 0.5 | 1 |
| N | 0.5 | 2 |
| LR | 1.0 | – |
| M | 0.5 | 1 |
| C | 0.5 | 1 |
COM crystallization assay
The crystallization assay was performed by using a previously published protocol [41, 42]. Initially, calcium chloride (CaCl2·2H2O) (Merck; Branchburg, NJ) (at 10 mM) and sodium oxalate (Na2C2O4) (Sigma-Aldrich; St. Louis, MO) (at 1 mM) solutions were prepared in a crystallization buffer (pH 7.4) containing 10 mM Tris (Affymetrix inc.; Cleveland, OH) and 90 mM sodium chloride (NaCl) (Bio Basic; Toronto, Canada). In each well of 24-well plate (Corning Inc.; Corning, NY), 500 µl of 10 mM CaCl2·2H2O was added followed by 7 µl of each purified recombinant HSP90 construct (FL, N, LR, M or C) (their final molar concentration was equal at 45 nM.). In parallel, the wells added with an equal volume of the crystallization buffer without any protein served as the blank control, whereas those added with an equal volume and molar concentration of lysozyme (Sigma-Aldrich) served as the negative control. Then, 500 µl of 1 mM Na2C2O4 was added into each well. The mixtures were incubated at 25 °C for 1 h. Thereafter, COM crystals were observed and imaged using Nikon Eclipse Ti-S inverted phase-contrast light microscope (Nikon; Tokyo, Japan). Crystal sizes were measured from at least 100 crystals in 15 random fields per sample in each experiment using NIS Element D software version 4.11 (Nikon). Crystal abundance was then calculated using the following formula:
| 1 |
Fourier transform infrared (FT-IR) spectroscopy
FT-IR spectroscopy was performed to confirm of the crystal type (COM) as described previously [43]. Briefly, the crystals were dried and analyzed under the Nicolet 6700 FT-IR spectroscope equipped with an attenuated total reflectance (ATR) accessory and OMNIC software version 8.3 (Thermo Scientific Inc.; Waltham, MA). Sample spectra were acquired from 4000 to 600 cm−1 range with a resolution of 4 cm−1 per each spectrum. All these sample spectra were then matched with the reference FT-IR kidney stone basic library using the OMNIC software.
COM crystal growth assay
Crystal growth assay was performed by using a previously published protocol [44, 45]. Initially, 500 µl of 10 mM CaCl2·2H2O was added in each well of 24-well plate followed by 500 µl of 1 mM Na2C2O4. The mixture was incubated at 25 °C for 1 h to allow crystallization to complete. Thereafter, 7 µl of each purified recombinant HSP90 construct (FL, N, LR, M or C) or lysozyme (negative control) at equal molar concentration (45 nM at final) or crystallization buffer without protein (blank control) was added into each well. At this time point (T0), crystal images were taken using the Nikon Eclipse Ti-S inverted phase-contrast light microscope. The mixtures were further incubated at 25 °C for 60 min (T60), and crystal images were again taken at T60. Crystal sizes were measured from at least 100 crystals in 15 random fields per sample in each experiment using the NIS Element D software version 4.11. Δ Crystal size representing crystal growth was then calculated using the following formula:
| 2 |
In addition to image analysis, crystal growth was also evaluated by flow cytometry using BD Accuri C6 flow cytometer (BD Biosciences; San Jose, CA). At T0 and T60, forward scatter (FSC), which commonly refers to particle size, was measured from 10,000 crystals per sample in each experiment. Δ Crystal size representing crystal growth was then calculated using the following formula:
| 3 |
COM crystal aggregation assay
COM crystals were generated in a larger scale by mixing 1:1 (vol/vol) of 10 mM CaCl2·2H2O and 1 mM Na2C2O4 and incubating overnight at 25 °C [46, 47]. Centrifugation was performed at 2,000 × g and 25 °C for 5 min to harvest the crystals. After washing three times with methanol, the crystals were allowed to air-dry. Crystal aggregation assay was then performed by using a previously published protocol [48, 49]. In each well, 1,000 µg dried COM crystals were re-suspended in 1 ml crystallization buffer. Subsequently, 7 µl of each purified recombinant HSP90 construct (FL, N, LR, M or C) or lysozyme (negative control) at equal molar concentration (45 nM at final) or crystallization buffer without protein (blank control) was added into each well. The mixtures were incubated in a ThermoMixer C (Eppendorf; Hauppauge, NY) with shaking at 150 rpm and 25 °C for 1 h. Thereafter, crystal images were taken using the Nikon Eclipse Ti-S inverted phase-contrast light microscope. The number of crystal aggregates, charaterized by “assembly of three or more individual COM crystals that tightly joined together” [48], was counted from at least 15 random fields per sample in each experiment.
In addition to image analysis, crystal aggregation was quantified by flow cytometry using the BD Accuri C6 flow cytometer (BD Biosciences). The percentage of crystal aggregates, characterized by right shift of FSC and upward shift of side scatter (SSC) from the general population of individual crystals, was then calculated from 10,000 measurements per sample in each experiment using the following formula:
| 4 |
COM crystal–cell adhesion assay
Crystal–cell adhesion assay was performed by using a previously published protocol [50, 51]. MDCK (ATCC; Manassas, VA), a distal renal tubular epithelial cell line, was used as a cell model for this assay. The cells were propagated in a complete medium, containing Dulbecco's modified Eagle medium (DMEM) (Gibco; Grand Island, NY) supplemented with 10% heat-inactivated fetal bovine serum (FBS) (Gibco), 60 U/ml penicillin G (Sigma-Aldrich) and 60 μg/ml streptomycin (Sigma-Aldrich). The cells were maintained in a humidified incubator with 5% CO2 at 37 °C. Approximately 5 × 10⁵ cells were seeded into each well of the 6-well plate (Corning Inc.). The cells were then grown in the complete medium in a humidified incubator at 37 °C with 5% CO2 for 24 h or until they were confluent.
Meanwhile, COM crystals were prepared as mentioned above in the aggregation assay. The dired COM crystals were exposed to ultraviolet-C light for 30 min to eliminate any microbial contamination. The decontaminated crystals (100 µg) were then re-suspended in 1 ml complete medium. Subsequently, 7 µl of each purified recombinant HSP90 construct (FL, N, LR, M or C) or lysozyme (negative control) at equal molar concentration (45 nM at final) or crystallization buffer without protein (blank control) was added into the crystal suspension.
After confluent, the culture medium was removed and the crystal suspension was added onto the confluent cell monolayers and further incubated in a humidified incubator with 5% CO2 at 37 °C for 1 h. Thereafter, unbound crystals were removed from the cells by vigorous washing with PBS. The remaining crystals adhered on the cell monolayers were then imaged by using the Nikon Eclipse Ti-S inverted phase-contrast light microscope. The number of the adhered crystals was counted from at least 15 random fields per sample in each experiment.
COM crystal invasion (through ECM) assay
Crystal invasion assay was performed by using a previously published protocol [52, 53]. The dried COM crystals (20 µg) (prepared as for the aggregation assay) were re-suspended in 200 µl DMEM. Subsequently, 7 µl of each purified recombinant HSP90 construct (FL, N, LR, M or C) or lysozyme (negative control) at equal molar concentration (45 nM at final) or crystallization buffer without protein (blank control) was added into the crystal suspension. The mixtures were incubated overnight at 4 °C on a tube rotator to allow the proteins to thoroughly bind onto the crystal surfaces. Thereafter, unbound crystals were removed by centrifugation at 2,000 × g and 4 °C for 5 min. After washing with PBS and another cycle of centrifugation, the crystal–protein complexes were incubated with 200 µl of 0.3 pM Lys-plasminogen (Fitzgerald Industries international; Acton, MA) in PBS at 37 °C for 1 h. Unbound plasminogen was removed by centrifugation at 2,000 × g and 4 °C for 5 min followed by washing with PBS and another cycle of centrifugation. The crystal–protein–plasminogen complexes were then mixed with 100 µl of 0.15 pM urokinase plasminogen activator (Fitzgerald Industries International) in PBS.
Finally, the mixtures were gently added on-top of the ECM migration chambers containing matrix gel and further incubated at 37 °C for 24 h. Invasion of the crystals inside the ECM chambers was imaged by using a light microscope with differential interference contrast (DIC) mode (Nikon Eclipse 80i). Invasion distances of the crystals in individual samples were measured from at least 20 areas in 5 random fields per sample (100 measurements/sample) in each experiment using the NIS Element D software version 4.11.
Analyses for Ca2+- and C2O42−-binding motifs in FL-HSP90 and its four domains
To search for Ca2+- and C2O42−-binding motifs, ScanProsite tool (https://prosite.expasy.org/scanprosite/) was employed. For Ca2+-binding motifs, sequences of FL-HSP90 and N, LR, M and C domains were searched against the Prosite pattern collection of Ca2+-binding motifs/patterns, including EGF-like and EF-hand patterns. For C2O42−-binding motifs, their sequences were analyzed for the C2O42−-binding pattern “L-x(3,5)-R-x(2)-[AGILPV]” previously reported [54].
Analysis of electrostatic potential distributions on the surfaces of FL-HSP90 and its four domains
The electrostatic potential distributions on the surfaces of FL-HSP90 and its four domains were analyzed by UCSF ChimeraX software (version 1.3) (https://www.rbvi.ucsf.edu/chimerax) using 3D structure of HSP90, available in AlphaFold protein structure database (https://alphafold.ebi.ac.uk), as a template. The electrostatic potentials of FL-HSP90 and its four domains were then auto-calculated according to Coulomb's law.
Statistical analysis
The quantitative data were obtained from three independent experiments using different biological replicates and are represented as mean ± SEM in all experiments. SPSS software (version 18) (IBM SPSS; Armonk, NY) was used for statistical analysis. Each data set was examined for the normal distribution using Kolmogorov–Smirnov and Shapiro–Wilk tests. Multiple comparisons were made using one-way analysis of variance (ANOVA) with Tukey’s post hoc test when the data were normally distributed, but using Kruskal–Wallis test for those without normal distribution. P value less than 0.05 was considered statistically significant.
Results
Production of recombinant FL-, N-, LR-, M- and C-HSP90 proteins
To investigate the roles for FL-HSP90 and its four domains (N, LR, M and C) in COM crystal modulation and kidney stone-forming processes, recombinant FL-HSP90 and its four domains were constructed according to the protocol established previously [40]. As demonstrated in Fig. 1, FL-HSP90 was composed of 732 amino acid residues, whereas N, LR, M and C domains contained 236 (1st–236th), 35 (237th–271st), 357 (272nd–628th) and 104 (629th–732nd) residues, respectively. Calculating for their isoelectric points (pI) via the Compute pI/Mw tool (https://web.expasy.org/compute_pi/) revealed that FL-HSP90 exhibited negatively charged property with an acidic pI of 4.94. For its domains, N, LR and C also showed negatively charged property with pI of 4.63, 4.16 and 4.34, respectively. On the other hand, M domain showed positively charged value with a pI of 8.42 (Fig. 1).
Fig. 1.

Positions and amino acid sequences of human HSP90 and its four domains. The individual HSP90 constructs, including full-length (FL), NH2-terminal domain (N), charged liker region domain (LR), middle domain (M) and COOH-terminal domain (C), were designed using the previously published protocol [40]. The position, amino acid sequence and theoretical isoelectric point (pI) of each HSP90 construct are given in separate boxes. Other parameters for these constructions are detailed in Tables 1 and 2
Effects of FL-, N-, LR-, M- and C-HSP90 on COM crystallization
All the recombinant HSP90 constructs with equal volume and molar concentration, were subjected to COM crystallization assay (Fig. 2A). An equal volume of crystallization buffer without protein served as the blank control, whereas lysozyme with equal volume and molar concentration served as the negative control. After 1-h incubation, crystal sizes were measured and crystal abundance was calculated using Formula 1. Comparing with the blank and negative controls, FL-HSP90 and all other HSP90 constructs significantly increased the crystal size and abundance (Fig. 2B and C). Comparing among the four domains, C-HSP90 exhibited the strongest promoting effect, whereas LR-HSP90 showed the weakest promoting effect on both crystal size and abundance (Fig. 2B and C).
Fig. 2.

Effects of FL-, N-, LR-, M- and C-HSP90 on COM crystallization. Crystallization assay was performed in the absence (blank control) or presence of each of the HSP90 constructs or lysozyme (negative control) at an equal molar concentration (45 nM). A Micrographs of the COM crystals were captured by using an inverted phase-contrast light microscope. B Crystal sizes were measured from at least 100 crystals in 15 random fields per sample in each experiment. C Crystal abundance was derived from at least 15 random fields per sample in each experiment using Formula 1 (see “Materials and Methods”). All quantitative data were derived from three independent experiments using different biological replicates and are presented as mean ± SEM. * = p < 0.05 vs. blank and negative controls; # = p < 0.05 vs. FL; δ = p < 0.05 vs. N; † = p < 0.05 vs. LR
Analysis of crystal type by Fourier transform infrared (FT-IR) spectroscopy
To confirm that our crystallization assay yielded typical COM crystals, chemical composition of the resulting crystals was analyzed by FT-IR spectroscopy. The data confirmed that all the sample spectra were consistently matched with the reference COM spectrum in the FT-IR kidney stone basic library (Supplementary Fig. S1).
Effects of FL-, N-, LR-, M- and C-HSP90 on COM crystal growth
Crystal growth assay was performed similar to the crystallization assay, but started after initial crystallization for 60 min to allow crystallization to complete (to avoid the effect of neocrystallization). Monitoring crystallization and crystal growth phases revealed that neocrystals continuously occurred since the first few minutes after mixing calcium chloride with sodium oxalate until 40-min, when the number of crystals was stable (Supplementary Fig. S2). Thereafter, crystal growth (as indicated by the increasing crystal size) continued until the end of monitoring at 120-min (Supplementary Fig. S2).
After the initial crystallization step for 1 h without protein intervention (T0) (or at 60-min time point shown in Supplementary Fig. S2), the preformed crystals were further incubated with each of the recombinant HSP90 constructs, lysozyme (negative control) or crystallization buffer without protein (blank control) with equal volume and/or equal molar concentration for 60 min (T60) (or at 120-min time point shown in Supplementary Fig. S2). Crystal image analysis revealed that FL-HSP90 dramatically promoted growth or enlargement of the preformed crystals as shown by a marked increase in Δ crystal size when compared with the blank and negative controls (Fig. 3). Among the four domains, N-HSP90 exhibited the strongest promoting effect, whereas LR-HSP90 showed the weakest effect on the COM crystal growth (Fig. 3).
Fig. 3.

Effects of FL-, N-, LR-, M- and C-HSP90 on COM crystal growth by image analysis. Crystal growth assay was performed in the absence (blank control) or presence of each of the HSP90 constructs or lysozyme (negative control) at an equal molar concentration (45 nM). A Micrographs of the COM crystals were captured at T0 and T60 by using an inverted phase-contrast light microscope. B–H Crystal sizes at T0 and T60 were measured from at least 100 crystals in 15 random fields per sample in each experiment. I: Δ Crystal size representing crystal growth was then calculated using Formula 2 (see “Materials and Methods”). All quantitative data were derived from three independent experiments using different biological replicates and are presented as mean ± SEM. * = p < 0.05 vs. blank and negative controls; # = p < 0.05 vs. FL
In addition to image analysis, COM crystal growth was also evaluated by flow cytometry. In consistent with the image analysis, flow cytometric analysis revealed that FL-HSP90 markedly promoted COM crystal growth (Δ crystal size) as compared with the blank and negative controls (Fig. 4). Among the four domains, N- and C-HSP90 exhibited the strongest promoting effect, whereas LR-HSP90 showed the weakest promoting effect on COM crystal growth (Fig. 4).
Fig. 4.

Effects of FL-, N-, LR-, M- and C-HSP90 on COM crystal growth by flow cytometry. Crystal growth assay was performed in the absence (blank control) or presence of each of the HSP90 constructs or lysozyme (negative control) at an equal molar concentration (45 nM). A Scatter plots showing sizes (indicated by forward scatter or FSC) of 10,000 COM crystals per sample in each experiment at T0 and T60 as measured by BD Accuri C6 flow cytometer. B Δ Crystal size representing crystal growth was then calculated using Formula 3 (see “Materials and Methods”). All quantitative data were derived from three independent experiments using different biological replicates and are presented as mean ± SEM. A.U. = arbitrary unit; SSC = side scatter; * = p < 0.05 vs. blank and negative controls; # = p < 0.05 vs. FL; δ = p < 0.05 vs. N; † = p < 0.05 vs. LR; $ = p < 0.05 vs. M
Effects of FL-, N-, LR-, M- and C-HSP90 on COM crystal aggregation
The number of the crystal aggregates (or “assembly of three or more individual COM crystals that tightly joined together” [48]) was counted after 1-h incubation with each of the recombinant HSP90 constructs, lysozyme (negative control) or crystallization buffer without protein (blank control) with equal volume and/or equal molar concentration. As demonstrated in Fig. 5, the number of the crystal aggregates was obviously increased by all the five HSP90 constructs compared with the blank and negative controls. Comparing among the four domains, N- and C-HSP90 exhibited the strongest promoting effect, whereas LR-HSP90 showed the weakest promoting effect on COM crystal aggregation (Fig. 5).
Fig. 5.

Effects of FL-, N-, LR-, M- and C-HSP90 on COM crystal aggregation by image analysis. Crystal aggregation assay was performed in the absence (blank control) or presence of each of the HSP90 constructs or lysozyme (negative control) at an equal molar concentration (45 nM). A Micrographs of the COM crystal aggregates (highlighted with dotted circles) were captured by using an inverted phase-contrast light microscope. B The number of the crystal aggregates, charaterized by “assembly of three or more individual COM crystals that tightly joined together” [48], was counted from at least 15 random fields per sample in each experiment. All quantitative data were derived from three independent experiments using different biological replicates and are presented as mean ± SEM. * = p < 0.05 vs. blank and negative controls; # = p < 0.05 vs. FL
In addition to image analysis, COM crystal aggregation was also evaluated by flow cytometry. In consistent with the image analysis, flow cytometric analysis revealed that all the five HSP90 constructs obviously promoted COM crystal aggregation as compared with the blank and negative controls (Fig. 6). Among the four domains, N- and C-HSP90 exhibited the strongest promoting effect, whereas LR-HSP90 showed the weakest promoting effect on COM crystal aggregation (Fig. 6).
Fig. 6.

Effects of FL-, N-, LR-, M- and C-HSP90 on COM crystal aggregation by flow cytometry. Crystal aggregation assay was performed in the absence (blank control) or presence of each of the HSP90 constructs or lysozyme (negative control) at an equal molar concentration (45 nM). A Scatter plots of crystal aggregates characterized by right shift of forward scatter (FSC) and upward shift of side scatter (SSC) (highlighted with dotted rectangles) were obtained from 10,000 measurements per sample in each experiment using BD Accuri C6 flow cytometer. B The percentage of crystal aggregates was calculated using Formula 4 (see “Materials and Methods”). All quantitative data were derived from three independent experiments using different biological replicates and are presented as mean ± SEM. * = p < 0.05 vs. blank and negative controls; # = p < 0.05 vs. FL; δ = p < 0.05 vs. N; † = p < 0.05 vs. LR
Effects of FL-, N-, LR-, M- and C-HSP90 on COM crystal–cell adhesion
The adhered crystals were evaluated after 1-h incubation of MDCK cell monolayers with the mixture of COM crystals and each of the recombinant HSP90 constructs, lysozyme (negative control) or crystallization buffer without protein (blank control) with equal volume and/or equal molar concentration followed by a vigorous wash. The data demonstrated that all the five HSP90 constructs obviously increased the number of the adhered COM crystals on the cell monolayers (Fig. 7). Among the four domains, degrees of their promoting effect on COM crystal–cell adhesion were comparable although the LR-HSP90 tended to show the weakest promoting effect (Fig. 7).
Fig. 7.

Effects of FL-, N-, LR-, M- and C-HSP90 on COM crystal–cell adhesion. Crystal–cell adhesion assay was performed in the absence (blank control) or presence of each of the HSP90 constructs or lysozyme (negative control) at an equal molar concentration (45 nM). A Micrographs of the adhered COM crystals remained on the cell monolayer after a vigorous wash were captured by using an inverted phase-contrast light microscope. B The number of the adhered COM crystals was counted from at least 15 random fields per sample in each experiment. All quantitative data were derived from three independent experiments using different biological replicates and are presented as mean ± SEM. * = p < 0.05 vs. blank and negative controls
Effects of FL-, N-, LR-, M- and C-HSP90 on COM crystal invasion through ECM
The effects of FL-HSP90 and its four domains on COM crystal invasion through the ECM were examined using a migration chamber containing matrix gel to simulate the events inside the renal interstitium. Crystal invasion distances were measured after 24-h incubation of the crystal–protein–plasminogen complex with urokinase plasminogen activator in ECM chamber. The results showed that all the five HSP90 constructs exhibited potent promoting effect on COM crystal invasion through the ECM as compared with the blank and negative controls (Fig. 8). Comparing among the four domains, N-HSP90 exhibited the strongest promoting effect, whereas M-HSP90 showed the weakest promoting effect on the COM crystal invasion through the ECM (Fig. 8).
Fig. 8.

Effects of FL-, N-, LR-, M- and C-HSP90 on COM crystal invasion through ECM. Crystal invasion (through ECM) assay was performed in the absence (blank control) or presence of each of the HSP90 constructs or lysozyme (negative control) at an equal molar concentration (45 nM). A Micrographs of the invaded COM crystals were captured by using a light microscope with differential interference contrast (DIC) mode. B Invasion distances (d) of the crystals in individual samples were measured from at least 20 areas in 5 random fields per sample (100 measurements/sample) in each experiment. All quantitative data were derived from three independent experiments using different biological replicates and are presented as mean ± SEM. * = p < 0.05 vs. blank and negative controls; # = p < 0.05 vs. FL; δ = p < 0.05 vs. N; † = p < 0.05 vs. LR; $ = p < 0.05 vs. M
Analyses for Ca2+- and C2O42−-binding motifs in FL-HSP90 and its four domains
To define mechanism underlying the promoting effects of FL-HSP90 and its four domains (N, LR, M and C) on COM crystals, their sequences were analyzed for potential Ca2+- and C2O42−-binding motifs. The results showed that FL-HSP90 and all of its four domains did not contain any Ca2+-binding motifs/patterns. However, there were five potential C2O42−-binding sites found only in the M-HSP90 (at residues 340th–348th, 363rd–370th, 382nd–389th, 394th–403rd and 409th–416th), whereas none were detected in the other HSP90 domains (Fig. 9).
Fig. 9.

Potential C2O42−-binding motifs in human HSP90. Sequences of FL-HSP90 and N, LR, M and C domains were submitted to ScanProsite tool (https://prosite.expasy.org/scanprosite/) to search for the C2O42−-binding pattern “L-x(3,5)-R-x(2)-[AGILPV]” previously reported [54]. The model was constructed by UCSF ChimeraX software (version 1.3) (https://www.rbvi.ucsf.edu/chimerax) using 3D structure of HSP90 available in AlphaFold protein structure database (https://alphafold.ebi.ac.uk) as a template. Five potential C2O42−-binding sites (in blue color at residues 340th–348th, 363rd–370th, 382nd–389th, 394th–403rd and 409th–416th) were found only in the M domain (in orange color), whereas none were detected in the other HSP90 domains (in gray color)
Analysis of electrostatic potential distributions on the surfaces of FL-HSP90 and its four domains
To further address mechanism underlying the promoting effects of FL-HSP90 and its four domains (N, LR, M and C) on COM crystals, they were also analyzed for electrostatic potential distributions on their surfaces. Analysis using UCSF ChimeraX software (version 1.3) revealed that their mean electrostatic potentials were in the range of weakly to moderately negative (− 3.47, − 3.31, − 7.40, − 0.55 and − 4.22 kcal/(mol·e) for FL-, N-, LR-, M- and C-HSP90, respectively) (Table 3 and Fig. 10).
Table 3.
Electrostatic potentials on the surfaces of FL-HSP90 and its four domains
| HSP90 Structure | Electrostatic potential (kcal/(mol·e)) | ||
|---|---|---|---|
| Minimum | Maximum | Mean | |
| FL | − 22.89 | + 10.55 | − 3.47 |
| N | − 21.93 | + 10.44 | − 3.31 |
| LR | − 18.12 | + 5.40 | − 7.40 |
| M | − 13.55 | + 14.79 | − 0.55 |
| C | − 16.39 | + 8.26 | − 4.22 |
Fig. 10.
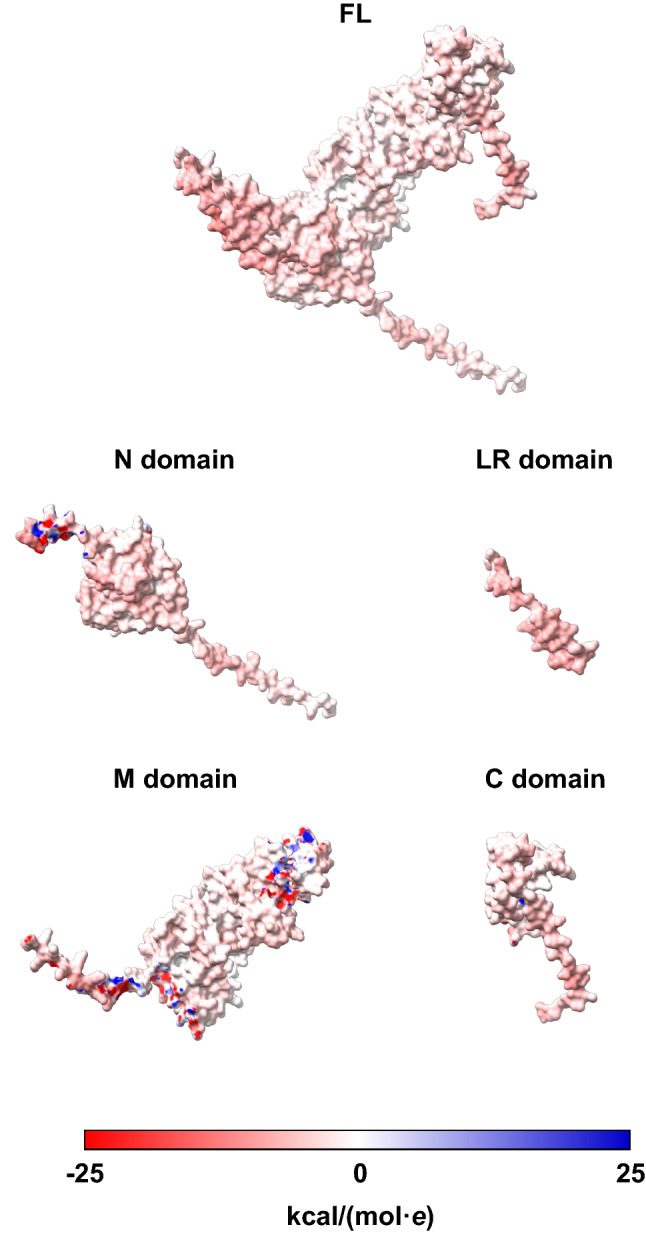
Electrostatic potential distributions on the surfaces of FL-HSP90 and its four domains. The models were constructed by UCSF ChimeraX software (version 1.3) (https://www.rbvi.ucsf.edu/chimerax) using 3D structure of HSP90 available in AlphaFold protein structure database (https://alphafold.ebi.ac.uk) as a template. The electrostatic potentials of FL-HSP90 and its four domains were auto-calculated according to Coulomb's law. Red color indicates negatively charged, whereas blue indicates positively charged distributions at the range of − 25 to + 25 kcal/(mol·e). Additional details are reported in Table 3
Discussion
Over decades, the roles for proteins in kidney stone disease have been extensively investigated. Proteomics study has recently demonstrated that COM crystals can alter the expression of several proteins involved in cellular processes and components [9]. Additionally, several various proteins bind to COM crystals [50] and are incorporated into the stone matrices as evidenced by their identifications inside kidney stones [7]. Importantly, these proteins have been suggested to act as promoters or inhibitors in stone-forming processes [55, 56]. Experimental studies have revealed that the adhesion and incorporation of proteins into the crystals have important effects on several steps in stone formation [18–20].
Recently, HSP90 has been characterized as one of COM crystal receptors [21]. Besides, it has been reported to interact with other COM crystal receptors [22]. We thus hypothesized that HSP90 can bind to or be incorporated into COM crystals and then modulate the stone-forming processes. Our study was therefore performed to determine the effects of FL-HSP90 and its four domains on COM crystallization, growth, aggregation, adhesion and invasion through ECM.
Crystallization is an initial process that occurs when renal tubular fluid or interstitial fluid is supersaturated with stone-forming minerals, predominantly Ca2+ and C2O42− ions [57]. In addition to high concentrations of minerals, the supersaturated fluids are rich with several macromolecules that regulate the crystal formation [56]. The crystallization process can be evaluated by using several parameters, including crystal number, size and crystal mass [49]. Herein, we evaluated COM crystallization by measuring crystal sizes and calculating crystal abundance. Our COM crystallization assay demonstrated that the FL-HSP90 and its four domains promoted COM crystallization but at different degrees.
Protein–crystal interactions are driven by multiple factors, one of which is net electrostatic charge of the proteins [58]. The study based on mass spectrometry and bioinformatics analysis has shown that most of the identified COM-binding proteins exhibit either negatively or positively charged properties [50]. These charges depend on contents of amino acids, particularly side chains that determine acidic (aspartate and glutamate) or basic (lysine and arginine) property of individual residues [59]. Interestingly, most of the proteins identified from the stone matrices exhibit isoelectric point (pI) lower than 5 or higher than 9 [59]. Another factor determining protein–crystal interactions is the presence of binding sites for calcium (Ca2+) and oxalate (C2O42−) ions in the protein molecules. These binding sites have been observed in proteins involved in kidney stone formation such as Tamm–Horsfall protein (THP) [60] and fibronectin [18].
To date, Ca2+- and C2O42−-binding sites of HSP90 have not been reported. In our present study analyzing for Ca2+- and C2O42−-binding motifs, there were none of the Ca2+-binding motifs found in FL-HSP90 and all of its four domains. Similarly, none of the C2O42−-binding motifs were found in N-, LR- and C-HSP90. However, M-HSP90 contained five potential C2O42−-binding sites. Interestingly, FL-, N-, LR- and C-HSP90 exhibited negatively charged property with acidic pI, whereas its M domain showed positively charged value with basic pI. Its positive charge might be also responsible for C2O42− binding as for the five potential C2O42−-binding sites. Although the FL-HSP90 and other domains did not show any of the Ca2+- and C2O42−-binding motifs, their weakly to moderately negative electrostatic potentials might be responsible for Ca2+-binding independent of the known or recognized Ca2+-binding motifs, thereby promoting COM crystallization, crystal growth and aggregation. Nevertheless, this hypothesis remained to be elucidated.
After the COM crystals form, they can grow continuously under the supersaturated condition by adding free Ca2+ and C2O42− ions to the crystals [61]. Immunofluorescence staining has revealed the spatial distribution of negatively charged proteins inside and outside of the crystals during growing process [19]. In our present study, negatively charged FL-HSP90, N-HSP90 and C-HSP90, and positively charged M-HSP90 could enhance the growth of COM crystals. This finding was consistent with that reported in a recent study demonstrating that flagellum isolated from E. coli exhibited a promoting effect on crystal growth due to its charge [45]. Possibly, it can be explained that the negatively and positively charged proteins coated onto the crystal surfaces can bind to free Ca2+ and Ox2−, respectively, resulting in the crystal growth [62].
Crystal aggregation proceeds by joining several crystals together to enlarge the size and to form crystal agglomerate [63]. Large crystal aggregates can cause crystal retention inside renal tubules by adhering onto the tubular epithelial cell surface, thereby obstructing tubular fluid flow [64]. Promotion and inhibition of crystal aggregation are also regulated by degree of electrostatic charges of the proteins coated on the COM crystal surfaces [58, 65]. Due to the low binding affinity of weakly charged proteins, the remaining areas on crystal surfaces can combine with the proteins on surfaces of other crystals (protein–crystal–protein interactions) [65]. By contrast, strongly charged proteins can completely adhere onto the crystal surfaces and block crystal–crystal combination [65]. Our study demonstrated that the weakly to moderately electrostatic charged FL-HSP90 and its four domains exhibited promoting effect on COM crystal aggregation. This finding was consistent with the other study revealing that the weakly to moderately electrostatic charged fibronectin (mean electrostatic potential calculated by UCSF ChimeraX (version 1.3) was − 3.78 kcal/(mol·e)) had the potential to promote the crystal aggregation [18].
Another important pathogenic process of stone formation is adhesion of crystals onto RTECs [16]. In addition to COM crystal receptors expressed on apical plasma membranes, crystal–cell adhesion can be modulated by urinary [18] and secreted proteins [66]. In this study, we found that FL-HSP90 and its four domains could increase crystal binding onto the MDCK cells, indicating that they play role as a promoter for crystal–cell adhesion. In concordance, the proteins secreted during crystal-induced ER stress from RTECs could affect the stone formation by increasing crystal–cell adhesion [66]. There are two possibilities to explain this observation. One is the electrostatic charges. Coating the crystal surfaces with positively or negatively charged molecules may change their electrostatic charges and subsequently affect the crystal adhesive capability [57]. Another factor is protein–protein interactions. This promoting effect may be modulated by interactions between HSP90 molecules coated on the crystal surfaces and other COM crystal receptors located at RTECs surfaces [22].
Crystal–cell interactions may also result in translocation of crystals from tubular lumen into tubular epithelial cells [43, 67, 68]. Thereafter, the crystals may migrate or invade into the renal interstitium via plasmin–plasminogen pathway [53]. Evidence has suggested that interaction of the proteins coated on crystal surfaces and plasminogen is associated with crystal invasion [52, 53]. Fibronectin has been reported to bind onto crystal surfaces, and its RGD motif (Arg-Gly-Asp) can interact with plasminogen, resulting in activation of the plasmin–plasminogen pathway and crystal invasion [18]. Our crystal invasion assay showed that FL-HSP90 had ability to promote crystal invasion through the ECM. Additionally, this promoting ability was observed for all individual domains. Although HSP90 has no RGD motif, its activation of the plasmin–plasminogen pathway might be due to its direct binding property on the crystal surface and/or its potential interaction with fibronectin [69], which is an abundant component of ECM [70]. Moreover, our finding was consistent with the previous report demonstrating that α-enolase secreted from RTECs in response to COM crystals could promote the crystal invasion [53].
Comparing among the four domains of HSP90, it seemed that N-HSP90 and C-HSP90 served as the most potent promoter for the COM stone-forming processes. On the other hand, LR-HSP90 exhibited the weakest promoting activity on almost all of the COM stone-forming processes. The weakest promoting activity of the LR domain was most likely due to its smallest size with only 35 amino acid residues. Nevertheless, the size alone could not explain the weakest promoting activity of M-HSP90 on the COM crystal invasion through the ECM. Note that M is the largest domain of HSP90 containing 357 amino acid residues and occupying 49% of the HSP90 whole sequence. Therefore, mechanisms underlying differential degrees of promoting activities of individual HSP90 domains should be further elucidated.
In conclusion, our investigations have demonstrated important roles of HSP90 in kidney stone-forming processes. FL-HSP90 and its functional domains, including N, LR, M and C domains, considerably promote COM crystallization, crystal growth, crystal aggregation, crystal–cell adhesion and crystal invasion through the ECM processes. Therefore, HSP90 also serves as a promoter for COM stone formation in addition to its known function as a COM crystal receptor.
Supplementary Information
Below is the link to the electronic supplementary material.
Acknowledgements
We are grateful to Ms. Kanyarat Sueksakit for her assistance in initial setting of the crystal invasion assay.
Author contributions
SY, PP, SP and VT designed the research; SY, PP and SP performed experiments; SY, PP, SP and VT analyzed the data; SY, PP and VT wrote the manuscript. All authors reviewed and approved the manuscript.
Funding
This study was supported by the Mahidol University research grant.
Availability of data and materials
All data generated or analyzed during this study are included in this published article and are available from the corresponding author on reasonable request.
Declarations
Conflict of interest
The authors declare no conflict of interest.
Ethical approval and consent to participate
Not applicable.
Consent for publication
Not applicable.
Footnotes
Publisher's Note
Springer Nature remains neutral with regard to jurisdictional claims in published maps and institutional affiliations.
References
- 1.Viljoen A, Chaudhry R, Bycroft J. Renal stones. Ann Clin Biochem. 2019;56(1):15–27. doi: 10.1177/0004563218781672. [DOI] [PubMed] [Google Scholar]
- 2.Bamberger JN, Blum KA, Kan KM, Parkhomenko E, Gallante B, Gupta M. Clinical and metabolic correlates of calcium oxalate stone subtypes: implications for etiology and management. J Endourol. 2019;33(9):755–760. doi: 10.1089/end.2019.0245. [DOI] [PubMed] [Google Scholar]
- 3.Kittanamongkolchai W, Vaughan LE, Enders FT, Dhondup T, Mehta RA, Krambeck AE, McCollough CH, Vrtiska TJ, Lieske JC, Rule AD. The changing incidence and presentation of urinary stones over 3 decades. Mayo Clin Proc. 2018;93(3):291–299. doi: 10.1016/j.mayocp.2017.11.018. [DOI] [PMC free article] [PubMed] [Google Scholar]
- 4.Thongprayoon C, Krambeck AE, Rule AD. Determining the true burden of kidney stone disease. Nat Rev Nephrol. 2020;16(12):736–746. doi: 10.1038/s41581-020-0320-7. [DOI] [PubMed] [Google Scholar]
- 5.Chewcharat A, Curhan G. Trends in the prevalence of kidney stones in the United States from 2007 to 2016. Urolithiasis. 2021;49(1):27–39. doi: 10.1007/s00240-020-01210-w. [DOI] [PubMed] [Google Scholar]
- 6.Kovacevic L, Caruso JA, Lu H, Kovacevic N, Lakshmanan Y, Carruthers NJ, Goldfarb DS. Urine proteomic profiling in patients with nephrolithiasis and cystinuria. Int Urol Nephrol. 2019;51(4):593–599. doi: 10.1007/s11255-018-2044-1. [DOI] [PMC free article] [PubMed] [Google Scholar]
- 7.Yang Y, Hong S, Li C, Zhang J, Hu H, Chen X, Jiang K, Sun F, Wang Q, Wang S. Proteomic analysis reveals some common proteins in the kidney stone matrix. PeerJ. 2021;9:e11872. doi: 10.7717/peerj.11872. [DOI] [PMC free article] [PubMed] [Google Scholar]
- 8.Fong-Ngern K, Peerapen P, Sinchaikul S, Chen ST, Thongboonkerd V. Large-scale identification of calcium oxalate monohydrate crystal-binding proteins on apical membrane of distal renal tubular epithelial cells. J Proteome Res. 2011;10(10):4463–4477. doi: 10.1021/pr2006878. [DOI] [PubMed] [Google Scholar]
- 9.Wang Z, Li MX, Xu CZ, Zhang Y, Deng Q, Sun R, Hu QY, Zhang SP, Zhang JW, Liang H. Comprehensive study of altered proteomic landscape in proximal renal tubular epithelial cells in response to calcium oxalate monohydrate crystals. BMC Urol. 2020;20(1):136. doi: 10.1186/s12894-020-00709-z. [DOI] [PMC free article] [PubMed] [Google Scholar]
- 10.Semangoen T, Sinchaikul S, Chen ST, Thongboonkerd V. Altered proteins in MDCK renal tubular cells in response to calcium oxalate dihydrate crystal adhesion: a proteomics approach. J Proteome Res. 2008;7(7):2889–2896. doi: 10.1021/pr800113k. [DOI] [PubMed] [Google Scholar]
- 11.Semangoen T, Sinchaikul S, Chen ST, Thongboonkerd V. Proteomic analysis of altered proteins in distal renal tubular cells in response to calcium oxalate monohydrate crystal adhesion: Implications for kidney stone disease. Proteom Clin Appl. 2008;2(7–8):1099–1109. doi: 10.1002/prca.200780136. [DOI] [PubMed] [Google Scholar]
- 12.Thongboonkerd V, Semangoen T, Sinchaikul S, Chen ST. Proteomic analysis of calcium oxalate monohydrate crystal-induced cytotoxicity in distal renal tubular cells. J Proteome Res. 2008;7(11):4689–4700. doi: 10.1021/pr8002408. [DOI] [PubMed] [Google Scholar]
- 13.Vinaiphat A, Aluksanasuwan S, Manissorn J, Sutthimethakorn S, Thongboonkerd V. Response of renal tubular cells to differential types and doses of calcium oxalate crystals: Integrative proteome network analysis and functional investigations. Proteomics. 2017;17(15–16):1700192. doi: 10.1002/pmic.201700192. [DOI] [PubMed] [Google Scholar]
- 14.Peerapen P, Chaiyarit S, Thongboonkerd V. Protein network analysis and functional studies of calcium oxalate crystal-induced cytotoxicity in renal tubular epithelial cells. Proteomics. 2018;18(8):e1800008. doi: 10.1002/pmic.201800008. [DOI] [PubMed] [Google Scholar]
- 15.Vinaiphat A, Thongboonkerd V. Prospects for proteomics in kidney stone disease. Expert Rev Proteom. 2017;14(3):185–187. doi: 10.1080/14789450.2017.1283222. [DOI] [PubMed] [Google Scholar]
- 16.Thongboonkerd V. Proteomics of crystal-cell interactions: a model for kidney stone research. Cells. 2019;8(9):1076. doi: 10.3390/cells8091076. [DOI] [PMC free article] [PubMed] [Google Scholar]
- 17.Peerapen P, Thongboonkerd V. Kidney stone proteomics: an update and perspectives. Expert Rev Proteom. 2021;18(7):557–569. doi: 10.1080/14789450.2021.1962301. [DOI] [PubMed] [Google Scholar]
- 18.Khamchun S, Sueksakit K, Chaiyarit S, Thongboonkerd V. Modulatory effects of fibronectin on calcium oxalate crystallization, growth, aggregation, adhesion on renal tubular cells, and invasion through extracellular matrix. J Biol Inorg Chem. 2019;24(2):235–246. doi: 10.1007/s00775-019-01641-w. [DOI] [PubMed] [Google Scholar]
- 19.Tanaka Y, Maruyama M, Okada A, Furukawa Y, Momma K, Sugiura Y, Tajiri R, Sawada KP, Tanaka S, Takano K, Taguchi K, Hamamoto S, Ando R, Tsukamoto K, Yoshimura M, Mori Y, Yasui T. Multicolor imaging of calcium-binding proteins in human kidney stones for elucidating the effects of proteins on crystal growth. Sci Rep. 2021;11(1):16841. doi: 10.1038/s41598-021-95782-1. [DOI] [PMC free article] [PubMed] [Google Scholar]
- 20.Fong-ngern K, Thongboonkerd V. Alpha-enolase on apical surface of renal tubular epithelial cells serves as a calcium oxalate crystal receptor. Sci Rep. 2016;6:36103. doi: 10.1038/srep36103. [DOI] [PMC free article] [PubMed] [Google Scholar]
- 21.Fong-ngern K, Sueksakit K, Thongboonkerd V. Surface heat shock protein 90 serves as a potential receptor for calcium oxalate crystal on apical membrane of renal tubular epithelial cells. J Biol Inorg Chem. 2016;21(4):463–474. doi: 10.1007/s00775-016-1355-x. [DOI] [PubMed] [Google Scholar]
- 22.Manissorn J, Singhto N, Thongboonkerd V. Characterizations of HSP90-interacting complex in renal cells using tandem affinity purification and its potential role in kidney stone formation. Proteomics. 2018;18(24):e1800004. doi: 10.1002/pmic.201800004. [DOI] [PubMed] [Google Scholar]
- 23.Antonova A, Hummel B, Khavaran A, Redhaber DM, Aprile-Garcia F, Rawat P, Gundel K, Schneck M, Hansen EC, Mitschke J, Mittler G, Miething C, Sawarkar R. Heat-shock protein 90 controls the expression of cell-cycle genes by stabilizing metazoan-specific host-cell factor HCFC1. Cell Rep. 2019;29(6):1645–1659 e1649. doi: 10.1016/j.celrep.2019.09.084. [DOI] [PubMed] [Google Scholar]
- 24.Maurizy C, Abeza C, Lemmers B, Gabola M, Longobardi C, Pinet V, Ferrand M, Paul C, Bremond J, Langa F, Gerbe F, Jay P, Verheggen C, Tinari N, Helmlinger D, Lattanzio R, Bertrand E, Hahne M, Pradet-Balade B. The HSP90/R2TP assembly chaperone promotes cell proliferation in the intestinal epithelium. Nat Commun. 2021;12(1):4810. doi: 10.1038/s41467-021-24792-4. [DOI] [PMC free article] [PubMed] [Google Scholar]
- 25.Sun P, Wang Y, Gao T, Li K, Zheng D, Liu A, Ni Y. Hsp90 modulates human sperm capacitation via the Erk1/2 and p38 MAPK signaling pathways. Reprod Biol Endocrinol. 2021;19(1):39. doi: 10.1186/s12958-021-00723-2. [DOI] [PMC free article] [PubMed] [Google Scholar]
- 26.Eisele F, Eisele-Burger AM, Hao X, Berglund LL, Hoog JL, Liu B, Nystrom T. An Hsp90 co-chaperone links protein folding and degradation and is part of a conserved protein quality control. Cell Rep. 2021;35(13):109328. doi: 10.1016/j.celrep.2021.109328. [DOI] [PubMed] [Google Scholar]
- 27.Zuehlke AD, Beebe K, Neckers L, Prince T. Regulation and function of the human HSP90AA1 gene. Gene. 2015;570(1):8–16. doi: 10.1016/j.gene.2015.06.018. [DOI] [PMC free article] [PubMed] [Google Scholar]
- 28.Hoter A, El-Sabban ME, Naim HY. The HSP90 family: structure, regulation, function, and implications in health and disease. Int J Mol Sci. 2018;19(9):2560. doi: 10.3390/ijms19092560. [DOI] [PMC free article] [PubMed] [Google Scholar]
- 29.Mader SL, Lopez A, Lawatscheck J, Luo Q, Rutz DA, Gamiz-Hernandez AP, Sattler M, Buchner J, Kaila VRI. Conformational dynamics modulate the catalytic activity of the molecular chaperone Hsp90. Nat Commun. 2020;11(1):1410. doi: 10.1038/s41467-020-15050-0. [DOI] [PMC free article] [PubMed] [Google Scholar]
- 30.Li T, Jiang HL, Tong YG, Lu JJ. Targeting the Hsp90-Cdc37-client protein interaction to disrupt Hsp90 chaperone machinery. J Hematol Oncol. 2018;11(1):59. doi: 10.1186/s13045-018-0602-8. [DOI] [PMC free article] [PubMed] [Google Scholar]
- 31.Schulze A, Beliu G, Helmerich DA, Schubert J, Pearl LH, Prodromou C, Neuweiler H. Cooperation of local motions in the Hsp90 molecular chaperone ATPase mechanism. Nat Chem Biol. 2016;12(8):628–635. doi: 10.1038/nchembio.2111. [DOI] [PMC free article] [PubMed] [Google Scholar]
- 32.Xu W, Beebe K, Chavez JD, Boysen M, Lu Y, Zuehlke AD, Keramisanou D, Trepel JB, Prodromou C, Mayer MP, Bruce JE, Gelis I, Neckers L. Hsp90 middle domain phosphorylation initiates a complex conformational program to recruit the ATPase-stimulating cochaperone Aha1. Nat Commun. 2019;10(1):2574. doi: 10.1038/s41467-019-10463-y. [DOI] [PMC free article] [PubMed] [Google Scholar]
- 33.Lopez A, Elimelech AR, Klimm K, Sattler M. The charged linker modulates the conformations and molecular interactions of Hsp90. ChemBioChem. 2021;22(6):1084–1092. doi: 10.1002/cbic.202000699. [DOI] [PMC free article] [PubMed] [Google Scholar]
- 34.Bhatia S, Diedrich D, Frieg B, Ahlert H, Stein S, Bopp B, Lang F, Zang T, Kroger T, Ernst T, Kogler G, Krieg A, Ludeke S, Kunkel H, Rodrigues Moita AJ, Kassack MU, Marquardt V, Opitz FV, Oldenburg M, Remke M, Babor F, Grez M, Hochhaus A, Borkhardt A, Groth G, Nagel-Steger L, Jose J, Kurz T, Gohlke H, Hansen FK, Hauer J. Targeting HSP90 dimerization via the C terminus is effective in imatinib-resistant CML and lacks the heat shock response. Blood. 2018;132(3):307–320. doi: 10.1182/blood-2017-10-810986. [DOI] [PMC free article] [PubMed] [Google Scholar]
- 35.Bhattacharya K, Weidenauer L, Luengo TM, Pieters EC, Echeverria PC, Bernasconi L, Wider D, Sadian Y, Koopman MB, Villemin M, Bauer C, Rudiger SGD, Quadroni M, Picard D. The Hsp70-Hsp90 co-chaperone Hop/Stip1 shifts the proteostatic balance from folding towards degradation. Nat Commun. 2020;11(1):5975. doi: 10.1038/s41467-020-19783-w. [DOI] [PMC free article] [PubMed] [Google Scholar]
- 36.Criado-Marrero M, Gebru NT, Blazier DM, Gould LA, Baker JD, Beaulieu-Abdelahad D, Blair LJ. Correction to: Hsp90 cochaperones, FKBP52 and Aha1, promote tau pathogenesis in aged wildtype mice. Acta Neuropathol Commun. 2021;9(1):85. doi: 10.1186/s40478-021-01188-5. [DOI] [PMC free article] [PubMed] [Google Scholar]
- 37.Storkanova H, Oreska S, Spiritovic M, Hermankova B, Bubova K, Komarc M, Pavelka K, Vencovsky J, Distler JHW, Senolt L, Becvar R, Tomcik M. Plasma Hsp90 levels in patients with systemic sclerosis and relation to lung and skin involvement: a cross-sectional and longitudinal study. Sci Rep. 2021;11(1):1. doi: 10.1038/s41598-020-79139-8. [DOI] [PMC free article] [PubMed] [Google Scholar]
- 38.Park JM, Kim YJ, Park S, Park M, Farrand L, Nguyen CT, Ann J, Nam G, Park HJ, Lee J, Kim JY, Seo JH. A novel HSP90 inhibitor targeting the C-terminal domain attenuates trastuzumab resistance in HER2-positive breast cancer. Mol Cancer. 2020;19(1):161. doi: 10.1186/s12943-020-01283-6. [DOI] [PMC free article] [PubMed] [Google Scholar]
- 39.Wyler E, Mosbauer K, Franke V, Diag A, Gottula LT, Arsie R, Klironomos F, Koppstein D, Honzke K, Ayoub S, Buccitelli C, Hoffmann K, Richter A, Legnini I, Ivanov A, Mari T, Del Giudice S, Papies J, Praktiknjo S, Meyer TF, Muller MA, Niemeyer D, Hocke A, Selbach M, Akalin A, Rajewsky N, Drosten C, Landthaler M. Transcriptomic profiling of SARS-CoV-2 infected human cell lines identifies HSP90 as target for COVID-19 therapy. iScience. 2021;24(3):102151. doi: 10.1016/j.isci.2021.102151. [DOI] [PMC free article] [PubMed] [Google Scholar]
- 40.Aluksanasuwan S, Peerapen P, Plumworasawat S, Manissorn J, Thongboonkerd V. Highly effective methods for expression/purification of recombinant human HSP90 and its four distinct (N-LR-M-C) domains. Anal Biochem. 2020;590:113518. doi: 10.1016/j.ab.2019.113518. [DOI] [PubMed] [Google Scholar]
- 41.Sueksakit K, Thongboonkerd V. Protective effects of finasteride against testosterone-induced calcium oxalate crystallization and crystal-cell adhesion. J Biol Inorg Chem. 2019;24(7):973–983. doi: 10.1007/s00775-019-01692-z. [DOI] [PubMed] [Google Scholar]
- 42.Peerapen P, Thongboonkerd V. Caffeine prevents kidney stone formation by translocation of apical surface annexin A1 crystal-binding protein into cytoplasm: In vitro evidence. Sci Rep. 2016;6:38536. doi: 10.1038/srep38536. [DOI] [PMC free article] [PubMed] [Google Scholar]
- 43.Manissorn J, Fong-ngern K, Peerapen P, Thongboonkerd V. Systematic evaluation for effects of urine pH on calcium oxalate crystallization, crystal-cell adhesion and internalization into renal tubular cells. Sci Rep. 2017;7(1):1798. doi: 10.1038/s41598-017-01953-4. [DOI] [PMC free article] [PubMed] [Google Scholar]
- 44.Amimanan P, Tavichakorntrakool R, Fong-ngern K, Sribenjalux P, Lulitanond A, Prasongwatana V, Wongkham C, Boonsiri P, Umka WJ, Thongboonkerd V. Elongation factor Tu on Escherichia coli isolated from urine of kidney stone patients promotes calcium oxalate crystal growth and aggregation. Sci Rep. 2017;7(1):2953. doi: 10.1038/s41598-017-03213-x. [DOI] [PMC free article] [PubMed] [Google Scholar]
- 45.Kanlaya R, Naruepantawart O, Thongboonkerd V. Flagellum is responsible for promoting effects of viable Escherichia coli on calcium oxalate crystallization, crystal growth, and crystal aggregation. Front Microbiol. 2019;10:2507. doi: 10.3389/fmicb.2019.02507. [DOI] [PMC free article] [PubMed] [Google Scholar]
- 46.Thongboonkerd V, Semangoen T, Chutipongtanate S. Factors determining types and morphologies of calcium oxalate crystals: Molar concentrations, buffering, pH, stirring and temperature. Clin Chim Acta. 2006;367(1–2):120–131. doi: 10.1016/j.cca.2005.11.033. [DOI] [PubMed] [Google Scholar]
- 47.Thongboonkerd V, Chutipongtanate S, Semangoen T, Malasit P. Urinary trefoil factor 1 is a novel potent inhibitor of calcium oxalate crystal growth and aggregation. J Urol. 2008;179(4):1615–1619. doi: 10.1016/j.juro.2007.11.041. [DOI] [PubMed] [Google Scholar]
- 48.Chaiyarit S, Thongboonkerd V. Defining and systematic analyses of aggregation indices to evaluate degree of calcium oxalate crystal aggregation. Front Chem. 2017;5:113. doi: 10.3389/fchem.2017.00113. [DOI] [PMC free article] [PubMed] [Google Scholar]
- 49.Khamchun S, Yoodee S, Thongboonkerd V. Dual modulatory effects of diosmin on calcium oxalate kidney stone formation processes: Crystallization, growth, aggregation, crystal-cell adhesion, internalization into renal tubular cells, and invasion through extracellular matrix. Biomed Pharmacother. 2021;141:111903. doi: 10.1016/j.biopha.2021.111903. [DOI] [PubMed] [Google Scholar]
- 50.Peerapen P, Thongboonkerd V. Differential bound proteins and adhesive capabilities of calcium oxalate monohydrate crystals with various sizes. Int J Biol Macromol. 2020;163:2210–2223. doi: 10.1016/j.ijbiomac.2020.09.085. [DOI] [PubMed] [Google Scholar]
- 51.Vinaiphat A, Thongboonkerd V. Characterizations of PMCA2-interacting complex and its role as a calcium oxalate crystal-binding protein. Cell Mol Life Sci. 2018;75(8):1461–1482. doi: 10.1007/s00018-017-2699-2. [DOI] [PMC free article] [PubMed] [Google Scholar]
- 52.Chiangjong W, Thongboonkerd V. A novel assay to evaluate promoting effects of proteins on calcium oxalate crystal invasion through extracellular matrix based on plasminogen/plasmin activity. Talanta. 2012;101:240–245. doi: 10.1016/j.talanta.2012.09.019. [DOI] [PubMed] [Google Scholar]
- 53.Chiangjong W, Thongboonkerd V. Calcium oxalate crystals increased enolase-1 secretion from renal tubular cells that subsequently enhanced crystal and monocyte invasion through renal interstitium. Sci Rep. 2016;6:24064. doi: 10.1038/srep24064. [DOI] [PMC free article] [PubMed] [Google Scholar]
- 54.Roop-ngam P, Chaiyarit S, Pongsakul N, Thongboonkerd V. Isolation and characterizations of oxalate-binding proteins in the kidney. Biochem Biophys Res Commun. 2012;424(3):629–634. doi: 10.1016/j.bbrc.2012.07.015. [DOI] [PubMed] [Google Scholar]
- 55.Alelign T, Petros B. Kidney stone disease: an update on current concepts. Adv Urol. 2018;2018:3068365. doi: 10.1155/2018/3068365. [DOI] [PMC free article] [PubMed] [Google Scholar]
- 56.Wang Z, Zhang Y, Zhang J, Deng Q, Liang H. Recent advances on the mechanisms of kidney stone formation (review) Int J Mol Med. 2021;48(2):149. doi: 10.3892/ijmm.2021.4982. [DOI] [PMC free article] [PubMed] [Google Scholar]
- 57.Kletzmayr A, Mulay SR, Motrapu M, Luo Z, Anders HJ, Ivarsson ME, Leroux JC. Inhibitors of calcium oxalate crystallization for the treatment of oxalate nephropathies. Adv Sci (Weinh) 2020;7(8):1903337. doi: 10.1002/advs.201903337. [DOI] [PMC free article] [PubMed] [Google Scholar]
- 58.Rimer JD, Kolbach-Mandel AM, Ward MD, Wesson JA. The role of macromolecules in the formation of kidney stones. Urolithiasis. 2017;45(1):57–74. doi: 10.1007/s00240-016-0948-8. [DOI] [PMC free article] [PubMed] [Google Scholar]
- 59.Tian Y, Tirrell M, Davis C, Wesson JA. Protein primary structure correlates with calcium oxalate stone matrix preference. PLoS ONE. 2021;16(9):e0257515. doi: 10.1371/journal.pone.0257515. [DOI] [PMC free article] [PubMed] [Google Scholar]
- 60.Wolf MTF, Zhang J, Nie M. Uromodulin in mineral metabolism. Curr Opin Nephrol Hypertens. 2019;28(5):481–489. doi: 10.1097/MNH.0000000000000522. [DOI] [PMC free article] [PubMed] [Google Scholar]
- 61.Kolbach-Mandel AM, Kleinman JG, Wesson JA. Exploring calcium oxalate crystallization: a constant composition approach. Urolithiasis. 2015;43(5):397–409. doi: 10.1007/s00240-015-0781-5. [DOI] [PMC free article] [PubMed] [Google Scholar]
- 62.Farmanesh S, Chung J, Sosa RD, Kwak JH, Karande P, Rimer JD. Natural promoters of calcium oxalate monohydrate crystallization. J Am Chem Soc. 2014;136(36):12648–12657. doi: 10.1021/ja505402r. [DOI] [PubMed] [Google Scholar]
- 63.Sun XY, Xu M, Ouyang JM. Effect of crystal shape and aggregation of calcium oxalate monohydrate on cellular toxicity in renal epithelial cells. ACS Omega. 2017;2(9):6039–6052. doi: 10.1021/acsomega.7b00510. [DOI] [PMC free article] [PubMed] [Google Scholar]
- 64.Khan SR, Pearle MS, Robertson WG, Gambaro G, Canales BK, Doizi S, Traxer O, Tiselius HG. Kidney stones. Nat Rev Dis Primers. 2016;2:16008. doi: 10.1038/nrdp.2016.8. [DOI] [PMC free article] [PubMed] [Google Scholar]
- 65.Viswanathan P, Rimer JD, Kolbach AM, Ward MD, Kleinman JG, Wesson JA. Calcium oxalate monohydrate aggregation induced by aggregation of desialylated Tamm-Horsfall protein. Urol Res. 2011;39(4):269–282. doi: 10.1007/s00240-010-0353-7. [DOI] [PMC free article] [PubMed] [Google Scholar]
- 66.Yang B, Lu X, Li Y, Li Y, Yu D, Zhang W, Duan C, Taguchi K, Yasui T, Kohri K, Gao B. A Proteomic network approach across the kidney stone disease reveals endoplasmic reticulum stress and crystal-cell interaction in the kidney. Oxid Med Cell Longev. 2019;2019:9307256. doi: 10.1155/2019/9307256. [DOI] [PMC free article] [PubMed] [Google Scholar]
- 67.Kanlaya R, Sintiprungrat K, Chaiyarit S, Thongboonkerd V. Macropinocytosis is the major mechanism for endocytosis of calcium oxalate crystals into renal tubular cells. Cell Biochem Biophys. 2013;67(3):1171–1179. doi: 10.1007/s12013-013-9630-8. [DOI] [PubMed] [Google Scholar]
- 68.Chaiyarit S, Singhto N, Thongboonkerd V. Calcium oxalate monohydrate crystals internalized into renal tubular cells are degraded and dissolved by endolysosomes. Chem Biol Interact. 2016;246:30–35. doi: 10.1016/j.cbi.2015.12.018. [DOI] [PubMed] [Google Scholar]
- 69.Chakraborty A, Boel NM, Edkins AL. HSP90 Interacts with the fibronectin N-terminal domains and increases matrix formation. Cells. 2020;9(2):272. doi: 10.3390/cells9020272. [DOI] [PMC free article] [PubMed] [Google Scholar]
- 70.Halper J. Basic components of connective tissues and extracellular matrix: fibronectin, fibrinogen, laminin, elastin, fibrillins, fibulins, matrilins, tenascins and thrombospondins. Adv Exp Med Biol. 2021;1348:105–126. doi: 10.1007/978-3-030-80614-9_4. [DOI] [PubMed] [Google Scholar]
Associated Data
This section collects any data citations, data availability statements, or supplementary materials included in this article.
Supplementary Materials
Data Availability Statement
All data generated or analyzed during this study are included in this published article and are available from the corresponding author on reasonable request.