ABSTRACT
Fluid shear stress (FSS) regulates the metastasis of hepatocellular carcinoma (HCC), but the role of the RhoA-YAP1-autophagy pathway in HCC remains unclear. Due to the core role of liver cancer stem cells (LCSCs) in HCC metastasis and recurrence, we explored the RhoA-YAP1-autophagy pathway in LCSCs under FSS. Our results indicate that LCSCs have stronger proliferation and cell spheroidization abilities. FSS (1 dyn/cm2) upregulated the migration of LCSCs and autophagy protein markers, inducing LC3B aggregation and autophagosome formation in LCSCs. Mechanistically, FSS promoted YAP1 dephosphorylation and transport to the nucleus, which is mediated by RhoA, inducing autophagy. Finally, inhibition of autophagy suppressed cell migration in LCSCs under FSS. In conclusion, FSS promoted the migration of LCSCs via the RhoA-YAP1-autophagy pathway.
KEYWORDS: Fluid shear stress, autophagy, LCSCs, migration
Introduction
Hepatocellular carcinoma (HCC) is a common clinical malignant tumor accounting for approximately 85–90% of all primary liver cancers. It is a serious threat to human life and health [1]. Early liver cancer can be treated by resection (including liver transplantation) combined with radiotherapy, chemotherapy, and other methods to achieve better therapeutic effects. Late liver cancer results in poor treatment effects due to cancer cell metastasis and spread [2]. Cancer stem cells, also known as tumor-initiating cells, are a subgroup that maintains the vitality of tumor cell populations through self-renewal and infinite proliferation. Cancer stem cells have a variety of drug-resistant molecules and resistance and tolerance to external physical and chemical factors [3]. The migration and invasion of liver cancer stem cells (LCSCs) play a key role in the metastasis and spread of liver cancer and the recurrence of liver cancer after surgical resection (including liver transplantation) [4]. Therefore, exploring the molecular mechanism and key regulatory factors of LCSC migration is of great significance for the development of effective drug targets, reducing the metastasis and recurrence of liver cancer, and improving the survival rate of patients.
Biological and chemical factors in the tumor microenvironment regulate the migration and movement of tumor cells, but the mechanical stimulation (fluid shear stress, pressure, etc.) in this microenvironment also has an important regulatory effect on tumor cell migration and invasion. In normal liver tissue, the fluid shear stress (FSS) generated by the flow of interstitial fluid is less than 0.1 dyn/cm2. In HCC, tissue reorganization leads to changes in the biophysical microenvironment, and the mechanical hardness and pressure are significantly higher than in normal liver tissue [5]. The elevated pressure gradient drives the interstitial fluid to flow through the tumor tissue interstitium. HCC tissue has abundant blood vessels and high permeability, a faster interstitial flow rate, and a higher level of FSS. FSS promotes the malignant progression and metastasis of HCC. Studies have shown that in solid tumors, the FSS in the interstitial flow is about 0.1–1 dyn/cm2, while it is about 0.64–12 dyn/cm2 in the lymphatic vessels, in the arteries of the solid tumor it is about 4–30 dyn/cm2, in the vein it is about 1–4 dyn/cm2, and in the capillaries, it is about 10–20 dyn/cm2 [5]. Previous studies have shown that FSS induces cytoskeletal rearrangement, activates the expression of matrix metalloproteinases, and induces the migration and invasion of liver cancer cells. Our previous published work proved that FSS induces the migration of liver cancer cells and is related to autophagy [6,7].
Eukaryotic cells respond to external stimuli through the eukaryotic endomembrane system (EMS), which includes the endoplasmic reticulum, Golgi apparatus, and various vesicles transported between them, to maintain cell physiological functions [8]. Both exosomes and autophagosomes are microvesicles that play an important role in stress adaptation and maintaining homeostasis. The two components are closely related [9], sharing part of the occurrence and regulation mechanisms [10]. Autophagosomes can be detected by transmission electron microscopy(TEM), the typical structure of autophagosome is two visible limiting membranes without ribosomes [11,12].
Autophagy is a biological process in which autophagosomes are formed in the cytoplasm of cells, bind to lysosomes after encapsulating autophagic substrates, and then are degraded. The formation of a double-layered membrane autophagosome structure is the most typical feature of autophagy. Autophagy plays a ‘double-edged sword’ role in tumor progression [13], autophagic LC3B overexpression is known as a prognosticator of a poor outcome in hepatocarcinoma [14]. Autophagy can be induced by many factors, such as energy deficiency, oxidative stress, protein folding errors, or aggregation [15]. Our previous studies have shown that FSS can induce autophagy in liver cancer cells [6], but its specific mechanism is still unclear.
YAP (yes-associated protein) is the core molecule of the Hippo signaling pathway. It is a multifunctional cell junction protein and transcriptional co-activator with two subtypes (YAP1 and YAP2). The core mechanism of the Hippo signaling pathway is that Mst1/2 protein kinase phosphorylates and activates the downstream kinase Lats1/2 and then phosphorylates the transcriptional coactivator YAP/TAZ, which traps them in the cytoplasm and promotes their degradation [16]. Recent studies have confirmed that the Hippo signaling pathway is involved in the transduction of mechanical signals and YAP is a novel mechanoreceptive factor that transduces mechanical stimulation signals [17]. When cells grow on a hard matrix, adhesion plaques form, which inhibit the activation of Rap2, activate RhoA, and promote the nuclear localization of YAP/TAZ [18]. In vascular endothelial cells, the Integrin-YAP/TAZ-JNK cascade regulates the protective effect of unidirectional FSS on atherosclerosis [16].
This research focuses on liver cancer stem cells, and aims to study the role of the RhoA-YAP1-autophagy pathway in the migration of liver cancer stem cells under FSS.
Results
FSS promoted the migration of LCSCs
First, we successfully sorted CD133+ Huh7 cells by a magnetic bead sorting system and found that their CD133 expression level (Figure 1a), proliferation ability (Figure 1d), spheroidization ability, and clone formation ability (Figure 1bandc) were enhanced.
Figure 1.
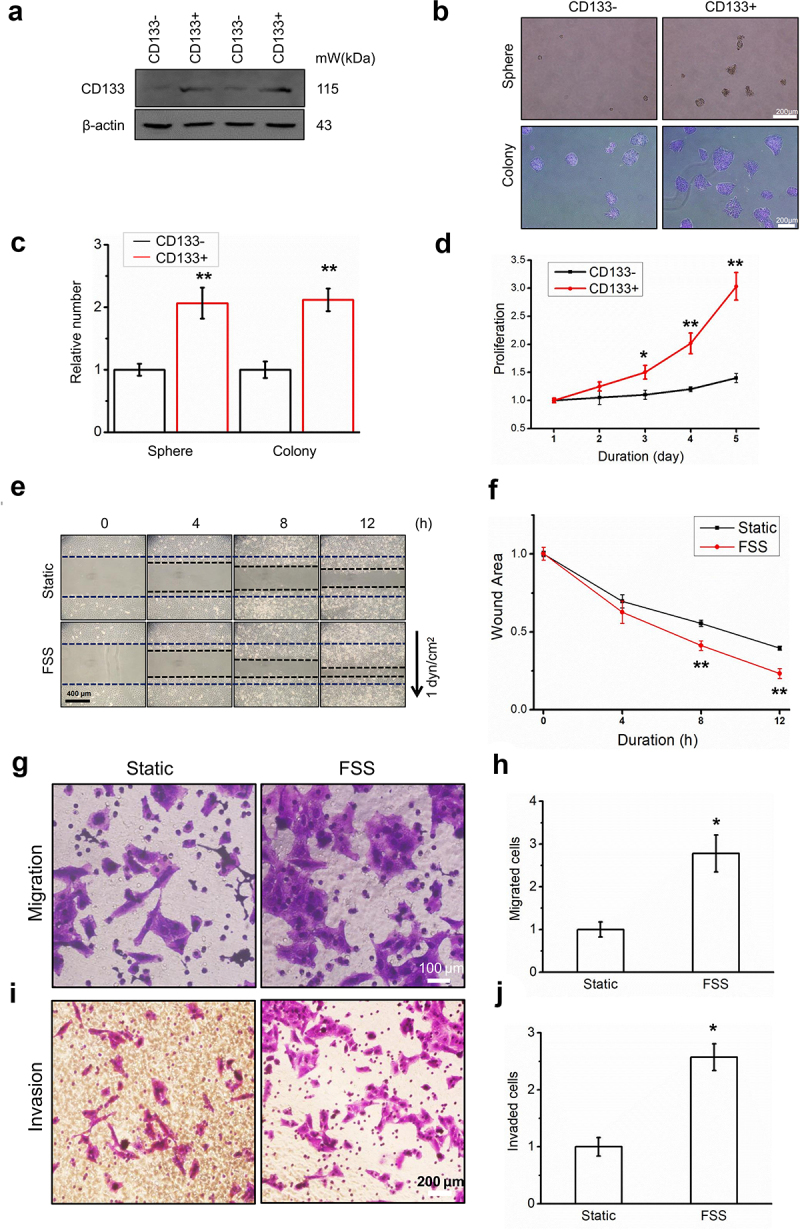
FSS promoted the migration of LCSCs. (a) Huh7 was sorted by CD133 positive magnetic beads, and the CD133 protein expression of the sorted cells was analyzed by Western blot. (b-c) Spheroid and colony formation assay of CD133- and CD133+ Huh7 cells. Scale bar = 200 μm. Relative number of cell spheres and clone formation. (d) Cell proliferation of CD133- and CD133+ Huh7 cells was detected by CCK8. (e-f) Migration of LCSCs in static and FSS group (1 dyn/cm2) was detected by wound healing assay. The arrow indicates the direction of FSS. Scale bar = 400 μm. (g-j) Migration and invasion of LCSCs in static and FSS group (1 dyn/cm2) was detected by Transwell assay. Scale bar = 100 or 200 μm. Results are shown as means ± SD (n = 3). Data is expressed as the median with interquartile range; Data obtained from different treatment groups were statistically compared with one-way ANOVA followed by Tukey’s test. *P < 0.05, compared with control. **P < 0.01, compared with control.
Using fluid shear stress, we found that the migration (Figure 1e-h) and invasion abilities (Figure 1i-j) of CD133+ tumor stem cells were significantly enhanced. These results illustrate that FSS promoted the migration of CD133+ Huh7 cells.
FSS induced autophagy in LCSCs
To verify the changes in autophagy level of LCSCs under fluid shear stress, we first used WB to detect the expression of the autophagy molecular marker LC3B-II/I and autophagy substrate p62. We found that the ratio of LC3B-II/I increased significantly (Figure 2aandb) and the expression level of p62 decreased (Figure 2aandc) after FSS application. The ratio of LC3B-II/I was further increased by using Bafilomycin A1, p62 expression were reversed by Bafilomycin A1 (Figure 2aandc), suggested that FSS activated autophagy flux.
Figure 2.
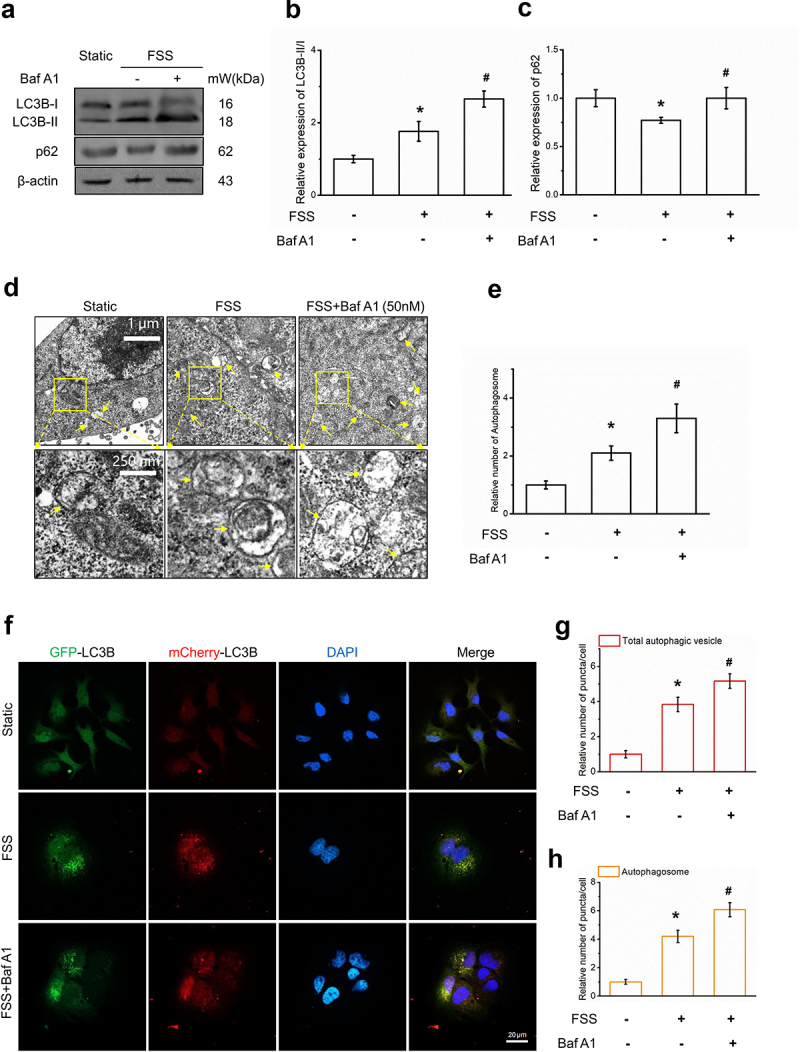
FSS induced autophagy in LCSCs. (a-c) Protein expression of autophagy molecular markers LC3B and p62 in static and FSS group (1 dyn/cm2) was detected by Western blot. (d-e) The formation of autophagosome was detected by transmission electron microscope (TEM). Yellow arrows indicate autophagosomes with typical structures. Scale bar = 1 μm. (f-h) LCSCs were transfected with the Ad-Plus-mCherryGFP-LC3B, LC3B punctate dots was detected by Confocal laser scanning microscope. Scale bar = 20 μm. Results are shown as means ± SD(n = 3). *P < 0.05, compared with static group. **P < 0.01, compared with static group. #P < 0.05, compared with FSS group.
To detect autophagosomes formation, we observed the LC3B punctate dots and autophagic vacuoles by confocal microscopy and TEM. LCSCs transfected with the AdPlus-mCherry-GFP-LC3B and LC3B punctate dots in the cytoplasm were significantly increased by application of 1 dyn/cm2 FSS for 30 min (Figure 2d-e,). Also, FSS significantly induced the formation of autophagic vacuoles compared with the static control (figure 2f-g). These results suggested that FSS at 1 dyn/cm2 for 30 min induced autophagy in LCSCs.
YAP1 mediated FSS-induced autophagy in LCSCs
Using the TCGA and GSE112790 databases, we found that YAP1 expression was correlated with the mRNA level of the autophagy molecular marker ATG5 (Figure 3aandc). The expression of YAP1 was correlated with the mRNA level of autophagy molecular marker LC3B (Figure 3bandd). These results suggest that YAP1 may be related to the autophagy of hepatocellular carcinoma cells.
Figure 3.
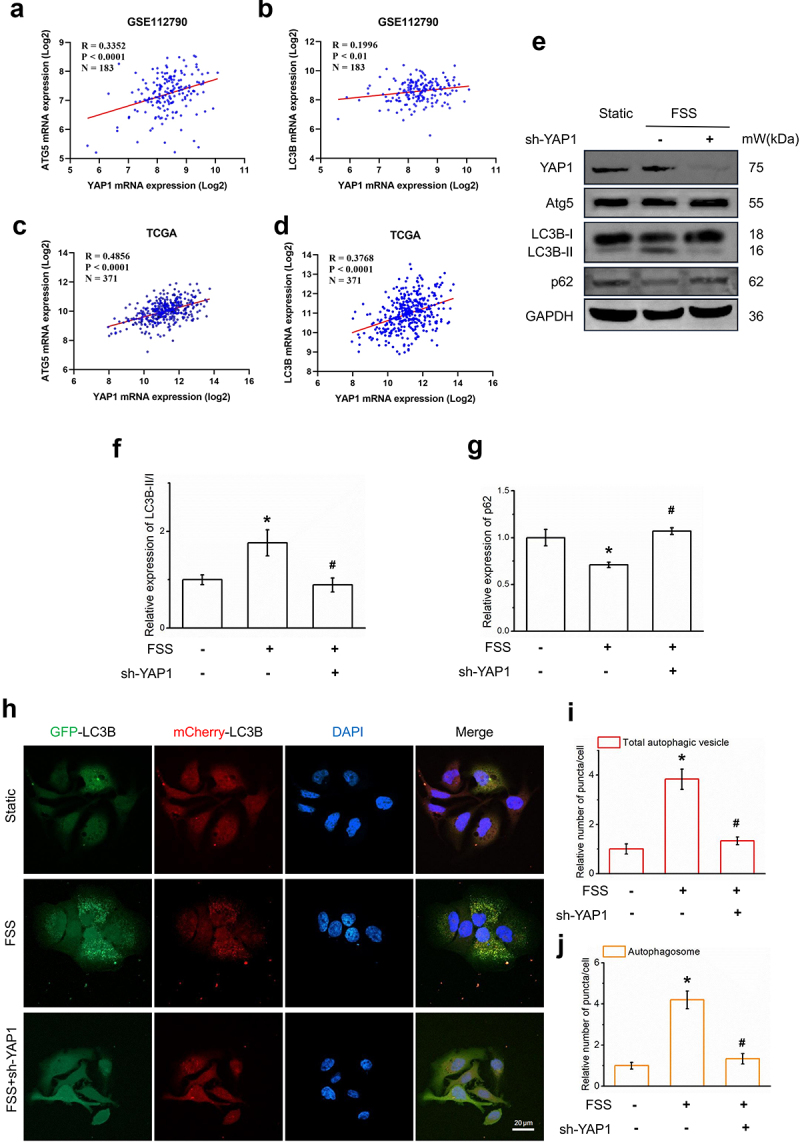
YAP1 mediated FSS-induced autophagy in LCSCs. (a-d) Scatter diagram of YAP1 mRNA expression(log2) and ATG5/LC3B mRNA expression(log2) in GSE112790 and TCGA. (e-g) Protein expression of autophagy molecular markers LC3B and p62, YAP1, Atg5 in static, FSS, FSS+sh-YAP1 group was detected by Western blot. (h-j) LCSCs were transfected with the AdPlus-mCherryGFP-LC3B, LC3B punctate dots was detected by confocal microscopy in static, FSS, FSS+sh-YAP1 group. Scale bar = 20 μm.
To verify the regulatory effect of YAP1 on autophagy, we constructed a YAP1 knockdown cell line using YAP1-shRNA. We used CD133+ Huh7 cells to detect the expression of autophagy molecular marker LC3B and autophagy substrate p62 after gene knockdown of YAP1. We found that the ratio of LC3B-II/I I decreased significantly (Figure 3eandf) and the expression level of p62 increased significantly. LCSCs were transfected with the adPlus-mCherry-GFP-LC3B. LC3B punctate dots in the cytoplast were significantly increased by 1 dyn/cm2 FSS for 30 mins (Figure 3j). In general, YAP1 mediated FSS-induced autophagy in LCSCs.
RhoA-YAP1-mediated FSS-induced autophagy in LCSCs
Using the TCGA database, we found that the expression of RhoA in HCC tissue was higher than in normal tissue. RhoA expression was correlated with the mRNA level of the autophagy molecular marker ATG5 (Figure 4b) and the mRNA level of autophagy molecular marker LC3B (Figure 4c). The survival curves of the RhoA low-expression and high-expression groups were statistically different (Figure 4d). We used gene set enrichment analysis (GSEA) and found that RhoA high expression was significantly enriched in autophagy-related gene clusters (Figure 4e). These results suggest that RhoA may be related to the autophagy of hepatocellular carcinoma cells.
Figure 4.
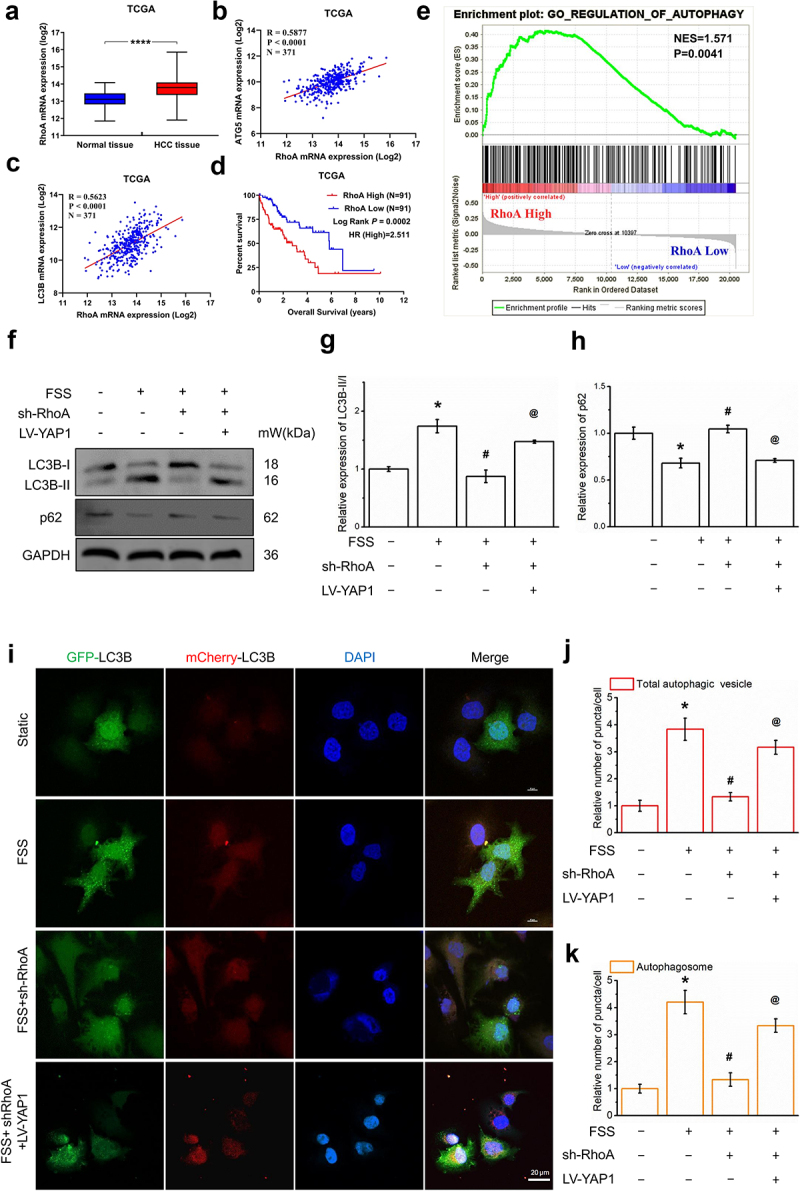
RhoA-YAP1 mediated FSS-induced autophagy in LCSCs (a) RhoA mRNA expression(log2) in normal tissue and HCC tissue. (b-c) Scatter diagram of RhoA mRNA expression(log2) and ATG5/LC3BmRNA expression(log2) in TCGA. (d) Effects of RhoA expression on overall survival of HCC patients from TCGA. Kaplan–Meier analysis and log-rank test were used. (e) Gene Set Enrichment analysis (GAEA) of RhoA on autophagy. Data from TCGA. (f-h) Protein expression of autophagy molecular markers LC3B and p62, RhoA, YAP1, Atg5 in static, FSS, FSS+sh-RhoA, FSS+sh-RhoA+LV-YAP1 group was detected by Western blot. (i-k) LCSCs were transfected with the AdPlus-mCherryGFP-LC3B, LC3B punctate dots was analyzed by confocal microscopy in static, FSS, FSS+sh-RhoA, FSS+sh-RhoA+LV-YAP1 group. Scale bar = 20 μm. Results are shown as means ± SD(n = 4). *P < 0.05, compared with static group. **P < 0.01, compared with static group. #P < 0.05, compared with FSS group. @P < 0.05, compared with FSS+sh-RhoA group.
We constructed a RhoA knockdown cell line using RhoA-shRNA to verify the regulatory effect of RhoA on autophagy. We detected the expression of autophagy molecular marker LC3B and autophagy substrate p62 after gene knockdown of RhoA. The results show that the ratio of LC3B-II/I decreased significantly (figure 4f-h) and the expression level of p62 increased significantly after gene knockdown of RhoA. We constructed YAP1 overexpressing LCSCs. The expression of the autophagy molecular marker was reversed by YAP1 overexpression (figure 4f-h).
In addition, LCSCs were transfected with adPlus-mcherry-GFP-LC3B. LC3B punctate dots in the cytoplast were significantly increased by 1 dyn/cm2 FSS for 30 mins (Figure 4j-l), which is downregulated by RhoA-shRNA and reversed by LV-YAP1. In general, the RhoA-YAP1 signal-regulated FSS-induced autophagy in LCSCs.
FSS promoted the migration of LCSCs via the RhoA-YAP1-autophagy pathway
To further verify the regulatory effect of RhoA on YAP1 entering the nucleus, we separated the nucleus and cytoplasm and detected RhoA, YAP1, and p-YAP1 expression in the nucleus and cytoplasm, respectively. The results showed that under fluid shear stress, p-YAP1 in the cytoplasm decreased and the level of YAP1 in the nucleus increased (Figure 5a-c), indicating that the FSS-induced dephosphorylation of p-YAP1 promotes nuclear entry. This trend can be reversed by sh-RhoA (Figure 5a-c), suggesting that RhoA regulates FSS-induced YAP1 nuclear entry.
Figure 5.
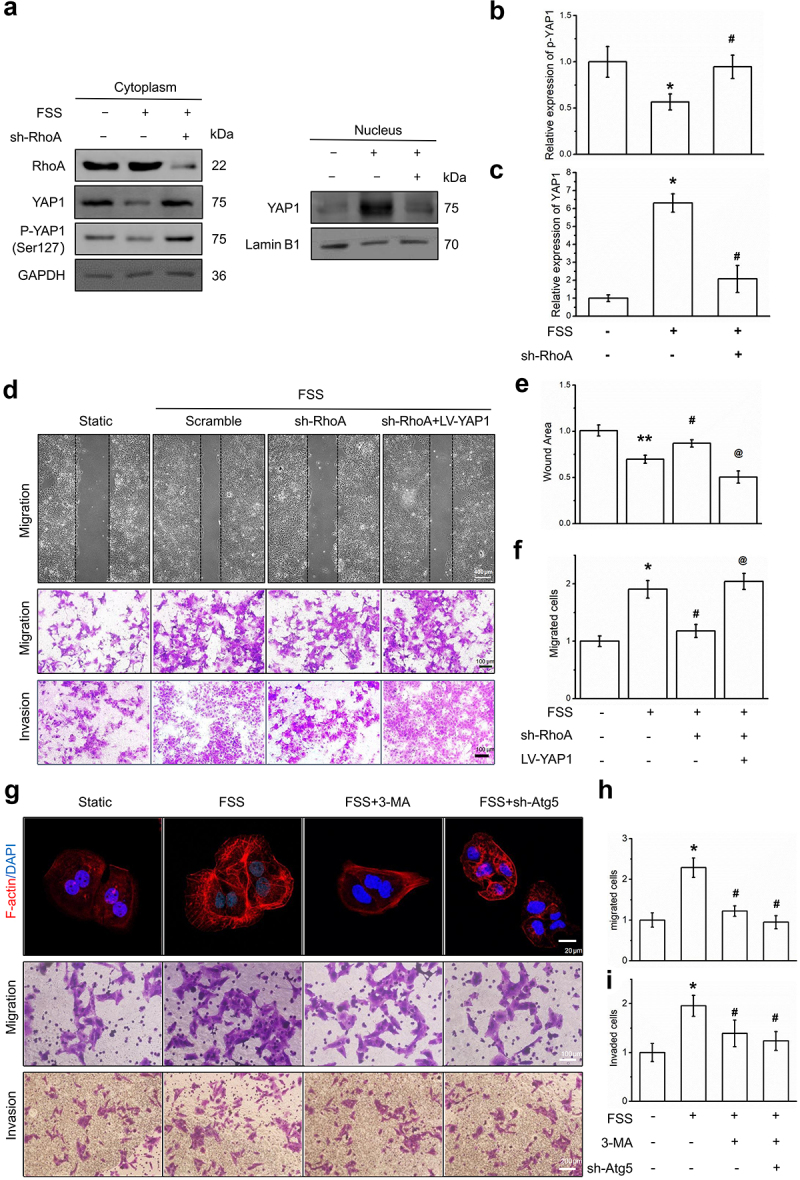
FSS promoted the migration of LCSCs via RhoA-YAP1-autophagy pathway. (a-c) Protein expression of RhoA, YAP1, p-YAP1 was detected by Western blot. (d-f) Migration and invasion of LCSCs was detected by Wound healing or Transwell assay. Scale bar = 100 μm. (g-i) The cytoskeleton was visualized by Texas Red staining. Migration and invasion of LCSCs was detected by Transwell assay. Scale bar = 100 or 200 μm. Results are shown as means ± SD(n = 3). *P < 0.05, compared with static group. **P < 0.01, compared with static group. #P < 0.05, compared with FSS group. @P < 0.05, compared with FSS+sh-RhoA group.
Using cell scratch experiments and Transwell cell migration and invasion experiments, we found that FSS-induced cell migration (Figure 5d) was significantly reduced after RhoA knockdown. However, after YAP1 overexpression, cell migration and invasion were restored (Figure 5d). These results indicate that fluid shear stress induces the migration of LCSCs through RhoA-YAP1.
Finally, we used the autophagy-specific inhibitors 3-MA and Atg-shRNA to inhibit autophagy. Autophagy inhibition reversed the remodeling of the cell microfilament skeleton induced by FSS and inhibited autophagy weakened FSS-induced cell migration and invasion of LCSCs.
Discussion
In China, over 37,000 people die of liver cancer per year, causing serious health and economic burden [1,17]. The mechanical factors in the oncological microenvironment regulate the migration and invasion of liver cancer cells. In this study, we studied the molecular mechanism of the migration and invasion of hepatocellular carcinoma cells induced by FSS. We found that autophagy regulated by RhoA-YAP1 mediates the migration and invasion of liver cancer stem cells induced by FSS.
Previous studies have confirmed that fluid shear stress can induce changes in the motility of a variety of cells, including endothelial cells [19,20]. Among them, the small G protein plays an important role in transducing mechanical signals [21]. Our previous studies have confirmed that members of the small G protein family (RhoA, Rac1, and Cdc42) mediate the migration of vascular endothelial cells and HCC cell lines induced by FSS. Here we found RhoA expression of HCC tissues was higher than in normal tissue. The expression of RhoA was correlated with the mRNA level of the autophagy molecular marker ATG5 (Figure 4b) and the mRNA level of autophagy molecular marker LC3B (Figure 4c). In addition, the survival curves of the RhoA low-expression group and high-expression group were statistically different. By using gene set enrichment analysis (GSEA), we found that RhoA high expression was significantly enriched in autophagy-related gene clusters. These results suggest that RhoA may be related to the autophagy of HCC cells. We constructed a RhoA knockdown cell line using RhoA-shRNA. We detected the expression of autophagy molecular marker LC3B and autophagy substrate p62 after gene knockdown of RhoA. The results show that the ratio of LC3B-II/I decreased significantly (figure 4f-h) and the p62 expression increased significantly after RhoA gene knockdown.
Previous studies have focused on the regulation of small G protein family members on the cytoskeletal system and cell motility. This article reveals the impact of RhoA regulation on the autophagy of liver cancer stem cells by FSS. This is complementary to our research regarding cell cytoskeleton system’s regulation of autophagy [6]. It shows that the RhoA-cytoskeleton signal axis is an important means of regulating autophagy, an important supplement to the classic autophagy regulatory signal pathways, including Akt-mTOR and MAPK-mTOR. We did not investigate whether the mTOR and ULK complex were activated. We will continue to study the molecular mechanism of FSS-induced tumor cell migration.
YAP is the core molecule of the Hippo signaling pathway [22]. It is a multifunctional cell junction protein and transcriptional co-activator with two subtypes YAP1 and YAP2. The core mechanism of the Hippo signaling pathway is that the Mst1/2 protein kinase phosphorylates and activates the downstream kinase Lats1/2, which in turn phosphorylates the transcriptional coactivator YAP/TAZ, traps them in the cytoplasm and promotes their degradation [16]. Recent studies have confirmed that the Hippo signaling pathway is involved in the transduction of mechanical signals, and YAP is used as a novel mechanoreceptive factor to transduce mechanical stimulation signals [23]. When cells grow on a hard matrix, adhesion plaques form, inhibiting the activation of Rap2, activating RhoA, and promoting the nuclear localization of YAP/TAZ [18]. In vascular endothelial cells, the IntegrinYAP/TAZ-JNK cascade regulates the protective effect of one-way FSS on atherosclerosis [16].
Here we verified the regulatory effect of YAP1 on autophagy. We constructed a YAP1 knockdown cell line using YAP1-shRNA. We used CD133 + Huh7 cells to detect the expression of the autophagy molecular marker LC3B and autophagy substrate p62 after gene knockdown of YAP1. We found that the ratio of LC3B-II/I I decreased significantly (Figure 3aandd) and p62 expression increased significantly. LCSCs were transfected with the adPlus-mCherry-GFP-LC3B. LC3B punctate dots in the cytoplast were significantly increased by 30 mins of 1 dyn/cm2 FSS (Figure 3j-l). In general, YAP1 mediated FSS-induced autophagy in LCSCs.
Our results prove that YAP1 can respond to mechanical signals. Mechanical stimulation inhibits the Hippo signaling pathway and promotes the nuclear activity of the transcription factor YAP1, which is consistent with our studies [23]. Our research further verified the regulation of YAP1 on autophagic flux. Due to the complex relationship between YAP1 and the cytoskeleton [6], we are unsure whether the cytoskeleton mediates the regulation of YAP1 on autophagy.
This study has some limitations. For example, the regulation of RhoA on the cell nuclear transfer of YAP1 should be confirmed by immunofluorescence methods. The effect of FSS in LCSC metastasis in vivo is difficult to evaluate. These limitations should be investigated in the future.
In summary, FSS promoted the migration of LCSCs via the RhoA-YAP1-autophagy pathway. FSS induced RhoA expression and YAP1 nuclear transfer, leading to Atg5 and LC3B II/I upregulation to activate autophagy. Autophagy plays an important role in FSS-induced migration and invasion in LCSCs (Figure 6). We validated autophagy induction by FSS and the mechanical mechanism regarding RhoA and YAP1 in the mediation of autophagy in LCSCs. This clarifies the mechanism of the mechanical microenvironment in regulating HCC metastasis and aids in the development of novel drugs for HCC treatment.
Figure 6.
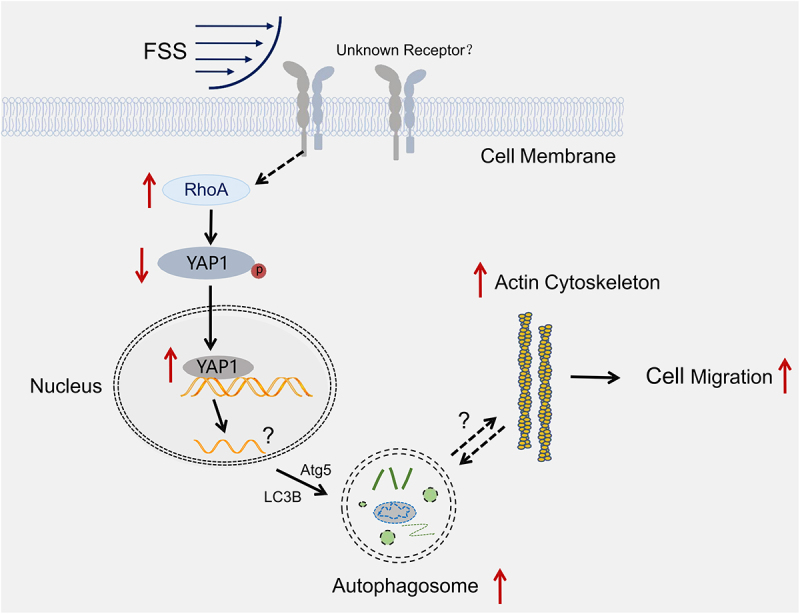
FSS promoted the migration of LCSCs via RhoA-YAP1-autophagy pathway (Schematic representation).
Materials and methods
Cell sorting and culture
Huh7 cells (HCC cell line) were obtained from the Chinese Academy of Sciences Cell Bank (Shanghai, China) and cultured in Dulbecco’s modified Eagle medium containing high glucose (SH30243.01B, Hycone, USA) supplemented with 10% fetal bovine serum (FBS) (SH30406.05, Hycone, USA), 100 U/L penicillin, and 100 mg/L streptomycin (SV30010, Hycone, USA) at 37°C in an atmosphere containing 5% CO2.
CD133+ cells were isolated using a CD133 MicroBead Kit (Miltenyi Biotec) per the manufacturer’s instructions. CD133+ cells were enzymatically dissociated, the cell suspension was centrifuged at 300 × g for 10 min, and the supernatant was aspirated completely. We resuspended Huh7 cells in 30 μl of buffer per 107 cells, added 20 μl of FcR blocking Reagent to block nonspecific antibody binding, then added 20 μl of CD133 MicroBeads. The solution was mixed well and incubated for 30 min at 4°C. Then, we washed the cells by adding 1 ml of buffer, centrifuged at 300 × g for 10 min, and sorted with the Mini MACS® Separator (Miltenyi Biotec).
Cell proliferation and clone formation
Cell proliferation: Cells were seeded in a 96-well plate with 5 × 10³ cells per well in triplicate for 24 h, 48 h, and 96 h and then examined using the Cell Counting Kit-8 assay (MCE, HY-K0301).
Clone formation assay: Cells were digested by 0.25% trypsin/0.02% EDTA solution at the logarithmic phase to make a single-cell suspension with a culture medium. Then, a cell counting chamber was used to calculate the number of cells in a 10 µl single-cell suspension under an inverted microscope. The cells were then delivered into six-well culture plates containing a sterile glass cover-slip, and 500 cells were added to each well. The medium was refreshed every three days. Cells were stained with crystal violet and then were photographed by an invert contrast microscopy (CKX41, Olympus, Japan) and digitized them using a digital camera (G11, Cannon, Japan), and counted via ImageJ 1.50b.
The spheroids formation assay: single cells (5 × 10³/well) were seeded in a serum-free culture (SFC) medium in 6-well ultra-low attachment plates (Corning). We added 20 ng/ml epidermal growth factor (PeproTech), 20 ng/ml basic fibroblast growth factor (PeproTech), and 20 μl/ml B27 supplement (Life Technologies) to the SFC medium, which was DMEM/F12 (Hyclone). The number of tumor spheroids (diameter > 100 μm) were counted in each well after one to two weeks.
FSS application
We dissociated the cells enzymatically with 0.25% trypsin and then resuspended them in a culture medium containing 10% fetal bovine serum. We determined cell density at 1.0 × 10⁵ cells/mL with a hemocytometer and seeded them on the sterilized glass slide (24 × 75 mm) in the polystyrene tissue culture plate. Until cells reached 95% confluence on the glass slides, we exposed the Huh7 cells to 1 dyn/cm2 FSS using a parallel flow chamber. The static cultured cells without FSS stimulation served as the control group. For inhibitor application, cells were pretreated with 5 mM autophagy inhibitor 3-Methyladenine (3-MA, M9281, Sigma, USA) for 12 h and added to the perfusion medium.
Transmission electron microscopy (TEM)
We fixed Cells in 2.5% glutaraldehyde in 0.1 M sodium cacodylate for 2 h, postfixed with 1% OsO4 for 2 h, and washed in 0.1 M sodium cacodylate three times for 15 min each. Then, samples were dehydrated with graded alcohol (50%, 70%, 90%, 90% ethanol +90% acetone, 90% acetone, and 100% acetone for 15 min each). After we embedded the samples in low viscosity resin, ultrathin sections were cut by Ultramicrotome (UC7, Leica, Germany) and then counterstained with 3% uranyl acetate and lead citrate. Autophagosome formation was examined by a transmission electron microscope (HT7800, Hitachi, Japan).
Western blotting analysis
We washed cells and then lysed them on ice for 30 min using RIPA Lysis Buffer (P0013C, Beyotime, China) with an addition of protease inhibitor cocktail (BB3301-1, BestBio Science, China), phosphatase inhibitor cocktail (BB3311-1, BestBio Science, China), and phenylmethylsulfonyl fluoride (ST506-1, Beyotime, China) in 1:100. Protein concentration was measured by a BCA Protein Assay Kit (P0012, Beyotime, China). We then size-fractionated the protein samples (25 μg) using SDS-PAGE (12%) and electrotransferred onto polyvinylidene fluoride membrane (ISEQ00010, Millipore, USA). Membranes were blocked for 2 h with 5% bovine serum albumin (BSA) in Tris-buffered saline with Tween 20 (TBST, 20 mM Tris-HCl, 150 mM NaCl, 0.1% Tween 20) at room temperature. We incubated the blots with the respective primary antibodies overnight at 4°C. GAPDH was the internal control. The primary antibodies included: rabbit-anti-GAPDH (1:3000, AB0036, Abways, China), rabbit-anti-β-actin (1:3000, AB0035, Abways, China),mouse-anti-Lamin B1 (1:3000, AB0054, Abways, China), mouse-anti-SQSTM1/p62 (1:200, sc-28359, Santa Cruz, USA), rabbit-anti-LC3B (1:1000, ab58610, SIGMA, USA), rabbit-anti-RhoA (1:200, ab187027, Abcam, England), mouse-anti-YAP1 (1:200, sc-271134, Santa Cruz, USA), rabbit -anti-p-YAP (Ser127) (1:1000, 4911, CST, USA), and rabbit-anti-CD133 (1:200, YT5192, Immunoway, USA). After washing three times in TBST, we incubated the blots with HRP conjugated anti-rabbit (1:5000, AB0101, Abways, China) or anti-mouse (1:5000, AB0102, Abways, China) secondary antibodies for 1 h at room temperature. We carried out detection using chemiluminescence reagents BeyoECL Plus (P0018M, Beyotime, China). Blots were imaged by ChemiDocTM XRS+ system with Image LabTM Software (version 3.0, Bio-Rad, USA) and analyzed by ImageJ 1.50b (National Institutes of Health, Washington, D.C., USA).
Visualization of LC3B punctate dots
Cells were transfected with an adenovirus expressing mCherry-GFP-LC3B fusion protein (AdPlus-mCherryGFP-LC3B) (C3012, Beyotime, Chinaper the manufacturer’s instructions. After adenovirus transfection at a multiplicity of infection (MOI) of 20 for 24 h, then we removed the adenovirus-containing culture medium and added the fresh complete culture medium to each well for another 24 h culture. The transfected cells were visualized using a confocal microscope (Eclipse Ti, NIKON, Tokyo, Japan). We calculated the LC3B punctate dots using ImageJ 1.50b. For actin microfilaments in Huh7 cells with or without AdPlus-mCherry-GFP-LC3B transfection, we washed cells in PBS twice, fixed them with 4% paraformaldehyde for 10 min at room temperature, permeabilized them with 0.5% Triton X-100 for 5 min, washed them three times in PBS, blocked them with 0.5% BSA for 30 min, and stained them with Texas Red®-X phalloidin (T7471, Invitrogen, USA) for 30 min and 4'6'-diamidino-2-phenylindole (DAPI, 760–4196, Roche, Germany) for 20 min at room temperature. Cells were sealed with 10% glycerol and then kept in the dark. We visualized the actin cytoskeleton (red) and nuclei (DAPI, blue) using a confocal microscope (Eclipse Ti, NIKON, Tokyo, Japan).
Construction of gene knockdown and overexpression cell lines
We transfected LCSCs with the recombinant virus (LV3-RHOA-homo-622, GeneChem, China) to knockdown RhoA. We inserted the oligonucleotides encoding the RhoA-shRNA or scramble-shRNA sequence into the GFP express vector (GeneChem, China). LCSCs were transfected with the recombinant virus (LV-shYAP1-3, Oligobio, China) to knockdown YAP1 and the recombinant virus (LV-YAP1, Oligobio, China) to overexpress YAP1. We inserted the oligonucleotides encoding the YAP1-shRNA, LV-YAP1, or scramble-shRNA sequence into the vector (Oligobio, China) and then transfected LCSCs with the recombinant virus (LV-ATG5-RNAi, 9514–1, GeneChem, China) to inhibit autophagy.
The RhoA shRNA sequence is 5'- GGTTGGGAATAAGAAGGATCT-3'. The YAP1 shRNA sequence is 5'-GACCAATAGCTCAGATCCTTT-3'. YAP1mRNA transcript variant 9 (NM_001282101.2:403–1929, https://www.ncbi.nlm.nih.gov/gene/10413) is an overexpressed sequence. The Atg5 shRNA sequence is 5'-CCTTTCATTCAGAAGCTGTTT-3'. The scrambled shRNA sequence 5'-TTCTCCGAACG TGTCACGT −3' was a negative control.
After 24 h of infection, we aspirated the medium containing virus, added the complete medium, and continued culturing. After 72 h of lentivirus infection, we added 2 ug/mL of puromycin. The culture medium containing puromycin was changed every three days until cells in the control group without virus infection were killed and no further cell death was reported in the infection group. We detected the infection efficiency of the fluorescent-labeled virus by fluorescence microscope and the protein expression by Western blot.
Migration and invasion assays
We performed wound healing and Transwell assays. For the wound-healing assay, cells were seeded at a density of 105 cells/mL on the slides until 95% confluence. We created wounds created by scraping the cells off of the slides with a plastic scraper. After exposure to 1 dyn/cm2 FSS with or without autophagy inhibition treatment (3-MA or lentivirus-derived Atg5 shRNA) for 12 h, we imaged the cells by an invert contrast microscopy (CKX41, Olympus, Japan) and digitized them using a digital camera (G11, Cannon, Japan). The wound healing areas were calculated to evaluate the cell migration capacity by using ImageJ 1.50b.
For Transwell assays, after autophagy inhibition and FSS application for 12 h, we collected the cells and seeded them into the upper chamber of the Transwell assay (106 cells/mL, 8 μm pore membranes, 3422, Corning, USA). For migration, the membrane was lacks matrigel. For invasion, the membrane ws precoated with 5 mg/L matrigel (354230, BD Biosicences, USA) to simulate the extracellular matrix. We added a serum-free medium in the upper chamber and 10% FBS medium in the lower chamber. After 24 h, we stained the migrated or invaded cells on the bottom surface of the membranes with crystal violet, photographed them by an invert contrast microscopy (CKX41, Olympus, Japan) and digitized them using a digital camera (G11, Cannon, Japan), and counted them using ImageJ 1.50b.
Statistical analysis
We obtained bioinformatics data for liver cancer and adjacent tissues from the Cancer Genome Atlas (TCGA) database and genotype tissue expression (GTEx) database through the gene expression profiling interactive analysis (GEPIA) online analysis website to compare RhoA and YAP1 protein expression between hepatocellular carcinoma and adjacent tissues. Meanwhile, the high 25% protein expression level in liver cancer tissues of patients with liver cancer was deemed the high expression group and the low 25% was defined as the low expression group. We used the log-rank statistical method to compare the overall survival curve of patients with low and high expression. P (log-rank) < 0.05 was defined as statistically significant. HR (high): ratio of high group risk rate to low group risk rate, P (HR): P-value of HR ratio.
We performed a Gene Set Enrichment Analysis using the GSEA software (https://www. broadinstitute.org/gsea/). All experiments were repeated three times and data were presented as mean ± standard deviation. Data obtained from different treatment groups were statistically compared with one-way ANOVA followed by Tukey’s test. Significance levels of P < 0.05 and P < 0.01 are denoted in graphs by a single asterisk * or double asterisks **, respectively.
Acknowledgments
This work was supported by the China Postdoctoral Science Foundation (2020M672265), Key scientific and technological project of Henan Province (212102310608), and Joint Construction Project of Henan Province Medical Science and Technology Key Research Plan (LHGJ20200274).
Funding Statement
This work was supported by the China Postdoctoral Science Foundation [2020M672265], Joint Construction Project of Henan Province Medical Science and Technology Key Research Plan [LHGJ20200274], Key scientific and technological project of Henan Province [212102310608].
Disclosure statement
No potential conflict of interest was reported by the author(s).
Data availability statement
The data that support the findings of this study are available from the corresponding author, [Zhiping Yan, Wenzhi Guo], upon reasonable request.
References
- [1].Bray F, Ferlay J, Soerjomataram I, et al. Global cancer statistics 2018: GLOBOCAN estimates of incidence and mortality worldwide for 36 cancers in 185 countries. CA Cancer J Clin. 2018. Nov;68(6):394–424. [DOI] [PubMed] [Google Scholar]
- [2].Heimbach JK, Kulik LM, Finn RS, et al. AASLD guidelines for the treatment of hepatocellular carcinoma. Hepatology. 2018. Jan;67(1):358–380. [DOI] [PubMed] [Google Scholar]
- [3].Nio K, Yamashita T, Kaneko S.. The evolving concept of liver cancer stem cells. Mol Cancer. 2017. Jan 30; 16. DOI: 10.1186/s12943-016-0572-9. [DOI] [PMC free article] [PubMed] [Google Scholar]
- [4].Tsuchiya H, Shiota G. Clinical and biological implications of cancer stem cells in hepatocellular carcinoma. Yonago Acta Med. 2021;64:1–11. [DOI] [PMC free article] [PubMed] [Google Scholar]
- [5].Follain G, Herrmann D, Harlepp S, et al. Fluids and their mechanics in tumour transit: shaping metastasis. Nat Rev Cancer. 2020. Feb;20(2):107–124. [DOI] [PubMed] [Google Scholar]
- [6].Yan ZP, Su GY, Gao WB, et al. Fluid shear stress induces cell migration and invasion via activating autophagy in HepG2 cells. Cell Adhes Migr. 2019;13(1):152–162. [DOI] [PMC free article] [PubMed] [Google Scholar]
- [7].Yu H, Shen Y, Jin J, et al. Fluid shear stress regulates HepG2 cell migration though time-dependent integrin signaling cascade. Cell Adh Migr. 2018. Jan 2;12(1):56–68. [DOI] [PMC free article] [PubMed] [Google Scholar]
- [8].Ariotti N, Wu YP, Okano S, et al. An inverted CAV1 (caveolin 1) topology defines novel autophagy-dependent exosome secretion from prostate cancer cells. Autophagy. 2020. Sep 20;17:2200–2216. [DOI] [PMC free article] [PubMed] [Google Scholar]
- [9].Hao M, Yeo SK, Turner K, et al. Autophagy blockade limits HER2+ breast cancer tumorigenesis by perturbing HER2 trafficking and promoting release via small extracellular vesicles. Dev Cell. 2021. Jan 16;56(3):341–355.e5. [DOI] [PubMed] [Google Scholar]
- [10].Salimi L, Akbari A, Jabbari N, et al. Synergies in exosomes and autophagy pathways for cellular homeostasis and metastasis of tumor cells. Cell Biosci. 2020. May 13;10(1). DOI: 10.1186/s13578-020-00426-y. [DOI] [PMC free article] [PubMed] [Google Scholar]
- [11].Eskelinen EL. To be or not to be? Examples of incorrect identification of autophagic compartments in conventional transmission electron microscopy of mammalian cells. Autophagy. 2008. Feb;4(2):257–260. [DOI] [PubMed] [Google Scholar]
- [12].Jung M, Choi H, Mun JY. The autophagy research in electron microscopy. Appl microsc. 2019. Nov 6;49(1):11. [DOI] [PMC free article] [PubMed] [Google Scholar]
- [13].Lim J, Murthy A. Targeting autophagy to treat cancer: challenges and opportunities. Front Pharmacol. 2020;11:590344. [DOI] [PMC free article] [PubMed] [Google Scholar]
- [14].Wu DH, Jia CC, Chen J, et al. Autophagic LC3B overexpression correlates with malignant progression and predicts a poor prognosis in hepatocellular carcinoma. Tumour Biol. 2014. Dec;35(12):12225–12233. [DOI] [PubMed] [Google Scholar]
- [15].Mowers EE, Sharifi MN, Macleod KF. Functions of autophagy in the tumor microenvironment and cancer metastasis. Febs J. 2018. May;285(10):1751–1766. [DOI] [PMC free article] [PubMed] [Google Scholar]
- [16].Wang L, Luo JY, Li B, et al. Integrin-YAP/TAZ-JNK cascade mediates atheroprotective effect of unidirectional shear flow. Nature. 2016. Dec 22;540(7634):579–582. [DOI] [PubMed] [Google Scholar]
- [17].Chen W. Cancer statistics: updated cancer burden in China. Chin J Cancer Res. 2015. Feb;27(1):1. [DOI] [PMC free article] [PubMed] [Google Scholar]
- [18].Meng ZP, Qiu YJ, Lin KC, et al. RAP2 mediates mechanoresponses of the Hippo pathway. Nature. 2018. Aug 30;560(7720):655–+. [DOI] [PMC free article] [PubMed] [Google Scholar]
- [19].Yankaskas CL, Bera K, Stoletov K, et al. The fluid shear stress sensor TRPM7 regulates tumor cell intravasation. Sci Adv. 2021. Jul;7(28). DOI: 10.1126/sciadv.abh3457. [DOI] [PMC free article] [PubMed] [Google Scholar]
- [20].Yu H, He J, Su G, et al. Fluid shear stress activates YAP to promote epithelial-mesenchymal transition in hepatocellular carcinoma. Mol Oncol. 2021. Jul 14;15:3164–3183. [DOI] [PMC free article] [PubMed] [Google Scholar]
- [21].Wan Q, Kim SJ, Yokota H, et al. Differential activation and inhibition of RhoA by fluid flow induced shear stress in chondrocytes. Cell Biol Int. 2013. Jun;37(6):568–576. [DOI] [PMC free article] [PubMed] [Google Scholar]
- [22].Kwon H, Kim J, Jho EH. Role of the Hippo pathway and mechanisms for controlling cellular localization of YAP/TAZ. Febs J. 2021. Jun 26. DOI: 10.1111/febs.16091. [DOI] [PubMed] [Google Scholar]
- [23].Lee JY, Chang JK, Dominguez AA, et al. YAP-independent mechanotransduction drives breast cancer progression. Nat Commun. 2019. Apr;23;10. [DOI] [PMC free article] [PubMed] [Google Scholar]
Associated Data
This section collects any data citations, data availability statements, or supplementary materials included in this article.
Data Availability Statement
The data that support the findings of this study are available from the corresponding author, [Zhiping Yan, Wenzhi Guo], upon reasonable request.


