Abstract
The demand for the surface integrity of complex structures is drastically increasing in the field of aerospace, marine and automotive industry. Therefore, Inconel alloy, due to its superior attributes, has a wide scope for the improvement in surface integrity. To achieve the precise surface finish and enhance the process performance, process optimization is necessary. In current paper, chemically assisted MAF process parameters were optimized using the genetic algorithm (GA) approach during finishing of Inconel 625 tubes. Regression models were developed for improvement in internal surface finish (PIISF), improvement in external surface finish (PIESF), and material removal (MR) using Design expert software. Then, the surface microstructure of Inconel 625 tubes was analyzed using scanning electron microscopy (SEM). ANOVA analysis predicts that processing time and abrasive size have the highest percentage contribution in improving the surface finish and material removal. Multioptimization results suggested to set the level of processing time (A) at 75 min, surface rotational speed (B) at 60 RPM, weight % of abrasives (C) at 30%, chemical concentration (D) at 500 gm/lt and abrasive size (E) at 40 microns to obtain optimal parameters for PIISF, PIESF and MR responses.
Keywords: multiresponse optimization, genetic algorithm, chemical-assisted MAF, SEM, Inconel 625, surface finish, material removal (MR)
1. Introduction
Demand for nickel-based super alloys is drastically increasing in modern industries due to their superior materialistic attributes. They are used in modern applications such as aircraft engines, marine field, gas turbines, petrochemical plants, solar power stations and atomic reactors [1,2]. Moreover, Inconel alloy applications such as spray nozzles used in turbines, cooling channels and hydraulic manifolds are also highlighted by researchers [3]. All the properties are important from a design point of view, but the processing of Inconel 625 super alloy is tough via traditional machining methods due to its high hardness and strength. Ezugwu and Thakur [4] and Gangopadhyay [5] summarized that machinability of Inconel alloy is poor. Various nonconventional machining/finishing methods, namely electric discharge machining (EDM), magnetic abrasive finishing (MAF), abrasive flow machining (AFM) and electrochemical machining (ECM), were recommended by some researchers [6,7,8,9,10].
Among of all, MAF has been extensively used for finishing different inner-geometrical components made of different materials such as aluminum alloy, stainless steel, brass, etc. Shinmura and Yamaguchi [11] tested the viability of MAF for internal finishing of stainless-steel tubes. Yamaguchi and Shinmura [12] improved the internal surface-finish cylindrical-work piece using a pole rotational system. Wang and Hu [13] employed MAF for the finishing of the internal surface of different tubing materials (Aluminum alloy, 316 L SS and brass). Kang and Yamaguchi [14] proposed a multi-pole-tip method to finish the capillary tubes. Nteziyaremyea et al. [15] finished the inner and outer surface simultaneously of stainless-steel needle with MAF. Mulik and Pandey [16] and Misra et al. [17] determined the temperature of the workpiece and brush interface in the MAF process.
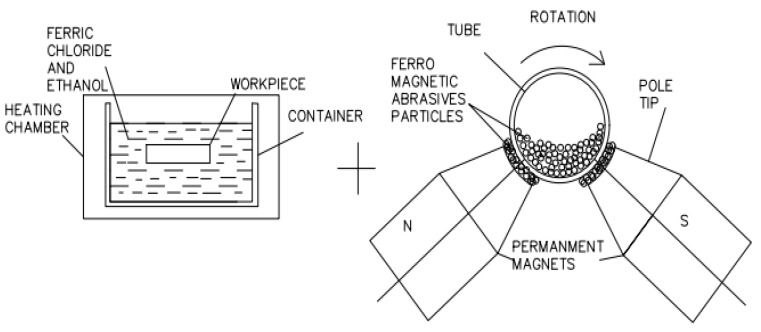
However, instead of having many advantages, MAF is less effective at finishing hard materials such as Inconel alloy, tungsten and titanium, due to their superior materialistic characteristics [18,19]. Therefore, chemically assisted magnetic abrasive finishing (CMAF) has recently been developed for machining hard superalloys [20,21]. The CMAF process is the integration of chemical etching and MAF. The processing principle of CMAF is shown in Figure 1. In this process, the tube surface is chemically treated by applying suitable etchants [22,23,24]. Due to a chemical reaction, by-product formation takes place and the workpiece surface becomes diffused [25]. As a result of this surface, intermolecular bonding becomes weak [26]. Further, magnet poles are positioned around the tube, which is chemically treated. Abrasive media is added outside and inside the tube. Abrasive media joins the magnetic force lines when magnetic flux is established.
Figure 1.
CMAF Principle “Reprinted/adapted with permission from Ref. [15]. Copyright year 2014, copyright owner’s name, Nteziyaremyea et al. [15]”.
In the CMAF process, magnetic force attracts the abrasive media towards the internal surface. Outside the tube, abrasive media is impelled against the outer surface of the tube. Whilst the tube is rotated, the inner and outer surface of tube are finished simultaneously.
Du et al. [18] utilized an electrolytic-MAF process on a superalloy (GH4169), and surface roughness descended from 6.37 to 1.77 μm. Judal and Yadava [19] used electrochemical MAF to machine a stainless steel (AISI-304) cylindrical surface and reported that the surface finish was enhanced by increasing the electrolytic current and surface rotational speed. Sihag et al. [20] implemented a chemo-assisted MAF process to finish a tungsten plane surface, and the surface finish was improved by around 79.52% with optimum conditions. Singh et al. [27] used chemical-assisted MAF on Inconel 718 flat surfaces and recommended higher processing time (90 min) and wt% of abrasives (35%) to enhance the MR. Sihag et al. [21] further developed a new hybrid process by integrated ultrasonic vibration, MAF and chemical machining. Experiments were performed on an H2O2 chemical-treated tungsten flat surface and results reported that pulse-on time in ultrasonic vibrations produces extreme impact (21.99%) for altering the surface roughness. At optimum conditions, 86.30% improvement in surface finish was observed. Pandey and Pandey [22] achieved a surface finish of Si-100 wafer of around 18.40 nm with optimum conditions using different chemical oxidizers such as KHSO5, K2S2O8 and H2O2 mixed with alumina slurry (1200 mesh) during polishing using double-disk MAF. Singh et al. improved the internal roundness by around 32% and external roundness by around 26% of Inconel 625 tubes by chemically assisted MAF [23,24]. Singh et al. performed chemically assisted MAF on Inconel 625 tubes and reported that process factors had significant impact on the material removal. The maximum MR 1.02 gms was achieved at a processing time of 75 min, surface rotational speed of 180 RPM, wt% of abrasives 35%, chemical concentration of 600 gm/lt and abrasive size of 60 μm [25].
The researchers utilized various strategies to optimize the MAF process factors to obtain the best results. MAF process parameters were also optimized for surface roughness of stainless steel 202 by using the Taguchi approach [26]. Singh et al. developed regression models for responses such as enhancement in surface finish and MR utilizing ANOVA and response surface methodology [28]. The response surface method was also used to obtain optimal conditions for maximum MR, and the surface finish was also identified via response surface method [29]. Singh et al. performed multiobjective optimization of MAF on EN-31 using the desirability approach with the genetic algorithm [30]. Misra et al. used the genetic algorithm technique for multioptimization of ultrasonic-assisted MAF for surface roughness [31]. Babbar et al. identified optimal MAF variables for surface roughness and MRR by grey relation analysis [32].
In reported work, only the impact of chemically assisted MAF process factors had been analyzed during the finishing of Inconel 625 tubes. To improve process productivity, the optimization of any process is very important. In the present paper, multiobjective optimization of chemically assisted MAF variables for surface finish and material removal was performed using the genetic algorithm approach.
2. Experimental Setup
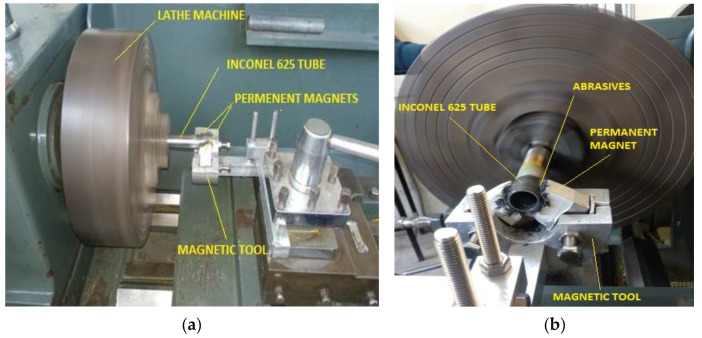
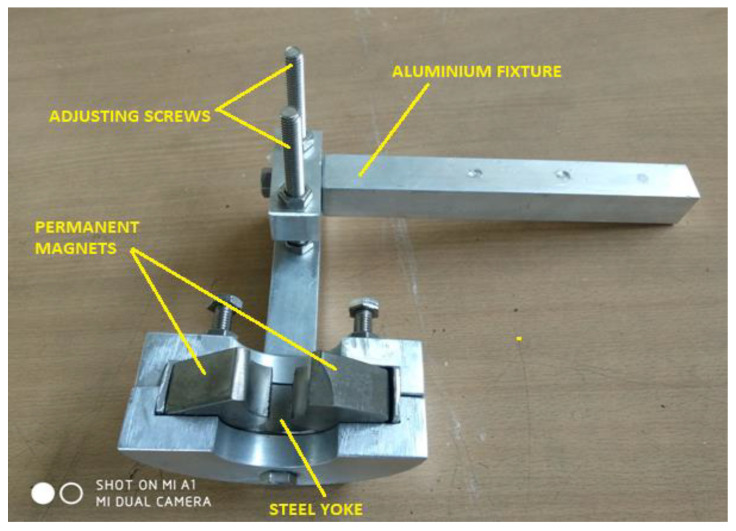
The experimental setup consisted of a magnetic tool that is gripped on the precision lathe machine tool post as represented in Figure 2a,b. Magnetic tool was designed and fabricated as per the requirements of experimental setup. Nd-Fe-B (Neodymium magnet) permanent magnets were mounted on the aluminum fixture. Both magnets were attached with stainless-steel (SS 400) yoke inside the aluminum fixture. Magnetic flux density was found around 0.5 tesla. North (N) and south (S) magnet poles were arranged as per tube diameter toward the tube center. Magnetic poles were insulated with poly-tetra-fluoro-ethylene (PTFE) tape to provide smooth relative motion between N-S poles and rotating tube. Inconel 625 tube was held on the precision lathe machine. Both poles were arranged around the tube with 2 mm gap. Figure 3 shows the magnetic tool used in this experimentation. It consisted of two Nd-Fe-B permanent magnets (Magnet Size-35 mm × 35 mm × 25 mm), stainless-steel (SS-400) yoke, aluminum fixture and stainless-steel adjusting screws. Magnets were mounted on the aluminum fixture and lower poles were attached with stainless-steel (SS-400) yoke. The adjusting screws were used to adjust the height of magnetic tool.
Figure 2.
Experimental setup. (a) Side view; (b) front view.
Figure 3.
Magnetic tool.
3. Methodology
In this investigation, response surface methodology (RSM) is utilized to plan the investigations. RSM is a statistical tool that reduces the number of experiment trails and generates better response for number of parameters. Central composite plan was chosen to plan the experiments. Table 1 represents the CMAF parameters with range.
Table 1.
CMAF parameters.
| CMAF Parameters | Units | Symbol | Levels | ||||
|---|---|---|---|---|---|---|---|
| −2 | −1 | 0 | 1 | 2 | |||
| 1. Processing Time (PT) | Mins. | A | 15 | 30 | 45 | 60 | 75 |
| 2. Surface Rotational Speed (SRS) | RPM | B | 60 | 120 | 180 | 240 | 300 |
| 3. Weight % of Abrasive Particles (WAP) | gms. | C | 25 | 30 | 35 | 40 | 45 |
| 4. Chemical Concentration (CC) | gm./Lt. | D | 500 | 550 | 600 | 650 | 700 |
| 5. Abrasive size (AS) | microns | E | 20 | 40 | 60 | 80 | 100 |
| Other Parameters | |||||||
| Workpiece | Material—Inconel 625 Dimensions—(Ø25 × 150 × 2 mm) |
||||||
| Permanent Magnet | Material—Nd-Fe-B size—(35 mm × 35 mm × 25 mm) SS 400 Steel yoke |
||||||
| Amount of SiC (Abrasive) and Iron Particles | 3 gms for each pole | ||||||
| Size of Iron Particle | 300 µm | ||||||
| Lubricant | Barrel-finishing compound (Ashfa Coorporation, Mumbai, Maharashtra) | ||||||
| Pole work gap | Gap = 2 mm | ||||||
| Etchant | FeCl3 diluted with Ethanol | ||||||
| Etching Time | Time = 30 min | ||||||
| Etching Temperature | Temperature = 65 °C | ||||||
| Response Factors | |||||||
| 1. Improvement in internal surface finish (PIISF) | |||||||
| 2. Improvement in external surface finish (PIESF) | |||||||
| 3. Material removal (MR) | |||||||
Before performing the experiments, chemical mixture was prepared with the chosen range of chemical concentration by using combination of ethanol and ferric chloride. In prepared chemical mixture, Inconel 625 tubes were immersed and placed in muffle furnace at 65 °C for 30 min. Further, chemically treated tube was finished using MAF process. After chemical treatment, tube was placed on the precision lathe machine. Then, abrasive media as per selected weight percentage were inserted in the gap between poles and tube in equal amount. Abrasive media were also inserted in the tube. To bind abrasive particles, a barrel-finishing compound was applied on abrasive media. Flexible-magnetic abrasive brush (FMAB) was formed outside and inside the tube by these particles under the magnetic field. This FMAB performed finishing action on the inner and outer surfaces of Inconel 625. After performing the experiment, the surface roughness of internal and external surface was measured by using Telesurf roughness tester. The initial workpiece surface roughness range was 1.01 µm to 4.15 µm for internal surface and 1.23 µm to 4.12 µm for external surface. After the chemical treatment, the surface roughness range was 1.18 µm to 4.28 µm for internal surface and 1.37 µm to 4.31 µm for external surface. After finishing with MAF process, the surface roughness range was 0.43 µm to 2.39 µm for internal surface and 0.84 µm to 2.84 µm for external surface.
Weight of specimen was measured by digital weighing machine to calculate the MR. On the basis of surface roughness readings, the improvement in the internal surface finish (PIISF) and improvement in external surface finish (PIESF) were calculated for each experiment using following relation. Experimental conditions with output characteristics are represented in Table 2.
Table 2.
Experimental results with responses.
| S. No. | Input Process Parameters | Output Responses | ||||||
|---|---|---|---|---|---|---|---|---|
| PT (A) | SRS (B) | WAP (C) | CC (D) | AS (E) | PIISF | PIESF | MR | |
| 1 | 30 | 120 | 40 | 550 | 40 | 24 | 23 | 0.34 |
| 2 | 60 | 120 | 40 | 550 | 80 | 26 | 24 | 0.37 |
| 3 | 30 | 240 | 40 | 550 | 80 | 25 | 20 | 0.3 |
| 4 | 45 | 180 | 35 | 600 | 100 | 23 | 16 | 0.26 |
| 5 | 45 | 180 | 35 | 600 | 60 | 52 | 39 | 0.74 |
| 6 | 60 | 120 | 30 | 650 | 80 | 32 | 28 | 0.64 |
| 7 | 30 | 120 | 30 | 650 | 40 | 42 | 33 | 0.71 |
| 8 | 30 | 240 | 40 | 650 | 40 | 52 | 45 | 0.79 |
| 9 | 60 | 120 | 30 | 550 | 40 | 61 | 49 | 0.88 |
| 10 | 15 | 180 | 35 | 600 | 60 | 12 | 8 | 0.19 |
| 11 | 30 | 240 | 30 | 650 | 80 | 32 | 29 | 0.64 |
| 12 | 60 | 240 | 30 | 650 | 40 | 58 | 44 | 0.8 |
| 13 | 45 | 180 | 45 | 600 | 60 | 25 | 19 | 0.28 |
| 14 | 45 | 180 | 25 | 600 | 60 | 30 | 26 | 0.54 |
| 15 | 45 | 180 | 35 | 600 | 60 | 45 | 31 | 0.74 |
| 16 | 75 | 180 | 35 | 600 | 60 | 71 | 59 | 1.02 |
| 17 | 45 | 300 | 35 | 600 | 60 | 62 | 50 | 0.9 |
| 18 | 45 | 180 | 35 | 600 | 60 | 43 | 39 | 0.86 |
| 19 | 45 | 180 | 35 | 600 | 20 | 44 | 32 | 0.81 |
| 20 | 30 | 120 | 40 | 650 | 80 | 21 | 14 | 0.22 |
| 21 | 60 | 240 | 30 | 550 | 80 | 45 | 39 | 0.71 |
| 22 | 45 | 180 | 35 | 600 | 60 | 53 | 34 | 0.84 |
| 23 | 60 | 240 | 40 | 650 | 80 | 38 | 32 | 0.64 |
| 24 | 45 | 60 | 35 | 600 | 60 | 48 | 45 | 0.79 |
| 25 | 45 | 180 | 35 | 700 | 60 | 51 | 46 | 0.84 |
| 26 | 45 | 180 | 35 | 500 | 60 | 47 | 33 | 0.75 |
| 27 | 45 | 180 | 35 | 600 | 60 | 54 | 39 | 0.85 |
| 28 | 45 | 180 | 35 | 600 | 60 | 51 | 40 | 0.84 |
| 29 | 30 | 240 | 30 | 550 | 40 | 36 | 29 | 0.51 |
| 30 | 30 | 120 | 30 | 550 | 80 | 28 | 18 | 0.36 |
| 31 | 60 | 240 | 40 | 550 | 40 | 51 | 37 | 0.83 |
| 32 | 60 | 120 | 40 | 650 | 40 | 46 | 38 | 0.76 |
PIISF/PIESF = (surface roughness of rough surface − surface roughness of finished surface)/surface roughness of rough surface × 100.
4. Results and Discussions
The optimization of any process is a very essential criterion to improve the process efficiency. In the present work, multiresponse optimization of chemically assisted MAF process parameters was attempted to obtain the best results in the form of surface finish and material removal by using a genetic algorithm. Analysis of variance (ANOVA) is a promising technique for identifying the significant variables. Table 3 represents the ANOVA results for PIISF. The model F-value (5.44) and p-value (0.0031) indicate that the model is significant. It has been analyzed that processing time and abrasive size are the major contributing parameters for PIISF. Table 4 represents the ANOVA results for PIESF. The model is significant with the F-value (4.64) and p-value (0.0061). For PIESF, the processing time and abrasive size are the most significant parameters. Table 5 shows the ANOVA results for MR. The model is significant with F-value (10.89) and p-value (0.0001). The maximum improvement in MR is achieved by processing time, followed by abrasive size and wt% of abrasives. R-Sq values for PIISF (98%), PIESF (89%) and MR (99%) indicate a strong correlation with experimental results.
Table 3.
ANOVA for PIISH.
| Source | Sum of Squares | Degree of Freedom | Mean Square | F-Value | p-Value | Remarks |
|---|---|---|---|---|---|---|
| Model | 5548.91 | 20 | 277.45 | 5.44 | 0.0031 | Significant |
| A—Processing time | 1926.04 | 1 | 1926.04 | 37.76 | <0.0001 | |
| B—Surface rotational Speed | 301.04 | 1 | 301.04 | 5.9 | 0.0334 | |
| C—Wt% of abrasives | 155.04 | 1 | 155.04 | 3.04 | 0.1091 | |
| D—Chemical concentration | 45.38 | 1 | 45.38 | 0.8896 | 0.3659 | |
| E—Abrasive size | 1134.38 | 1 | 1134.38 | 22.24 | 0.0006 | |
| AB | 0.5625 | 1 | 0.5625 | 0.011 | 0.9183 | |
| AC | 22.56 | 1 | 22.56 | 0.4423 | 0.5197 | |
| AD | 115.56 | 1 | 115.56 | 2.27 | 0.1604 | |
| AE | 45.56 | 1 | 45.56 | 0.8932 | 0.3649 | |
| BC | 105.06 | 1 | 105.06 | 2.06 | 0.1791 | |
| BD | 27.56 | 1 | 27.56 | 0.5404 | 0.4777 | |
| BE | 5.06 | 1 | 5.06 | 0.0992 | 0.7586 | |
| CD | 85.56 | 1 | 85.56 | 1.68 | 0.2218 | |
| CE | 0.5625 | 1 | 0.5625 | 0.011 | 0.9183 | |
| DE | 45.56 | 1 | 45.56 | 0.8932 | 0.3649 | |
| A² | 136.74 | 1 | 136.74 | 2.68 | 0.1298 | |
| B² | 43.37 | 1 | 43.37 | 0.8502 | 0.3763 | |
| C² | 939.41 | 1 | 939.41 | 18.42 | 0.0013 | |
| D² | 2.37 | 1 | 2.37 | 0.0464 | 0.8334 | |
| E² | 507.41 | 1 | 507.41 | 9.95 | 0.0092 | |
| Residual | 561.09 | 11 | 51.01 | |||
| Lack of fit | 457.76 | 6 | 76.29 | 3.69 | 0.0866 | not significant |
| Pure error | 103.33 | 5 | 20.67 | |||
| Cor total | 6110 | 31 |
R2 = 0.98; std. dev. = 7.14; mean = 41.50; C.V.% = 17.21; adeq. precision = 7.50.
Table 4.
ANOVA for PIESH.
| Source | Sum of Squares | Degree of Freedom | Mean Square | F-Value | p-Value | Remarks |
|---|---|---|---|---|---|---|
| Model | 3747.27 | 20 | 187.36 | 4.64 | 0.0061 | significant |
| A—Processing time | 1380.17 | 1 | 1380.17 | 34.15 | 0.0001 | |
| B—Surface rotational Speed | 140.17 | 1 | 140.17 | 3.47 | 0.0895 | |
| C—Wt% of abrasives | 104.17 | 1 | 104.17 | 2.58 | 0.1367 | |
| D—Chemical concentration | 104.17 | 1 | 104.17 | 2.58 | 0.1367 | |
| E—Abrasive size | 661.5 | 1 | 661.5 | 16.37 | 0.0019 | |
| AB | 30.25 | 1 | 30.25 | 0.7484 | 0.4055 | |
| AC | 30.25 | 1 | 30.25 | 0.7484 | 0.4055 | |
| AD | 90.25 | 1 | 90.25 | 2.23 | 0.1632 | |
| AE | 45.56 | 1 | 45.56 | 0.0247 | 0.8779 | |
| BC | 30.25 | 1 | 30.25 | 0.7484 | 0.4055 | |
| BD | 42.25 | 1 | 42.25 | 1.05 | 0.3285 | |
| BE | 36 | 1 | 36 | 0.8907 | 0.3656 | |
| CD | 42.25 | 1 | 42.25 | 1.05 | 0.3285 | |
| CE | 9 | 1 | 9 | 0.2227 | 0.6462 | |
| DE | 25 | 1 | 25 | 0.6185 | 0.4482 | |
| A² | 34.19 | 1 | 34.19 | 0.8458 | 0.3775 | |
| B² | 171.85 | 1 | 171.85 | 4.25 | 0.0636 | |
| C² | 430.19 | 1 | 430.19 | 10.64 | 0.0076 | |
| D² | 5.19 | 1 | 5.19 | 0.1283 | 0.727 | |
| E² | 350.06 | 1 | 350.06 | 8.66 | 0.0134 | |
| Residual | 444.61 | 11 | 40.42 | |||
| Lack of fit | 378.61 | 6 | 63.1 | 4.78 | 0.0535 | not significant |
| Pure error | 66 | 5 | 13.2 | |||
| Cor total | 4191.88 | 31 |
R2 = 0.89; std. dev. = 6.36; mean = 33.06l C.V.% = 19.23l; adeq. precision = 7.54.
Table 5.
ANOVA for MR.
| Source | Sum of Squares | Degree of Freedom | Mean Square | F-Value | p-Value | Remarks |
|---|---|---|---|---|---|---|
| Model | 1.63 | 20 | 0.0813 | 10.89 | 0.0001 | significant |
| A—Processing time | 0.4874 | 1 | 0.4874 | 65.29 | <0.0001 | |
| B—Surface rotational speed | 0.0561 | 1 | 0.0561 | 7.51 | 0.0192 | |
| C—Wt% of abrasives | 0.0963 | 1 | 0.0963 | 12.9 | 0.0042 | |
| D—Chemical concentration | 0.0486 | 1 | 0.0486 | 6.51 | 0.0269 | |
| E—Abrasive size | 0.3361 | 1 | 0.3361 | 45.02 | <0.0001 | |
| AB | 0.0049 | 1 | 0.0049 | 0.6564 | 0.435 | |
| AC | 0.0012 | 1 | 0.0012 | 0.1641 | 0.6932 | |
| AD | 0.04 | 1 | 0.04 | 5.36 | 0.0409 | |
| AE | 0.0004 | 1 | 0.0004 | 0.0536 | 0.8212 | |
| BC | 0.04 | 1 | 0.04 | 5.36 | 0.0409 | |
| BD | 0.0012 | 1 | 0.0012 | 0.1641 | 0.6932 | |
| BE | 0.0132 | 1 | 0.0132 | 1.77 | 0.2101 | |
| CD | 0.0036 | 1 | 0.0036 | 0.4823 | 0.5018 | |
| CE | 0.0256 | 1 | 0.0256 | 3.43 | 0.091 | |
| DE | 0.0006 | 1 | 0.0006 | 0.0837 | 0.7777 | |
| A² | 0.0788 | 1 | 0.0788 | 10.55 | 0.0078 | |
| B² | 0.002 | 1 | 0.002 | 0.2631 | 0.6182 | |
| C² | 0.2967 | 1 | 0.2967 | 39.74 | <0.0001 | |
| D² | 0.0005 | 1 | 0.0005 | 0.0733 | 0.7916 | |
| E² | 0.1409 | 1 | 0.1409 | 18.88 | 0.0012 | |
| Residual | 0.0821 | 11 | 0.0075 | |||
| Lack of fit | 0.0664 | 6 | 0.0111 | 3.53 | 0.0938 | not significant |
| Pure error | 0.0157 | 5 | 0.0031 | |||
| Cor total | 1.71 | 31 |
R2 = 0.99; std. dev. = 0.086; mean = 0.65; C.V.% = 13.32; adeq. precision = 10.98.
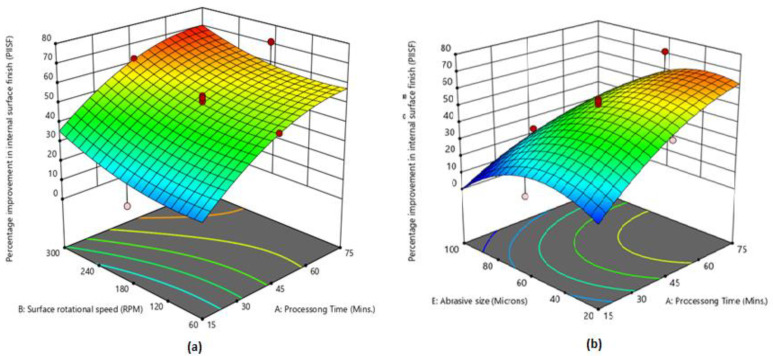
On the basis of regression models, 3D graphs were plotted to analyze the influence of CMAF process factors on the PIISF, PIESF and MR. Figure 4a shows that the maximum PIISF is attained at 75 min processing time and 300 RPM rotational speed. PIISF continuously increases by increasing the processing time. The main reason is that the magnetic tool performs the finishing action for a long duration by increasing the processing time and more peaks are removed from the surface. On other side, PIISF is also increased by enhancing the surface rotational speed. The abrasive particle-striking rate is increased by enhancing the surface rotational speed, which results in more peaks being removed from the workpiece surface [31,32]. Figure 4b shows that PIISF is highest at processing time of 75 min and abrasive size of 40 µm. PIISF is also affected by the use of different abrasive sizes. Initially, PIISF was improved with an increase in abrasive size (up to 40 µm) and afterward started decreasing. It was observed that very fine and very coarse abrasive particles did not produce effective finishing. A very fine abrasive size has small cutting edges that slowly finish the surface, and fewer peaks are removed from the work piece. On the other side, very course particles have large cutting edges that finish rapidly but produce scratches on the surface. Therefore, better improvement in surface finish was achieved using 40 µm and 60 µm.
Figure 4.
(a) Influence of processing time and rotational speed on PIISF; (b) influence of abrasive size and chemical concentration on PIISF.
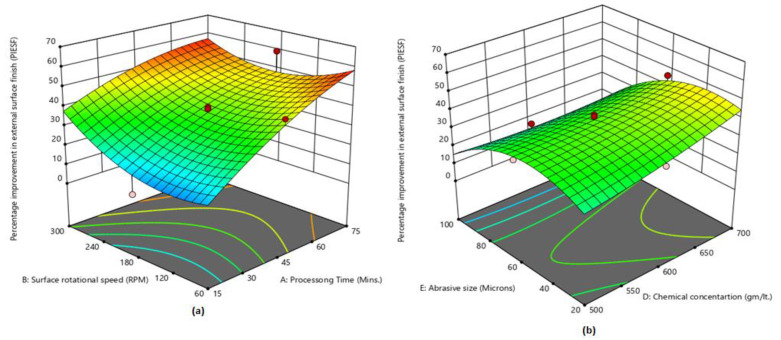
Figure 5a shows that maximum PIESF was attained at a highest processing time of 75 min and 300 RPM rotational speed. PIESF continuously increases with an increase in processing time because the magnetic tool is finishing the surface for a longer duration. On other hand, initially PIESF starts decreasing (up to 120 RPM) and afterward, it starts increasing by enhancing the surface rotational speed. The abrasive particles strike on the workpiece surface very rapidly by enhancing the rotational speed, and the surface-finishing rate is increased, which results in more peaks being reduced from the surface [11,12,13,14,15,16,17,18,19,20,21,22,23,24,27]. Figure 5b shows that PIESF is highest at an abrasive size of 40 µm and a chemical concentration of 700 gm/lt. Initially, PIESF is improved by an increase in abrasive size (till 40 µm) and afterward starts decreasing. In another case, PIESF slowly increases by enhancing the chemical concentration. The chemical reaction becomes faster with the increase in chemical concentration and more uniform etching occurs on the workpiece surface, which results in PIESF being enhanced.
Figure 5.
(a) Influence of processing time and rotational speed on PIESF; (b) influence of abrasive size and chemical concentration on PIESF.
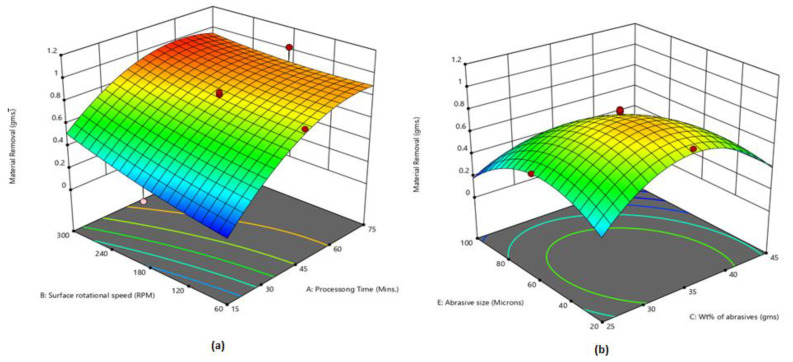
Figure 6a shows that maximum MR is attained at 60 min processing time and 300 RPM rotational speed. MR is maximized by enhancing the rotational speed and processing time up to a certain limit (60 min). Figure 6b shows that maximum MR is attained using weight % of abrasives at 35% and abrasive size at 40 µm. MR increases by enhancing the weight % up to 35%, then afterwards starts declining. The effective magnetic brush is formed at 35% weight % of abrasives, which is responsible for the improvement in MR. At a lower weight % of abrasives, fewer cutting edges are available in the magnetic brush. At higher weight % of abrasives, the abrasive bonding strength is decreased due to a lower quantity of iron particles, which results in less material being removed from the workpiece surface.
Figure 6.
(a) Influence of processing time and rotational speed on MR; (b) influence of wt% of abrasives and abrasive size on MR.
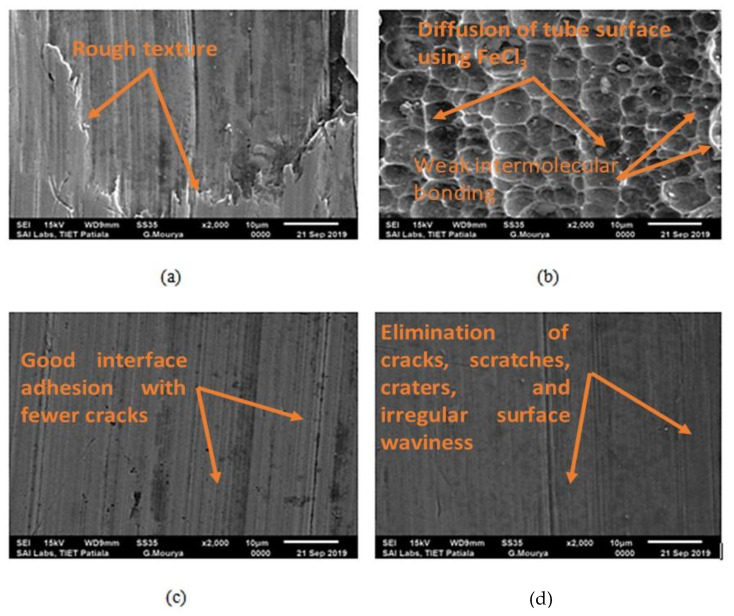
The surface microstructure of Inconel 625 tubes was analyzed using scanning electron microscopy (SEM). Figure 7a shows the SEM image of the rough surface of Inconel 625 tubes. The scratches, waviness and craters are clearly visible on the rough surface. Figure 7b shows the SEM image of the chemically treated surface of the Inconel 625 tube. Analysis shows that the tube surface becomes diffused after chemical treatment using FeCl3, and intermolecular bonding of the material upper surface becomes weakened. Figure 7c,d show the SEM images of finished internal and external surface samples at a processing time of 75 min. It is clearly visible that the diffused surface, crater and waviness are completely eliminated and scratches are also reduced.
Figure 7.
SEM image of Inconel 625 tube. (a) Rough surface; (b) chemically treated surface; (c) finished internal surface (PT-75, AS-60, SRS-180, CC-600, WPS-35%); (d) finished external surface (PT-75, AS-60, SRS-180, CC-600, WPS-35%).
5. Multiobjective Optimization
As mentioned in preceding section, the influence of every input variable on output responses is exceptional and nonuniform. Moreover, the variable interaction is significant, and therefore it is tough to pick out best conditions for three output responses. Traditional optimization strategies cannot advise a single set of variables to obtain the best value of PIISF, PIESF and MR for the current work. Thus, there is a requirement to put into impact an advanced optimization method that might also recommend the optimal parametric settings. In present work, regression analysis is implemented, accompanied by the genetic algorithm (GA) and analytical hierarchy methods.
5.1. Regression Method
The regression approach is utilized for investigating the influence of input parameters on output responses. Regression analysis is conducted using SPSS software. The current work is targeted on three output responses; consequently, three single-objective equations were created by utilizing the regression approach. Within the production domain, there are various variables that have an impact on the output responses. The relationship between independent and response variables is defined through a mathematical model, which is represented in Equation (1).
| (1) |
Equation (1) for five variables can be written as represented in Equation (2), where C1 (processing time), C2 (surface rotational speed), C3 (wt% of abrasives), C4 (chemical concentration) and C5 (abrasive Size) are the process variables and Y indicates the response variables.
| (2) |
In this work, there are five input CMAF process variables, whereas PIISF, PIESF and MR are the output responses. By using the regression approach, four Equations—(3)–(6)—are generated, whereas maximization of PIISF, PIESF and MR are the main goals, respectively.
3D surface plots show that each CMAF process variable has a nonuniform impact on PIISF, PIESF and MR of finished Inconel 625 tubes. Therefore, there is a requirement to determine a single set of variables that may give the quality outcomes in the form of PIISF, PIESF and MR. This multiobjective issue of CMAF may be resolved by carrying out a genetic algorithm (GA). Expectedly, weighted aggregate methodology, distance function strategy and Taguchi procedures are utilized for multiresponse optimization. However, the precision of these techniques relies on the expertise of a professional who chooses the relative significance and ranking of the objective function. Another obstacle to these methods is the discontinuity of the objective function. Consequently, GA was utilized in the current work for multiobjective problems. GA is a most promising approach that eradicates the necessity of gradient facts and intrinsic parallelism to find the design area. The main objective is to identify a single set of CMAF variables within set limits, which would enhance the PIISF, PIESF and MR. At first, three equations for every objective function (PIISF, PIESF and MR) are changed over into a single equation, as represented in (6).
| PIISFMAX = −233 + 4.54 A − 0.643 B + 9.07 C + 0.024 D + 2.15 E − 0.00960 A *A + 0.000338 B *B − 0.2264 C *C − 0.000114 D *D − 0.01040 E *E − 0.00021 A *B − 0.0158 A *C − 0.00358 A *D − 0.00563 A *E + 0.00854 B *C + 0.000437 B *D + 0.00047 B *E + 0.00925 C *D − 0.0019 C *E − 0.00169 D *E | (3) |
| PIESFMAX = −81 + 3.70 *A − 0.693 *B + 6.86 *C − 0.268 *D + 1.52 *E − 0.00480 *A *A + 0.000672 *B *B − 0.1532 *C *C + 0.000168 *D *D − 0.00864 *E *E − 0.00153 *A *B − 0.0183 *A *C − 0.00317 *A *D + 0.00083 *A *E + 0.00458 *B *C + 0.000542 *B *D + 0.00125 *B *E + 0.00650 *C *D − 0.0075 *C *E − 0.00125 *D *E | (4) |
| MRMAX = − 6.07 + 0.0706 A − 0.00816 *B + 0.2217 *C + 0.00372 *D + 0.0291 *E − 0.000230 *A *A + 0.000002 *B *B − 0.004023 *C *C − 0.000002 *D *D − 0.000173* E *E − 0.000019 *A *B + 0.000117 *A *C − 0.000067 *A *D − 0.000017 *A *E + 0.000167 *B *C + 0.000003 *B *D + 0.000024 *B *E + 0.000060 *C *D − 0.000400 *C *E − 0.000006 *D *E | (5) |
| y = −0.333 * (−233 + 4.54 *A − 0.643 *B + 9.07 *C + 0.024 *D + 2.15 *E − 0.00960 *A *A + 0.000338 *B *B − 0.2264 *C *C − 0.000114 *D *D − 0.01040 *E *E − 0.00021 *A *B − 0.0158 *A *C − 0.00358 *A *D − 0.00563 *A *E + 0.00854 *B *C + 0.000437 *B *D + 0.00047 *B *E + 0.00925 *C *D − 0.0019 *C *E − 0.00169 *D *E) − 0.333 * (−81 + 3.70 *A − 0.693 *B + 6.86 *C − 0.268* D + 1.52 *E − 0.00480 *A *A + 0.000672 *B *B − 0.1532 *C *C + 0.000168 *D *D − 0.00864 *E *E − 0.00153 *A *B − 0.0183 *A *C − 0.00317 *A *D + 0.00083 *A *E + 0.00458 *B *C + 0.000542 *B *D + 0.00125 *B *E + 0.00650 *C *D − 0.0075 *C *E − 0.00125 *D *E) − 0.333* (−6.07 + 0.0706* A − 0.00816 *B + 0.2217 *C + 0.00372 *D + 0.0291 *E − 0.000230 *A *A + 0.000002 *B *B − 0.004023 *C *C − 0.000002 *D *D − 0.000173* E *E − 0.000019 *A *B + 0.000117 *A *C − 0.000067 *A *D − 0.000017 *A *E + 0.000167 *B *C + 0.000003 *B *D + 0.000024 *B *E + 0.000060 *C *D − 0.000400 *C *E 0.000006*D *E | (6) |
5.2. Genetic Algorithm (GA)
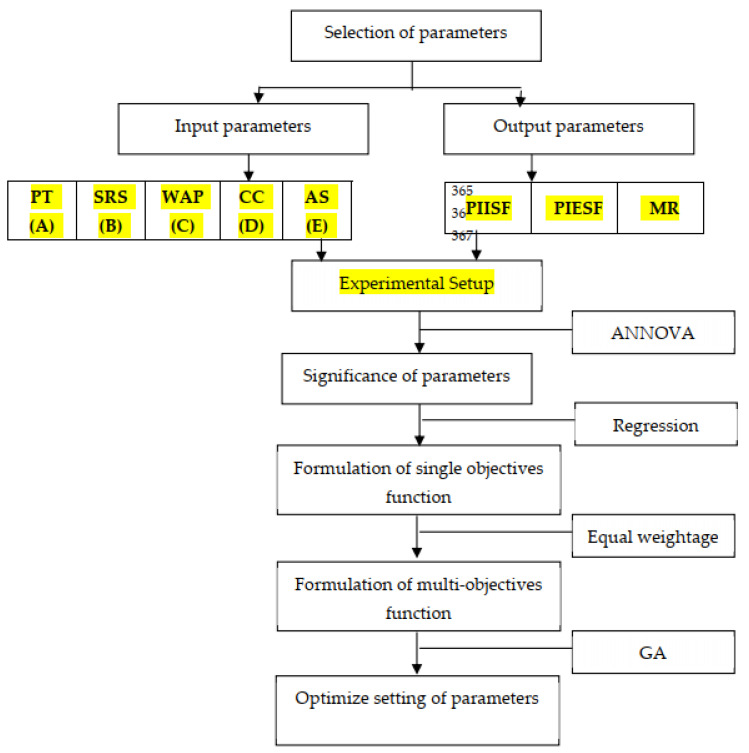
GA is utilized to resolve nonlinear objective functions. GA was developed by Holland [33], and in 1989, Goldberg [34] reformed it. GA is utilized to accomplish the best fitness values, and its outcomes are very authentic, particularly in the problem of constrained optimization. In present study, a total of five input parameters and three output parameters were considered for the design of the experiment. Previous studies have proved that soft computing techniques provide more reliable optimum results in the case of multiobjective optimization [33,34,35,36,37,38,39,40,41,42,43]. GA is an inbuilt tool in MATLAB, which make it friendlier for users. Moreover, GA is the most commonly used technique for optimization problems. As per the SCOPUS database, more than sixty-four thousand articles have been published to date. Researchers have successfully implemented GA in various disciplines, such as machining [35], drug repurposing [36], automobiles [37], earth work activities [38], transportation [39], antenna [40], energy planning [41], electric vehicle [42], structural design [43], etc. Figure 8 represents the genetic algorithm flow chart.
Figure 8.
Flow chart used for multiobjective optimization.
The genetic algorithm was performed using MATLAB, and optimization results are represented in Table 6. The multiresponse optimization solution indicated that the values of PT, SRS and CC are different for PIISF but remain constant for PIESF and MR in optimization solutions. Moreover, the values of WAP and AS are different for all optimization conditions.
Table 6.
Multiresponse optimization outcomes using genetic algorithm.
| Response Parameters | Optimization | PT (A) |
SRS (B) |
WAP (C) |
CC (D) |
AS (E) |
Objective Function |
|---|---|---|---|---|---|---|---|
| PIISFMAX | Single-Objective | 61.95 | 300.00 | 37.69 | 700.00 | 33.05 | 77.81 |
| PIESFMAX | Single-Objective | 75.00 | 60.00 | 28.25 | 500.00 | 47.47 | 80.65 |
| MRMAX | Single-Objective | 75.00 | 60.00 | 31.66 | 500.00 | 39.31 | 1.10 |
| Multiobjective | 75.00 | 60.00 | 28.51 | 500.00 | 43.98 | 54.60 |
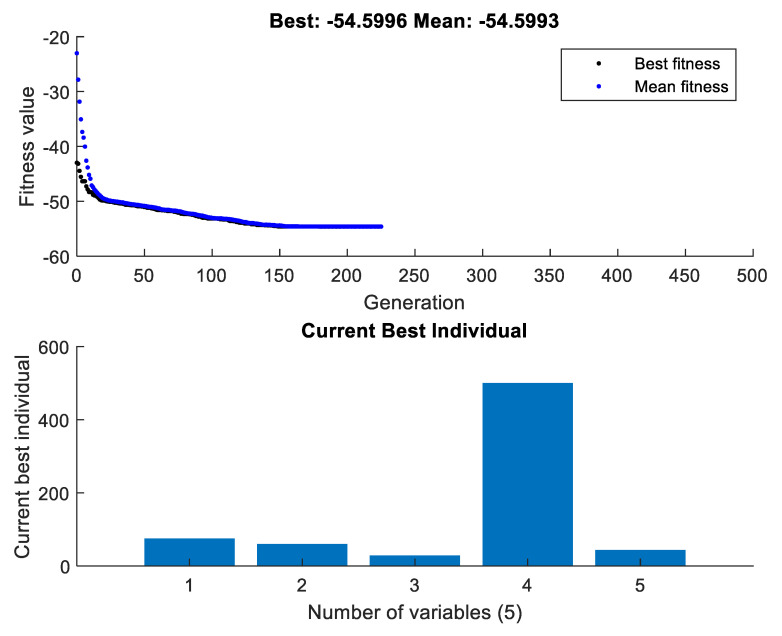
For multiobjective optimization, the best value of each variable is represented in Figure 9. It tended to be found that approximately 230 generations were involved to find the best optimization results when GA codes were performed utilizing MATLAB. Moreover, the best fitness and mean values are extremely near one another, which confirms the precision of the results. It is suggested that processing time must be set at 75 min, surface rotational speed at 60 RPM, wt% of abrasives at 28.51% (approx. 30%), the chemical concentration at 500 gm/lt and abrasive size at 43.98 (approx. 40 microns).
Figure 9.
Current best individual using GA.
6. Conclusions
In this work, multiresponse optimization of chemically assisted MAF variables for PIISF, PIESF and MR was performed using a genetic algorithm approach. The following points are summarized from this optimization work.
The developed regression model shows a strong correlation with the experimental results. The processing time and abrasive size are the major significant parameters for PIISF, PIESF and MR.
The SEM images of the rough surface of Inconel 625 tubes exhibiting scratches, waviness and craters are clearly visible on the rough surface. Moreover, the SEM image of the chemically treated surface of the Inconel 625 tube reported that the tube surface became diffused after chemical treatment using FeCl3 and that the intermolecular bonding of the material’s upper surface became weakened.
Multioptimization results using a genetic algorithm suggested that PIISF, PIESF and MR are best optimized by setting the value of processing time (A) at 75 min, surface rotational speed (B) at 60 RPM, weight % of abrasives (C) at 30%, chemical concentration (D) at 500 gm/lt and abrasive size (E) at 40 microns.
Author Contributions
Conceptualization: G.S., H.K., H.K.K., K.S., R.K., J.S.C., S.S. (Sandeep Singh) and S.S. (Shubham Sharma); methodology: G.S., H.K., H.K.K., K.S., R.K., J.S.C., S.S. (Sandeep Singh) and S.S. (Shubham Sharma); formal analysis: R.K., J.S.C. and S.S. (Shubham Sharma); investigation: G.S., H.K., H.K.K., K.S., R.K., J.S.C., S.S. (Sandeep Singh) and S.S. (Shubham Sharma); writing—original draft preparation: G.S., H.K., H.K.K., K.S., R.K., J.S.C., S.S. (Sandeep Singh) and S.S. (Shubham Sharma); writing—review and editing: S.S. (Shubham Sharma), C.L., G.K. and J.B.K.; supervision: S.S. (Shubham Sharma), C.L., G.K. and J.B.K.; project administration: S.S. (Shubham Sharma), C.L., G.K. and J.B.K.; funding acquisition: S.S. (Shubham Sharma), G.K. and J.B.K. All authors have read and agreed to the published version of the manuscript.
Institutional Review Board Statement
Not applicable.
Informed Consent Statement
Not applicable.
Data Availability Statement
No data were used to support this study.
Conflicts of Interest
The authors declare no conflict of interest.
Funding Statement
This research received no external funding.
Footnotes
Publisher’s Note: MDPI stays neutral with regard to jurisdictional claims in published maps and institutional affiliations.
References
- 1.Eiselstein H., Tillack D. Invention and Definition of Inconel 625 Alloy. Inconel Alloys International Inc.; Huntington, WV, USA: 1996. [Google Scholar]
- 2.Tan K.L., Yeo S.H., Ong C.H. Non-traditional finishing processes for internal surfaces and passages: A review. Proc. Inst. Mech. Eng. Part B Eng. Manuf. 2016;231:2302–2316. doi: 10.1177/0954405415626087. [DOI] [Google Scholar]
- 3.Hashimoto F., Yamaguchi H., Krajnik P., Wegener K., Chaudhari R., Hoffmeister H.W., Kuster F. Abrasive fine-finishing technology. CIRP Ann. Manuf. Technol. 2016;65:597–620. doi: 10.1016/j.cirp.2016.06.003. [DOI] [Google Scholar]
- 4.Ezugwu E.O. Key improvements in the machining of difficult-to-cut aerospace superalloys. Int. J. Mach. Tools Manuf. 2005;45:1353–1367. doi: 10.1016/j.ijmachtools.2005.02.003. [DOI] [Google Scholar]
- 5.Thakur A., Gangopadhyay S. State-of-the-art in surface integrity in machining of nickel-based super alloys. Int. J. Mach. Tools Manuf. 2016;100:25–54. doi: 10.1016/j.ijmachtools.2015.10.001. [DOI] [Google Scholar]
- 6.Dhanabalan S., Sivakumar K., Narayanan C.S. Analysis of Form Tolerances in Electrical Discharge Machining Process for Inconel 718 and 625. Mater. Manuf. Process. 2014;29:253–259. doi: 10.1080/10426914.2013.852213. [DOI] [Google Scholar]
- 7.Talla G., Gangopadhyay S., Biswas C.K. Effect of Powder-Suspended Dielectric on the EDM Characteristics of Inconel 625. ASM Int. 2016;25:704–717. doi: 10.1007/s11665-015-1835-0. [DOI] [Google Scholar]
- 8.Goyal A. Investigation of Material removal rate and Surface roughness during Wire electrical discharge machining (WEDM) machining of Inconel 625 super alloy by cryogenic treated tool electrode. J. King Saud Univ. -Sci. 2017;29:528–535. doi: 10.1016/j.jksus.2017.06.005. [DOI] [Google Scholar]
- 9.Manikandan N., Kumanan S., Sathiyanarayanan C. Multiple performance optimization of electrochemical drilling of Inconel 625 using Taguchi based Grey Relational Analysis. Eng. Sci. Technol. Int. J. 2017;20:662–671. doi: 10.1016/j.jestch.2016.12.002. [DOI] [Google Scholar]
- 10.Mohammadian N., Turenne S., Brailovski V. Surface finish control of additively-manufactured Inconel 625 components using combined chemical-abrasive flow polishing. J. Mater. Process. Technol. 2017;20:662–671. doi: 10.1016/j.jmatprotec.2017.10.020. [DOI] [Google Scholar]
- 11.Shinmura T., Yamaguchi H. Study on a new internal finishing process by the application of magnetic abrasive machining: Internal finishing of stainless-steel tube and clean gas bomb. JSME Int. J. 1995;38:798–804. doi: 10.1299/jsmec1993.38.798. [DOI] [Google Scholar]
- 12.Yamaguchi H., Shinmura T. Study of an internal magnetic abrasive finishing using a pole rotation system. Précis Eng. 2000;24:237–244. doi: 10.1016/S0141-6359(00)00037-4. [DOI] [Google Scholar]
- 13.Wang Y., Hu D. Study on the inner surface finishing of tubing by magnetic abrasive finishing. Int. J. Mach. Tools Manuf. 2005;45:43–49. doi: 10.1016/j.ijmachtools.2004.06.014. [DOI] [Google Scholar]
- 14.Kang J., Yamaguchi H. Internal finishing of capillary tubes by magnetic abrasive finishing using a multiple pole-tip system. Précis Eng. 2013;36:510–516. doi: 10.1016/j.precisioneng.2012.01.006. [DOI] [Google Scholar]
- 15.Nteziyaremyea V., Wang Y., Li W., Shihb A. Yamaguchi H Surface Finishing of Needles for High-Performance Biopsy. Procedia CIRP. 2014;14:48–53. doi: 10.1016/j.procir.2014.03.010. [DOI] [Google Scholar]
- 16.Mulik R.S., Pandey P.M. Experimental study to determine work-brush interface temperature in magnetic abrasive finishing process. Process. Fabr. Adv. Mater. (PFAM) 2011;XIX:1096–1105. [Google Scholar]
- 17.Mishra A., Goel H., Mulik R.S., Pandey P.M. Determining work-brush interface temperature in magnetic abrasive finishing process. J. Manuf. Processes. 2014;16:248–256. doi: 10.1016/j.jmapro.2013.10.004. [DOI] [Google Scholar]
- 18.Du Z., Chen Y.W., Zhou K., Li C. Research on the electrolytic-magnetic abrasive finishing of nickel-based superalloy GH4169. Int. J. Adv. Manuf. Technol. 2015;81:897–903. doi: 10.1007/s00170-015-7270-4. [DOI] [Google Scholar]
- 19.Judal K.B., Yadava V. Cylindrical Electrochemical Magnetic Abrasive Machining of AISI-304 Stainless Steel. Mater. Manuf. Process. 2013;28:449–456. doi: 10.1080/10426914.2012.736653. [DOI] [Google Scholar]
- 20.Sihag N., Kala N.P., Pandey P.M. Chemo Assisted Magnetic Abrasive Finishing: Experimental Investigations. Procedia CIRP. 2015;26:539–543. doi: 10.1016/j.procir.2014.07.067. [DOI] [Google Scholar]
- 21.Sihag N., Kala N.P., Pandey P.M. Analysis of Surface Finish Improvement during Ultrasonic Assisted Magnetic Abrasive Finishing on chemically treated Tungsten substrate. Procedia Manuf. 2017;10:136–146. doi: 10.1016/j.promfg.2017.07.040. [DOI] [Google Scholar]
- 22.Pandey K., Pandey P.M. Use of chemical oxidizers with alumina slurry in Double Disk Magnetic Abrasive Finishing for improving surface finish of Si (100) J. Manuf. Process. 2018;32:138–150. doi: 10.1016/j.jmapro.2018.02.007. [DOI] [Google Scholar]
- 23.Ahmad S., Gangwar S., Yadav P.C., Singh D.K. Optimization of process parameters affecting surface roughness in magnetic abrasive finishing process. Mater. Manuf. Process. 2017;32:1723–1729. doi: 10.1080/10426914.2017.1279307. [DOI] [Google Scholar]
- 24.Singh G., Kumar H., Kansal H.K. Investigations into internal roundness of Inconel 625 tubes with Chemically assisted Magnetic Abrasive Finishing. Mater. Today Proc. 2020;33:1579–1585. doi: 10.1016/j.matpr.2020.05.002. [DOI] [Google Scholar]
- 25.Singh G., Kumar H. Influence of chemically assisted magnetic abrasive finishing process parameters on external roundness of Inconel 625 tubes. Mater. Today Proc. 2021;37:3283–3288. doi: 10.1016/j.matpr.2020.09.114. [DOI] [Google Scholar]
- 26.Singh G., Kumar H., Kansal H.K. Effects of Chemically assisted Magnetic Abrasive Finishing Process Parameters on Material Removal of Inconel 625 tubes. Procedia Manuf. 2020;48:466–473. doi: 10.1016/j.promfg.2020.05.070. [DOI] [Google Scholar]
- 27.Singh G., Kumar H., Kumar A. Machining of Inconel 718 Flat Surfaces with Chemically Assisted Magnetic Abrasive Finishing Process. Indian J. Sci. Technol. 2018;11:1–6. doi: 10.17485/ijst/2018/v11i22/92337. [DOI] [Google Scholar]
- 28.Singh D.K., Jain V.K., Raghurama V., Komanduri R. Analysis of Surface Texture Generated by A Flexible Magnetic Abrasive Brush. Wear. 2005;259:1254–1261. doi: 10.1016/j.wear.2005.02.030. [DOI] [Google Scholar]
- 29.Girma B., Joshi S.S., Raghuram M.V.G.S., Balasubramaniam R. An Experimental Analysis of Magnetic Abrasive Finishing of Plane Surfaces. Mach. Sci. Technol. 2000;10:323–340. doi: 10.1080/10910340600902140. [DOI] [Google Scholar]
- 30.Singh R.K., Gangwar S., Singh D.K., Ahmad S. Multi-objective optimization of magnetic abrasive finishing by desirability function with genetic algorithm. Int. J. Eng. Sci. Technol. 2021;13:1–9. doi: 10.4314/ijest.v13i1.1S. [DOI] [Google Scholar]
- 31.Misra A., Pandey P.M., Dixit U.S., Roy A., Silberschmidt V.V. Multi-objective optimization of ultrasonic-assisted magnetic abrasive finishing process. Int. J. Adv. Manuf. Technol. 2018;101:1661–1670. doi: 10.1007/s00170-018-3060-0. [DOI] [Google Scholar]
- 32.Babbar A., Sharma A., Singh P. Multi-objective optimization of magnetic abrasive finishing using grey relational analysis. Mater. Today Proc. 2021;50:570–575. doi: 10.1016/j.matpr.2021.01.004. [DOI] [Google Scholar]
- 33.Holland J.H. Adaptation in Natural and Artificial Systems. University of Michigan Press; Ann Arbor, MI, USA: 1975. [Google Scholar]
- 34.Goldberg D.E. Genetic Algorithms in Search Optimization and Machine Learning. Addison Wesley; Boston, MA, USA: 1989. [Google Scholar]
- 35.Roslan Z.B., Ramli Z., Razman M.R., Asyraf M.R.M., Ishak M.R., Ilyas R.A., Nurazzi N.M. Reflections on Local Community Identity by Evaluating Heritage Sustainability Protection in Jugra, Selangor, Malaysia. Sustainability. 2021;13:8705. doi: 10.3390/su13168705. [DOI] [Google Scholar]
- 36.Popescu V.-B., Kanhaiya K., Năstac D.I., Czeizler E., Petre I. Network controllability solutions for computational drug repurposing using genetic algorithms. Sci. Rep. 2022;12:1437. doi: 10.1038/s41598-022-05335-3. [DOI] [PMC free article] [PubMed] [Google Scholar]
- 37.Liu K., Deng B., Shen Q., Yang J., Li Y. Optimization based on genetic algorithms on energy conservation potential of a high speed SI engine fueled with butanol–gasoline blends. Energy Rep. 2022;8:69–80. doi: 10.1016/j.egyr.2021.11.289. [DOI] [Google Scholar]
- 38.Shehadeh A., Alshboul O., Tatari O., Alzubaidi M.A., Hamed El-Sayed Salama A. Selection of heavy machinery for earthwork activities: A multi-objective optimization approach using a genetic algorithm. Alex. Eng. J. 2022;61:7555–7569. doi: 10.1016/j.aej.2022.01.010. [DOI] [Google Scholar]
- 39.Alfarizi M.G., Stanko M., Bikmukhametov T. Well control optimization in waterflooding using genetic algorithm coupled with Artificial Neural Networks. Upstream Oil Gas Technol. 2022;9:100071. doi: 10.1016/j.upstre.2022.100071. [DOI] [Google Scholar]
- 40.Elkhawaga A.M., Mahmoud N.M., Abd Elnaby M.M., Hussein A.H. New hybrid approaches for SLL reduction and size miniaturization of planar antenna arrays based on 2D convolution and genetic algorithm. Alex. Eng. J. 2022;61:7233–7264. doi: 10.1016/j.aej.2021.12.065. [DOI] [Google Scholar]
- 41.Lin X., Cheng M. Design and application of energy planning scheme based on genetic algorithm. Energy Rep. 2022;8:393–400. doi: 10.1016/j.egyr.2022.02.193. [DOI] [Google Scholar]
- 42.Jordán J., Palanca J., Martí P., Julian V. Electric vehicle charging stations emplacement using genetic algorithms and agent-based simulation. Expert Syst. Appl. 2022;197:116739. doi: 10.1016/j.eswa.2022.116739. [DOI] [Google Scholar]
- 43.Kanyilmaz A., Tichell P.R.N., Loiacono D. A genetic algorithm tool for conceptual structural design with cost and embodied carbon optimization. Eng. Appl. Artif. Intell. 2022;112:104711. doi: 10.1016/j.engappai.2022.104711. [DOI] [Google Scholar]
Associated Data
This section collects any data citations, data availability statements, or supplementary materials included in this article.
Data Availability Statement
No data were used to support this study.


