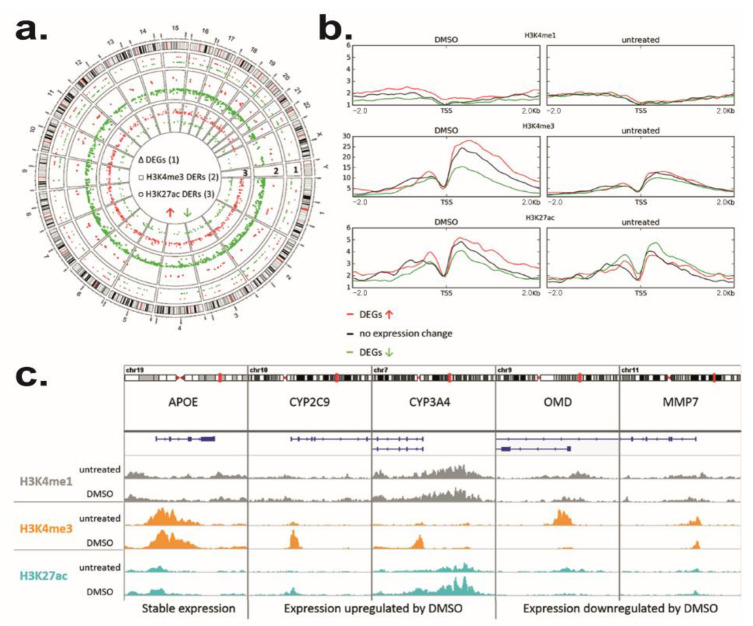
Figure 4.
DMSO effect on genome-wide histone modification patterns in HepaRG differentiation. (a) Genome-wide distribution of DEGs (1, p < 0.005, FC> 2), H3K4me3 differentially enriched regions (DERs, 2) and H3K27ac DERs (3) upon DMSO exposure (padj< 0.001, FC > 2). Increase in expression or enrichment is colored in red, decrease in green. DERs are plotted as log2 fold changes ranging from −3 to 3. (b) Mean coverage of H3K4me1, H3K4me3, and H3K27ac HepaRG cells differentiated with and without DMSO (untreated) in a 2 kb window around TSS of genes with upregulated (red), downregulated (green) or unchanged (black) expression by cultivation with DMSO. (c) Exemplary histone modification patterns at unaffected (APOE), DMSO upregulated (CYP2C9, CYP3A4) and DMSO downregulated (OMD, MMP7) genes. H3K4me1 coverage is displayed in grey, H3K4me3 in orange, and H3K27ac in blue. Coverage tracks were normalized to their sequencing depth.

