Abstract
This study aimed to investigate the antioxidant and anticancer effects of ethanolic and aqueous extracts of the roots of Ficus beecheyana (EERFB and AERFB) and their phenolic components. In this study, total phenolic content and antioxidant activity of EERFB were higher than those of AERFB. Major phenolic compounds in the extracts were gallic acid, p-hydroxybenzoic acid, caffeic acid, chlorogenic acid, p-coumaric acid, and rutin; which were identified by high-performance liquid chromatography. Flow cytometric analysis of HL-60 cells exposed to EERFB showed that the percentage of apoptotic cells increased in a dose-dependent manner. EERFB treatment resulted in the loss of mitochondrial membrane potential and induced the apoptosis of HL-60 cells through a Fas- and mitochondrial-mediated pathway. Finally, pretreatment with general caspase-9/−3 inhibitors prevented EERFB from inhibiting cell viability in HL-60 cells. Our finding suggests that EERFB is an agent that may have antioxidant activity and inhibit the growth of cancer cells.
Keywords: antioxidant activity, apoptosis, Ficus beecheyana, HL-60 cells, phenolic compound
1. Introduction
The majority of the antioxidant activities (such as free radical scavenging) of vegetables, fruits, and herbal medicines may be due to phenolic compounds [1,2]. Several epidemiological studies have indicated that phenolic-rich foods might reduce the risk of many chronic diseases, such as coronary heart disease, cancer, and metabolic syndrome [3,4]. Ficus beecheyana Hook. & Arn. (Moraceae) is widely distributed in East Asia, and grows predominately in China, Taiwan, Hong Kong, and Vietnam. In traditional medicine, the rhizomes of this plant have been used as a herbal remedy to treat diabetes and rheumatism [5]. Lee et al [6] have reported new phenolic compounds isolated from the roots of Ficus beecheyana, including threo-2,3-bis(4-hydroxy-3-methoxyphenyl)-3-ethoxypropan-1-ol, erythro-2,3-bis(4-hydroxy-3-methoxyphenyl)-3-ethoxypropan-1-ol, trans-4, 5-bis(4-hydroxy-3-methoxyphenyl)-1,3-dioxacyclohexane, threo-3-(4-hydroxy-3,5-dimethoxyphenyl)-3-ethoxypropane-1,2-diol, and 2,3-dihydroxy-1-(4-hydroxy-3,5-dimethoxyphenyl)-1-propanone. Lee et al [7] also reported new prenylated flavones (including ficubee A and ficubee B) isolated from the roots of Ficus beecheyana.
Apoptosis or programmed cell death is a normal and fundamental event that occurs in a well-defined manner. This process plays a key role in normal tissue development, maturation, the maintenance of the homeostasis in the body, and the control of the immune system. Apoptosis is characterized by the activation of the caspases, a family of cysteine proteases, followed by specific caspase-mediated morphological changes, such as cell shrinkage, chromatin condensation, nuclear DNA fragmentation, membrane blebbing, and apoptotic body formation [8]. In the present study, we used four cancer cell lines, AGS human gastric adenocarcinoma cells, SW 872 human liposarcoma cells, HL-60 human leukemia cells, and HepG2 human hepatoma cells, which were derived from important types of cancer. Gastric adenocarcinoma is a global health problem and the most common cause of cancer-related death in the world [9]. Liposarcomas are adipocytic tumors and represent the largest single group of soft tissue tumors [10]. Leukemia is a disease characterized by the failure of cell death or the inability of hematopoietic cells to differentiate or undergo apoptosis [11]. Hepatocellular carcinoma is one of the most common malignant tumors worldwide and may be the most common fatal cancer [12]. The antioxidant activity and anticancer effects of the ethanolic (EERFB) and aqueous (AERFB) extracts of the roots of Ficus beecheyana and their phenolic components have not been determined.
The objective of this study was to investigate the antioxidant activity and anticancer effects of EERFB and AERFB. In the present work, EERFB and AERFB were prepared and evaluated to determine their antioxidant activity based on the total phenolic content, oxygen radical absorbance capacity (ORAC), and Trolox equivalent antioxidant capacity (TEAC). The major antioxidant constituents of EERFB and AERFB were identified by high-performance liquid chromatography (HPLC). Furthermore, various human cancer cell lines (AGS cells, SW 872 cells, HL-60 cells, and HepG2 cells) were used to investigate anti-cancer activity in vitro. The anticancer effects of the extract of the roots of Ficus beecheyana through intrinsic and extrinsic pathways in human cancer cells were also investigated.
2. Materials and methods
2.1. Materials
Phenolic acids, flavonoids, Folin & Ciocalteu’s phenol reagent, Trolox, 2,2′-azinobis (3-ethylbenzothiazoline 6-sulfonate) (ABTS), sodium bicarbonate, MTT dye [3-(4,5-dimethylthiazol-2-yl)-2,5-diphenyl tetrazolium bromide], and propidium iodide (PI) were purchased from Sigma Chemical Co. (St. Louis, MO, USA). Dimethylsulfoxide (DMSO) was purchased from Merck Co. (Darmstadt, Germany). 2,2′-Azobis (2-amidinopropane) dihydrochloride (AAPH) was purchased from Wako Pure Chemicals (Osaka, Japan). Leibovitz’s L-15 medium, Ham’s F-12K medium, RPMI-1640 medium, minimum essential medium, fetal bovine serum, nonessential amino acids, sodium pyruvate, and an antibiotic mixture (penicillin–streptomycin) were purchased from Invitrogen Co. (Carlsbad, CA, USA). Anti-Fas, anti-FasL, anti-p53, anti-Bax, anti-Bcl-2, anti-Bak, anti-Bad, anti-tBid, anti-caspase-8, anti-caspase-9, anti-caspase-3, anti-poly (ADP-ribose) polymerase (anti-PARP), and anti-β-actin antibodies; a caspase-3/CPP32 inhibitor (Z-DEVD-FMK); and a caspase-9/Mch6 inhibitor (Z-LEHD-FMK) were purchased from the BioVision (Mountain View, CA, USA). All other chemicals were reagent grade or better.
2.2. Sample extraction
A 100-g sample of dry powdered Ficus beecheyana roots was extracted with ethanol or water (800 mL) in a rotary shaker at room temperature for 24 hours. The ethanolic and aqueous extracts of the roots of Ficus beecheyana (EERFB and AERFB) were filtered through Whatman No. 1 filter paper, dried using a vacuum evaporator, and stored at −20°C until use.
2.3. Determination of the total phenolic content
The total phenolic contents of EERFB and AERFB were determined with Folin & Ciocalteu’s phenol reagent and measured using gallic acid as a standard [13]. Extracts (100 μL) were added to 50% Folin & Ciocalteu’s phenol reagent (100 μL). After 3 minutes, 2 mL of 2% Na2CO3 solution was added to the mixture, which was then left to stand for 30 minutes. The absorbance was measured at 750 nm using a FLUOstar galaxy spectrophotometer (BMG Labtechnologies Ltd., Germany). The total phenolic content is expressed as gallic acid equivalents (GAEs).
2.4. ORAC assay
The determination of the ORAC was performed using a FLUOstar galaxy fluorescence plate reader (BMG Labtechnologies, Ltd., Offenburg, Germany) with a fluorescent filter (excitation wavelength, 540 nm; emission wavelength, 565 nm). Briefly, in the final assay mixture, β-phycoerythrin (β-PE) (16.7 nM) was used as a target of free radical (or oxidant) attack with AAPH (40 mM) as a peroxyl radical generator. Trolox (1 μM) was used as a standard and was prepared fresh daily. The analyzer was programmed to record the fluorescence of β-PE every 5 minutes after AAPH was added. All fluorescence measurements were expressed relative to the initial reading. The final ORAC values were calculated using the differences in the area under the β-PE decay curves between the blank and the extract, and are expressed as micromoles of Trolox equivalents per gram of extract.
2.5. Trolox equivalent antioxidant capacity assay
ABTS•+ was generated by the reaction of ABTS (100 μmol/L), H2O2 (50 μmol/L), and peroxidase (4.4 U/mL). To measure the antioxidant activity, 0.25 mL of extract was mixed well with an equal volume (0.25 mL) of ABTS, H2O2, peroxidase, and 1.5 mL of deionized water. The absorbance was measured at 734 nm after the sample was allowed to react for 10 minutes. The decrease in absorption at 734 nm after the addition of reactant was used to calculate the trolox equivalent antioxidant capacity (TEAC) value. A dose–response curve was plotted for Trolox, and the antioxidant activity was expressed as the TEAC. The higher the TEAC value of a sample, the stronger the antioxidant activity. The TEAC is expressed as micromoles of Trolox equivalents per gram of extract.
2.6. HPLC analysis
The components of the ethanolic and aqueous extracts of the roots of Ficus beecheyana were identified and quantified by HPLC. EERFB and AERFB were diluted and passed through a 0.45-μm polyvinylidene difluoride (PVDF) syringe filter (Acrodisc LCPVDF Syringe Filters, Gelman Laboratory, Ann Arbor, MI, USA). HPLC was performed with a Hitachi liquid chromatography system (Hitachi, Tokyo, Japan) consisting of a model L-6200 pump and a model L-3000 photodiode array detector set at 280 nm. A reverse-phase LiChrospher RP-18 column (250 × 4.6 mm I.D., 5 μm) (Merck, Darmstadt, Germany) was used for HPLC analysis. Elution was performed at room temperature with 2% (v/v) acetic acid in water as Solvent A and 0.5% acetic acid in water and acetonitrile (50:50, v/v) as Solvent B. The elution gradient program was as follows: 5% B to 10% B (0–10 minutes), 10% B to 55% B (10–55 minutes), 55% B to 80% B (55–60 minutes), 80% B to 100% B (60–65 minutes), 100% B to 50% B (65–70 minutes), 50% B to 5% B (70–80 minutes). The flow rate was 1 mL/min. Phenolic compounds were identified by comparison of their retention time (tR) values and UV–vis spectra with those of known standards and were quantified using the peak areas from the chromatograms.
2.7. Cell culture
Human gastric adenocarcinoma cells (AGS cells, BCRC 60102), human liposarcoma cells (SW 872, BCRC 60432), human leukemic cells (HL-60, BCRC 60027), and human hepatoblastoma cells (HepG2 cells, BCRC 60177) were obtained from the Bioresource Collection and Research Center (BCRC, Food Industry Research and Development Institute, Hsinchu, Taiwan, ROC). AGS cells were cultured in Ham’s F-12K medium supplemented with 10% FBS and 100 U/mL penicillin–streptomycin. SW 872 human liposarcoma cells were cultured in Leibovitz’s L-15 medium supplemented with 10% fetal bovine serum and 100 U/mL penicillin–streptomycin. HL-60 cells were cultured in Iscove’s modified Dulbecco’s medium, 20% fetal bovine serum, 1.5 g/L sodium bicarbonate, and 100 U/mL penicillin–streptomycin. HepG2 cells were cultured in minimum essential medium, 10% fetal bovine serum, 1.5 g/L sodium bicarbonate, 0.1 mM nonessential amino acids, 1.0 mM sodium pyruvate, and 100 U/mL penicillin–streptomycin. AGS cells, HL-60 cells, and HepG2 cells were cultured at 37°C in a humidified 5% CO2 incubator. SW 872 cells were cultured at 37°C in a humidified atmosphere with free gas exchange without CO2.
2.8. Cell viability determined using the MTT assay
The MTT assay was performed according to the method of Hsu et al [14]. The human cancer cells (AGS cells, SW 872 cells, HL-60 cells, and HepG2 cells) were plated into 96-well micro-titer plates at a density of 1 × 10⁴ cells/well. After 24 hours, the culture medium was replaced by 200 μL serial dilutions (0 μg/mL, 5 μg/mL, 10 μg/mL, 25 μg/mL, 50 μg/mL, 75 μg/mL, and 100 μg/mL) of EERFB and WERFB and the cells were incubated for 24 hours, 48 hours, and 72 hours. The final concentration of solvent was < 0.1% in cell culture medium. Culture solutions were removed and replaced by 90 μL culture medium. Ten microliters sterile filtered MTT solution (5 mg/mL) in phosphate buffered saline (PBS, pH = 7.4) was added to each well reaching a final concentration of 0.5 mg MTT/mL. Then cells were incubated at 37°C for 2 hours. After the medium and unreacted dye was removed, 200 μL/well of DMSO was added. Absorbance at 570 nm of the dissolved solution was measured by a FLUOstar galaxy spectrophotometer (BMG Labtechnologies Ltd., Germany). The cell viability (%) related to control wells containing cell culture medium without extract was calculated by A570 nm [extract]/A570 nm [control] × 100.
2.9. Analysis of cell apoptosis by flow cytometry (PI staining method)
HL-60 cells stimulated with 0–100 μg/mL EERFB for 24–72 hours were assayed for cell apoptosis using the PI staining method, as previously described [15]. Briefly, cells were harvested using a trypsin–EDTA (TE) solution (0.05% trypsin and 0.02% EDTA in PBS), washed with PBS twice and fixed in 80% ethanol at 4°C for 30 minutes, followed by incubation with 100 μg/mL RNase for 30 minutes at 37°C. The cells were then stained with 40 μg/mL PI for 15 minutes at room temperature and subjected to flow cytometric analysis of the DNA content using a FACScan flow cytometer (Becton-Dickinson Immunocytometry Systems USA, San Jose, CA, USA). Approximately 10,000 events were collected for each sample. The percentages of apoptotic cells were calculated using CELL Quest software (Becton-Dickinson Immunocytometry Systems USA, San Jose, CA, USA).
2.10. Annexin V-fluorescein isothiocyanate/PI double staining assay
Annexin V-fluorescein isothiocyanate (annexin V-FITC/PI) double staining of the cells was performed using the Annexin V-FITC kit (ANNEX100F, SEROTEC, UK). This test is based on the ability of Annexin V-FITC to bind to membrane phospholipids (phosphatidylserine) in the presence of Ca2+. To detect early apoptosis, late apoptosis, and necrosis induced by EERFB, HL-60 cells (1 × 10⁶ cells/dish) were added to each well of a 6-cm dish and incubated for 72 hours at 37°C in 2-mL of culture medium containing test agents at suitable concentrations to give final concentrations of 0 μg/mL, 10 μg/mL, 25 μg/mL, 50 μg/mL, and 100 μg/mL. Approximately 1 × 10⁵ cells were then stained for 10 minutes at room temperature with Annexin V-FITC and PI in a Ca2+ enriched binding buffer (Annexin V-FITC kit) and analyzed using a FACScan flow cytometer. The Annexin V-FITC and PI emissions were detected using the FL 1 and FL 2 channels of a FACScan flow cytometer with emission filters of 525 nm and 575 nm, respectively. The Annexin V-FITC−/PI− population was regarded as normal healthy cells, Annexin V-FITC+/PI− cells were considered early apoptotic cells, Annexin V-FITC+/PI+ cells were considered late apoptotic cells, and Annexin V-FITC−/PI+ cells were considered necrotic cells. Approximately 10,000 events were collected for each sample. The percentages of normal, early apoptotic, late apoptotic, and necrotic cells were calculated using CELL Quest software.
2.11. Mitochondrial membrane potential assay
A mitochondrial membrane potential assay was performed using the JC-1 mitochondrial membrane potential assay kit (Cayman Chemical Co., Ann Arbor, MI, USA). Cells were seeded in 6-well plates. After 24 hours, the cells were treated with 0–100 μg/mL EERFB for 3–12 hours. The cells were labeled with JC-1 according to the manufacturer’s instructions. The cells were resuspended in adequate amounts of the same solution and analyzed using FLUOstar galaxy fluorescence plate reader with an excitation wavelength of 560 nm and an emission wavelength of 595 nm to detect red fluorescence. Apoptotic cells generate a lower level of red fluorescence, and the changes in the mitochondrial membrane potential can most accurately be assessed by comparison of the level red fluorescence of the experimental cells with that of untreated cells and cells treated with EERFB and AERFB. The morphology of the cells were examined by fluorescence microscopy (Motic AE31 inverted microscope with EF-INV Epi-Fluorescence microscopy, USA).
2.12. Western blot analysis
Cells (1 × 10⁷ cells/10 cm dish) were incubated with 0–25 μg/mL EERFB for 3 hours or 6 hours. The cells were collected and lysed in ice-cold lysis buffer [20 mM Tris-HCl (pH 7.4), 2 mM EDTA, 500 μM sodium orthovanadate, 1% Triton X-100, 0.1% SDS, 10 mM NaF, 10 μg/mL leupeptin, and 1 mM PMSF]. The p53, Fas, FasL, Bax, Bcl-2, Bak, Bad, tBid, caspase-8, caspase-9, caspase-3, PARP, and β-actin proteins were assessed in HL-60 cells. The protein concentrations of the extracts were estimated with the Bio-Rad DC protein assay (Bio-Rad Laboratories, Hercules, CA, USA) using bovine serum albumin as the standard. Total proteins (50–60 μg) were separated by sodium dodecyl sulfate–polyacrylamide gel electrophoresis (SDS–PAGE) using a 12% polyacrylamide gel. The proteins in the gel were transferred to a PVDF membrane. The membrane was blocked with 5% skim milk in PBST (0.05% v/v Tween-20 in PBS, pH 7.2) for 1 hour. Membranes were incubated with primary antibody at 4°C overnight and then with secondary antibody for 1 hour. Membranes were washed three times in PBST for 10 minutes between each step. The signal was detected using enhanced chemiluminescence (ECL; Perkin Elmer Life Science, Boston, MA, USA).
2.13. Statistical analysis
Each experiment was performed in triplicate. The results were expressed as the mean ± standard deviation (SD). Statistical analysis was performed using SAS software. Analysis of variance was performed using analysis of variance (ANOVA) procedures. Significant differences (p < 0.05) between the means were determined by Duncan’s multiple range tests.
3. Results
3.1. Determination of antioxidant activities and phenolic contents of EERFB and AERFB
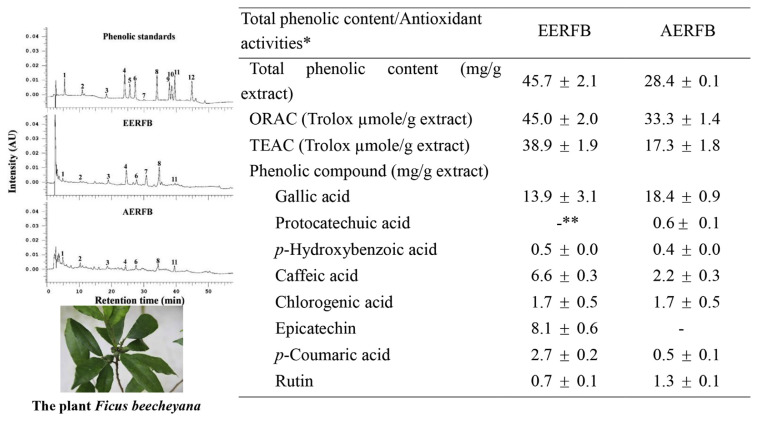
Dry powders of Ficus beecheyana roots were extracted with ethanol and water using a rotary shaker at room temperature for 24 hours. The ethanolic and aqueous extracts were filtered, dried, and diluted. The yields of EERFB and AERFB were 0.92% and 4.42%, respectively (data not shown). Figure 1 shows the total phenolic content, the antioxidant activity, and the contents of specific phenolic compounds of EERFB and AERFB. The total phenolic contents of EERFB and AERFB were 45.7 mg/g and 28.4 mg/g extract, respectively. The antioxidant activities of EERFB and AERFB were evaluated using the ORAC and TEAC assays. The data indicate that EERFB had higher ORAC and TEAC values than AERFB. The ORAC values (Trolox equiv, μM/g extract) of EERFB and AERFB were 45.0 and 33.3, respectively. The TEAC values (Trolox equiv, μM/g extract) of EERFB and AERFB were 38.9 and 17.3, respectively.
Figure 1.
Total phenolic contents, antioxidant activities, and contents of individual phenolic compounds of the ethanolic and aqueous extracts of the roots of Ficus beecheyana. Peak identification: (1) gallic acid; (2) protocatechuic acid; (3) p-hydroxybenzoic acid; (4) caffeic acid; (5) vanillic acid; (6) chlorogenic acid; (7) epicatechin; (8) p-coumaric acid; (9) ferulic acid; (10) sinapinic acid; (11) rutin; and (12) salicylic acid. * The reported values are the means ± SD (n =3). ** Not detected. AERFB =aqueous extract of the roots of Ficus beecheyana; EERFB =ethanolic extract of the roots of Ficus beecheyana; ORAC =oxygen radical absorbance capacity; SD =standard deviation; TEAC =Trolox equivalent antioxidant capacity.
HPLC analysis was performed to identify the phenolic compounds in EERFB and AERFB. Figure 1 presents the HPLC chromatograms of the phenolic standards, EERFB and AERFB. The major phenolic compounds in EERFB and AERFB were identified and included gallic acid, protocatechuic acid (only AERFB), p-hydroxybenzoic acid, caffeic acid, chlorogenic acid, epicatechin (only EERFB), p-coumaric acid, and rutin. EERFB had higher contents of p-hydroxybenzoic acid, caffeic acid, epicatechin, and p-coumaric acid than AERFB, and the contents were 0.5 mg/g, 6.6 mg/g, 8.1 mg/g, and 2.7 mg/g extract, respectively. AERFB had higher contents of gallic acid, protocatechuic acid and rutin than EERFB, and the contents were 18.4 mg/g, 0.6 mg/g, and 1.3 mg/g extract, respectively.
3.2. Effects of EERFB and AERFB on cell viability, cell apoptosis, and the mitochondrial membrane potential
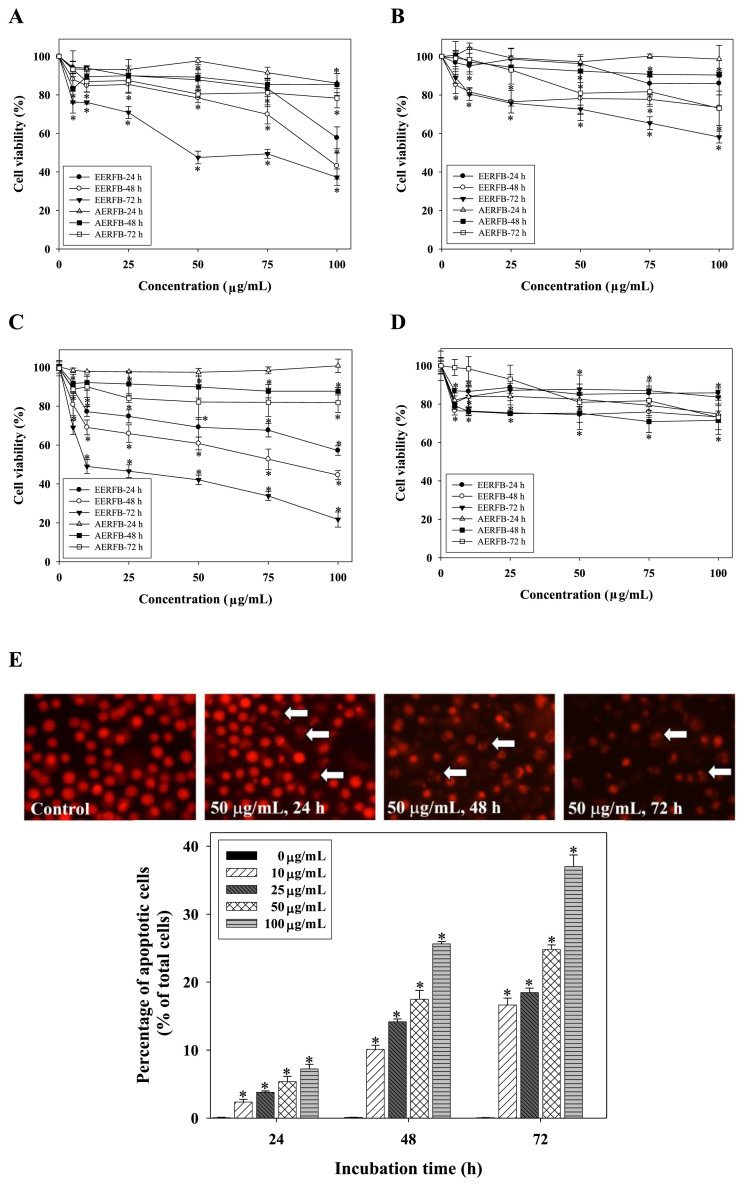
Figures 2A–D presents data on the effects of EERFB and AERFB on the viability of human cancer cells (AGS cells, SW 872 cells, HL-60 cells, and HepG2 cells). The results were obtained with the MTT assay, and the cell viability is expressed as the mean percentage of viable cells relative to untreated cells (taken as 100% viable) at different concentrations of EERFB and AERFB. The results indicate that EERFB had a greater inhibitory effect on human cancer cell growth than AERFB. We also demonstrated that EERFB had a stronger growth inhibitory effect on HL-60 cells. Therefore, EERFB was selected as the sample for the following experiments.
Figure 2.
Effects of EERFB and AERFB on cell viability and the induction of cell apoptosis in human cancer cells. (A) AGS human gastric adenocarcinoma cells; (B) SW 872 human liposarcoma cells; (C) HL-60 human leukemic cells; (D) HepG2 human hepatoblastoma cells; (E) induction of cell apoptosis in HL-60 human leukemic cells (PI staining). Cells were treated with 0–100 μg/mL EERFB or AERFB for 24–72 hours. The cell morphological changes and percentage of apoptotic cells were analyzed by PI staining. The reported values are the means ± SD (n =3). *p < 0.05 is significantly different compared with the control. AERFB =aqueous extract of the roots of Ficus beecheyana; EERFB =ethanolic extract of the roots of Ficus beecheyana.
The inhibition of cell growth might be the result of cytotoxic effects or cell cycle arrest. The results of the present study indicate that EERFB had the strongest inhibitory effect on HL-60 cell growth. However, EERFB did not affect the cell cycle profile (data not shown). To quantify the degree of apoptosis, the amount of sub-G1 DNA was analyzed by flow cytometry. The effects of EERFB on the induction of apoptosis in HL-60 cells are shown in Figure 2E. The data indicate that the addition of EERFB to HL-60 cells resulted in a marked increase in the accumulation of sub-G1 phase cells (apoptotic cells) in a time- and dose-dependent manner.
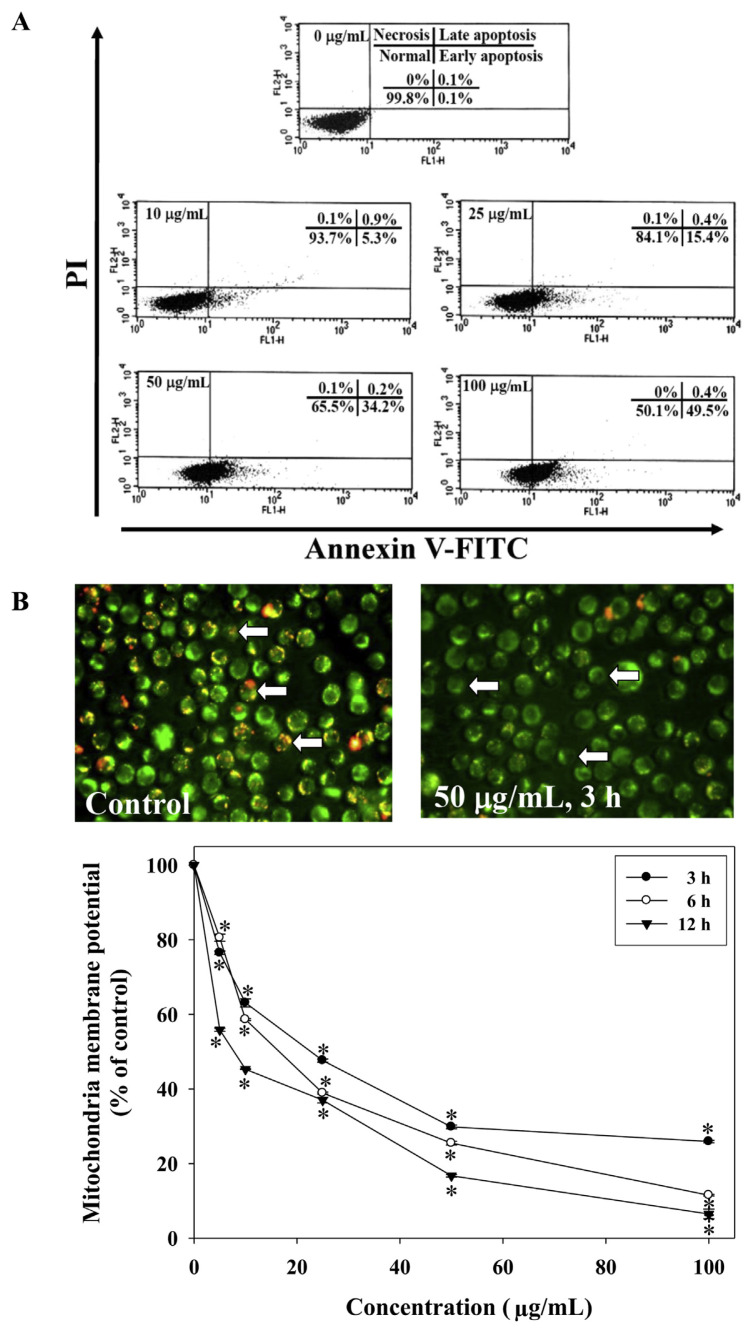
To determine the mode of cell death (apoptosis or necrosis) induced by EERFB, HL-60 cells were treated with EERFB for 72 hours, stained with Annexin V-FITC and PI, and analyzed by flow cytometry. The Annexin V-FITC binding analysis was performed to identify apoptotic cells. PI staining was performed to exclude necrotic cells. Analysis of the cell population revealed the presence of different populations; Annexin V-FITC−/PI− cells were considered normal, Annexin V-FITC+/PI− cells were considered early apoptotic cells, Annexin V-FITC+/PI+ cells were considered late apoptotic cells, and Annexin V-FITC−/PI+ cells were considered necrotic cells. The levels of apoptosis and necrosis induced by EERFB in HL-60 cells are shown in Figure 3A. When the treatment concentrations (0–100 μg/mL) were increased, the percentage of normal cells decreased from 99.8% (control) to 50.1% (100 μg/mL). The percentage of early apoptotic cells increased from 0.1% (control) to 49.5% (100 μg/mL). However, EERFB did not affect the level of necrosis of HL-60 cells. HL-60 cells exhibited a significant decrease in red fluorescence intensity when treated with 0–100 μM EERFB for 3–12 hours (Figure 3B). These data also indicate that EERFB induced a loss of mitochondrial membrane potential in HL-60 cells.
Figure 3.
Effects of EERFB on the induction of cell apoptosis (A) and the loss of mitochondrial membrane potential (B) in HL-60 human leukemic cells. Cells were treated with 0–100 μg/mL EERFB for 72 hours. Arrowheads indicate condensed chromatin. The levels of apoptosis and necrosis were analyzed by Annexin V-FITC/PI double staining. Cells were treated with 0–100 μg/mL EERFB for 72 hours. The mitochondrial membrane potential was analyzed by JC-1 staining. Cells were treated with 0–100 μg/mL EERFB for 3–12 hours. The reported values are the means ± SD (n =3). * p < 0.05 is significantly different compared with the control. EERFB =ethanolic extract of the roots of Ficus beecheyana; SD =standard deviation; V-FITC =V-fluorescein isothiocyanate.
3.3. EERFB induces apoptosis via a Fas- and mitochondrial-mediated pathway
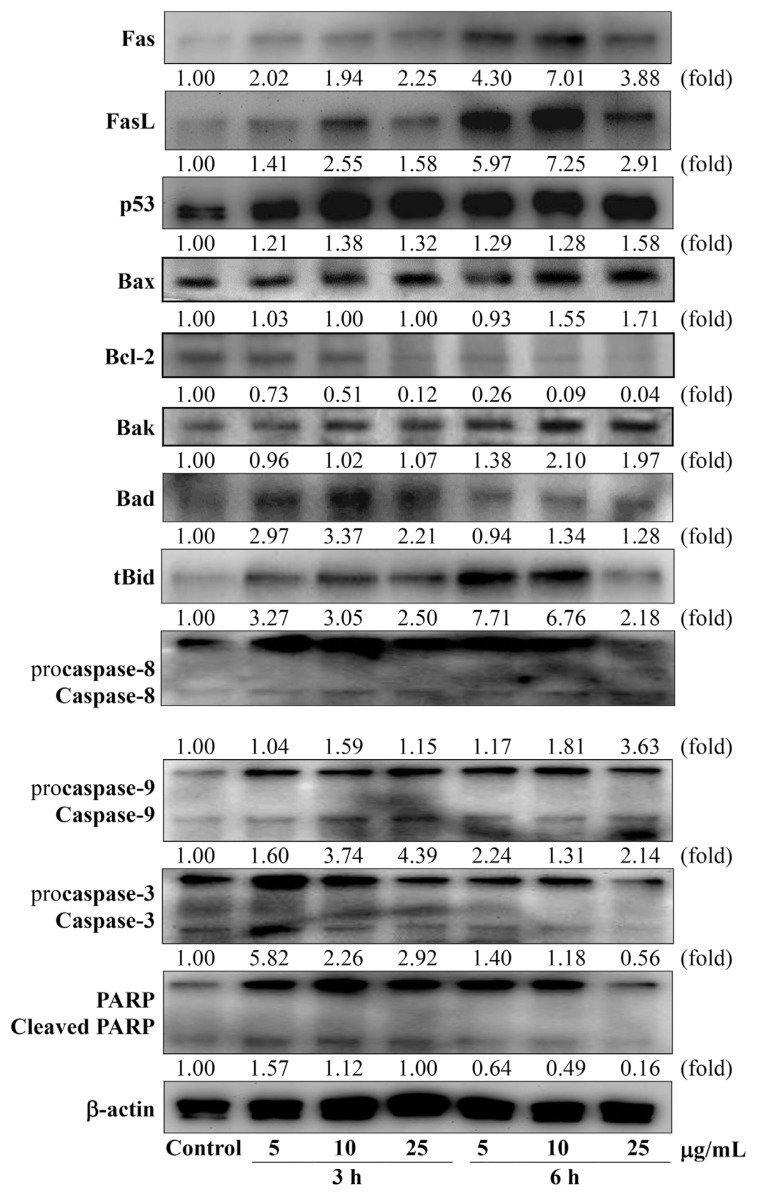
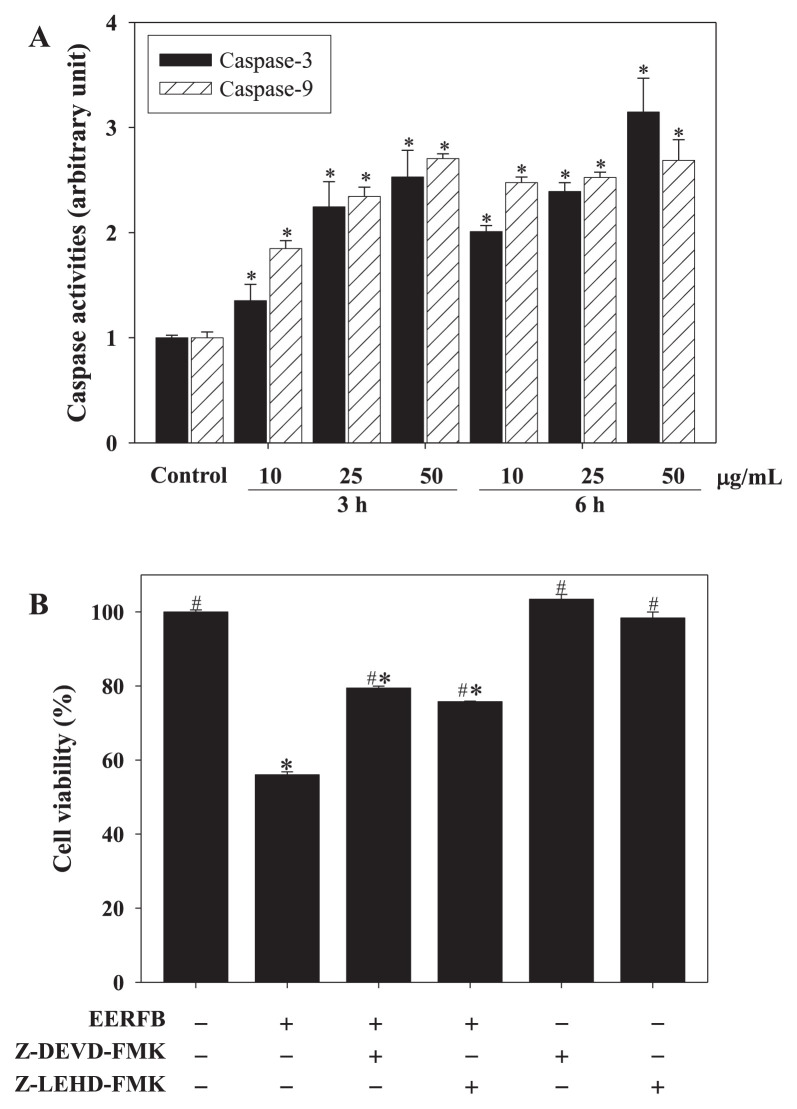
Figure 4 shows the effect of EERFB on the protein levels of Fas, Fas-L, p53, Bcl-2 family members, caspase-8, caspase-9, caspase-3, and PARP in HL-60 human leukemic cells. The protein levels of Fas, FasL, p53, Bax, Bak, tBid, and caspase-8 increased in a time- and dose-dependent manner in HL-60 cells. The protein level of Bcl-2 decreased in a time- and dose-dependent manner in HL-60 cells. EERFB stimulated the expression of Fas, FasL, and Bak, with maximal increases of 7.01-, 7.25-, and 2.10-fold, respectively, after treatment with 10 μg/mL EERFB for 6 hours. EERFB (25 μg/mL, 6 hours) resulted in a significant increase in the relative expression levels of p53, Bax, and caspase-8 from 1.00 (control) to 1.58, 1.71, and 3.63, respectively. The protein levels of Bad, caspase-9, caspase-3, and cleaved PARP in cells treated with EERFB for 3 hours were higher than those of cells treated with EERFB for 6 hours. As shown in Figure 5A, the treatment of HL-60 cells with EERFB caused a significant time- and dose-dependent increase in the caspase-3 and caspase-9 activities. Our data also indicate that EERFB induced the apoptosis of HL-60 cells via a Fas-and mitochondria-dependent pathway. A caspase-3/CPP32 inhibitor (Z-DEVD-FMK) and a caspase-9/Mch6 inhibitor (Z-LEHD-FMK) were used to block intracellular proteases, and then, the decrease in cell viability induced by EERFB was analyzed using the MTT assay. The results shown in Figure 5B indicate that the caspase-3 and caspase-9 inhibitors significantly reduced the decrease in cell viability caused by EERFB in HL-60 cells. Our data indicate that the death receptor signaling pathway might be involved in this process.
Figure 4.
Effect of EERFB on the protein levels of Fas, Fas-L, p53, Bcl-2 family members, caspase-8, caspase-9, caspase-3, and poly (ADP-ribose) polymerase (PARP) in HL-60 human leukemic cells. Cells were treated with 0–25 μg/mL EERFB for 3 hours and 6 hours. The relative protein expression levels were quantified densitometrically using LabWorks 4.5 software and were calculated based on the β-actin reference bands. EERFB =ethanolic extract of the roots of Ficus beecheyana.
Figure 5.
Effects of EERFB on the activities of caspase-3 and caspase-9 (A), and the suppression of cell death by caspase-3 and caspase-9 inhibitors (B) in HL-60 human leukemic cells. Cells were pretreated with 25 μM caspase-3 (Z-DEVD-FMK) and caspase-9 (Z-LEHD-FMK) inhibitors for 3 hours and then treated with 100 μg/mL EERFB for 24 hours. The results are the mean ± SD of three experiments performed in duplicate. *p < 0.05 is significantly different compared with the control. #p < 0.05 compared with EERFB alone. EERFB =ethanolic extract of the roots of Ficus beecheyana; SD =standard deviation; Z-DEVD-FMK =caspase-3/CPP32 inhibitor; Z-LEHD-FMK =caspase-9/Mch6 inhibitor.
3.4. Effect of phenolic compounds from EERFB and AERFB on cell viability
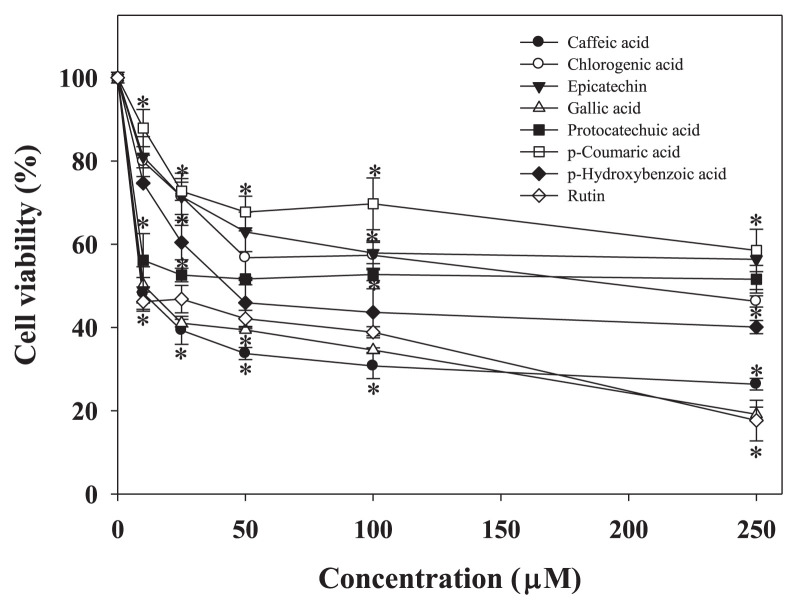
The analytical plot of the phenolic compounds in EERFB and AERFB is shown in Figure 1. The major phenolic compounds in EERFB and AERFB were gallic acid, protocatechuic acid (only AERFB), p-hydroxybenzoic acid, caffeic acid, chlorogenic acid, epicatechin (only EERFB), p-coumaric acid, and rutin. Therefore, to determine the roles of the active phenolic compounds from EERFB and AERFB in the observed anticancer activities, the effects of individual phenolic compounds on the growth of HL-60 cells were compared. As shown in Figure 6, the decrease in cell viability induced by the phenolics in the order of rutin > gallic acid > caffeic acid > p-hydroxybenzoic acid > chlorogenic acid > protocatechuic acid > epicatechin > p-coumaric acid.
Figure 6.
Effect of phenolic compounds in EERFB and AERFB on the viability of HL-60 human leukemic cells. Cells were treated with 0–250 μM phenolic compounds for 72 hours. The reported values are the means ± SD (n =3). * p < 0.05 is significantly different compared with the control. AERFB =aqueous extract of the roots of Ficus beecheyana; EERFB =ethanolic extract of the roots of Ficus beecheyana; SD =standard deviation.
4. Discussion
In traditional medicine, the rhizomes of Ficus beecheyana have been used as an herbal remedy to treat diabetes and rheumatism [5]. Solvent extraction is the most common method used in sample preparation from plants. The analysis of the phytochemicals in the solvent extracts of the roots of Ficus beecheyana has not been performed previously, neither has the anticancer effects of these extracts has been investigated. Therefore, our studies focused on the antioxidant and anti-cancer activities of the extracts of the roots of Ficus beecheyana in human cancer cells. Phenolic compounds are plant secondary metabolites and are important determinants of the sensory and nutritional quality of fruits and vegetables [16].
It has been proposed that the procedures and applications for three assays, the total phenolic content, ORAC and TEAC assays, be considered for standardization [17]. In the present study, the total phenolic, ORAC, and TEAC assays were used to evaluate the antioxidant activity of EERFB and AERFB. As shown in Figure 1, there was a higher total phenolic content in EERFB (45.7 mg/g extract). The ORAC assay is one of the methods used to evaluate the antioxidant capacity of various biological substrates, ranging from pure compounds such as flavonoids to complex matrices such as vegetables and animal tissues [18]. Our data indicate that EERFB had a higher total phenolic content and higher ORAC and TEAC values than AERFB.
Liquid–liquid extraction and column chromatography using different solvents play important roles in the isolation and purification of phenolic compounds [19]. The phenolic compounds in EERFB and AERFB were identified by comparing their relative retention times and UV spectra with those of authentic compounds. Our study indicated that the major phenolic compounds in EERFB and AERFB were gallic acid, protocatechuic acid (only AERFB), p-hydroxybenzoic acid, caffeic acid, chlorogenic acid, epicatechin (only EERFB), p-coumaric acid, and rutin (Figure 1). These results demonstrate that the antioxidant activities of EERFB and AERFB were likely due to the phenolic compounds present in these extracts. Previous studies have shown that phenolic compounds have pharmacological properties, such as antioxidant, antithrombosis, antiinflammatory, anti-HIV-1, and anticancer activities [3,4,20–22].
The MTT assay is a well-established method used to assess mitochondrial integrity [23]. Our present data indicate that EERFB and AERFB significantly decreased the viability of various cancer cells (Figures 2A–D). These results also demonstrate that EERFB was a stronger inhibitor of cell growth and inducer of apoptosis in HL-60 cells (Figures 2E and 3A). Many studies have indicated that polyphenols affect cell functions such as growth, differentiation, and apoptosis [24,25]. Changes in membrane phosphatidylserine play an important role in collapse of the mitochondrial membrane potential [26]. Our data indicate that the treatment of HL-60 cells with EERFB decreased the mitochondrial membrane potential (Figure 3B).
Apoptosis can be activated through two major pathways, the mitochondria-dependent pathway and the death receptor-dependent pathway. In the mitochondria-dependent signaling pathway, the Bcl-2 family plays an important role in proapoptosis and antiapoptosis signaling. This family includes both proapoptotic members (Bax, Bad, and Bak) and antiapoptotic members (Bcl-2) [27]. Our data indicated that EERFB stimulated an increase in the protein levels of Bax, Bak, and Bad, and a decrease in the protein level of Bcl-2 (Figure 4). The regulation of the expression of Bcl-2 family members on the mitochondria is followed by caspase-3 and caspase-9 activation and the cleavage of PARP [28]. The treatment of HL-60 cells with EERFB increased the protein levels of caspase-8, caspase-9, caspase-3, and cleaved PARP and the levels of caspase-9 and caspase-3 activity. (Figures 4 and 5A). Our data also indicate that caspase-9 and caspase-3 inhibitors significantly reduced the reduction in cell viability caused by EERFB in HL-60 cells (Figure 5B). These data suggest that apoptosis induced by EERFB also involves caspase-9- and caspase-3-mediated mechanisms. Moreover, we demonstrated that rutin, gallic acid, and caffeic acid from EERFB have stronger inhibitory effects on human cancer cell growth than other phenolic compounds (Figure 6). Many phenolic compounds such as quercetin, caffeic acid, and rutin show selective cytotoxicity against HL-60 cells with a high activity [29].
In conclusion, the results obtained in the present study indicate that EERFB has potential antioxidant properties that are associated with its chemical composition and can be expressed by the ORAC and TEAC. Our study also demonstrated that EERFB was a better inhibitor of cell growth and inducer of apoptosis in HL-60 cells, and these effects may be related to its the phenolic compounds contained in this extract, especially rutin, gallic acid, and caffeic acid. Furthermore, the results of the present study indicate that EERFB induced apoptosis in HL-60 human leukemic cells via a Fas-and mitochondria-dependent pathway.
Footnotes
Conflicts of interest
The authors have no conflicts of interest to declare.
REFERENCES
- 1. Romani A, Coinu R, Carta S, Pinelli P, Galardi C, Vincieri FF, Franconi F. Evaluation of antioxidant effect of different extracts of Myrtus communis L. Free Radic Res. 2004;38:97–103. doi: 10.1080/10715760310001625609. [DOI] [PubMed] [Google Scholar]
- 2. Yanez J, Vicente V, Alcaraz M, Castillo J, Benavente-Garcia O, Canteras M, Teruel JA. Cytotoxicity and antiproliferative activities of several phenolic compounds against three melanocytes cell lines: relationship between structure and activity. Nutr Cancer. 2004;49:191–9. doi: 10.1207/s15327914nc4902_11. [DOI] [PubMed] [Google Scholar]
- 3. Hertog MG, Kromhout D, Aravanis C, Blackburn H, Buzina R, Fidanza F, Giampaoli S, Jansen A, Menotti A, Nedeljkovic S. Flavonoid intake and long-term risk of coronary heart disease and cancer in the seven countries study. Arch Intern Med. 1995;155:381–6. [PubMed] [Google Scholar]
- 4. Van Duyn MS, Pivonka E. Overview of the health benefits of fruit and vegetable consumption for the dietetics professional: Selected literature. J Am Diet Assoc. 2000;100:1511–21. doi: 10.1016/S0002-8223(00)00420-X. [DOI] [PubMed] [Google Scholar]
- 5.Chiu NY, Chang KH. The illustrated medicinal plants of Taiwan. 3rd ed. Taipei: SMC Publishing Inc; 1992. p. 40. [Google Scholar]
- 6. Lee TH, Kuo YC, Wang GJ, Kuo YH, Chang CI, Lu CK, Lee CK. Five new phenolics from the roots of Ficus beecheyana. J Nat Prod. 2002;65:1497–500. doi: 10.1021/np020154n. [DOI] [PubMed] [Google Scholar]
- 7. Lee CK, Lu CK, Kuo YH, Chen JZ, Sun GZ. New prenylated flavones from the roots of Ficus beecheyana. J Chin Chem Soc. 2004;51:437–41. [Google Scholar]
- 8. Johnstone RW, Ruefli AA, Lowe SW. Apoptosis: a link between cancer genetics and chemotherapy. Cell. 2002;108:153–64. doi: 10.1016/s0092-8674(02)00625-6. [DOI] [PubMed] [Google Scholar]
- 9. Correa P. Helicobacter pylori and gastric cancer: state of the art. Cancer Epidemiol Biomarkers Prev. 1996;5:477–81. [PubMed] [Google Scholar]
- 10.Fletcher CDM, Unni KK, Mertens F. Pathology and genetics, tumors of soft tissue and bone. 4th ed. Lyon: IARC Press; 2000. World Health Organization classification of tumors. [Google Scholar]
- 11. Collins SJ. The HL-60 promyelocytic leukemia cell line: proliferation, differentiation, and cellular oncogene expression. Blood. 1987;70:1233–44. [PubMed] [Google Scholar]
- 12. El-Serag HB, Mason AC. Rising incidence of hepatocellular carcinoma in the United States. N Engl J Med. 1999;340:745–50. doi: 10.1056/NEJM199903113401001. [DOI] [PubMed] [Google Scholar]
- 13. Taga MS, Miller EE, Pratt DE. Chia seed as a source of natural lipid antioxidants. J Am Oil Chem Soc. 1984;61:928–31. [Google Scholar]
- 14. Hsu CL, Lo WH, Yen GC. Gallic acid induces apoptosis in 3T3-L1 preadipocytes via a Fas- and mitochondria-mediated pathway. J Agric Food Chem. 2007;55:7359–65. doi: 10.1021/jf071223c. [DOI] [PubMed] [Google Scholar]
- 15. Takada E, Toyota H, Suzuki J, Mizuguchi J. Prevention of anti-IgM-induced apoptosis accompanying G1 arrest in B lymphoma cells overexpressing dominant-negative mutant form of c-Jun N-terminal kinase 1. J Immunol. 2001;166:1641–9. doi: 10.4049/jimmunol.166.3.1641. [DOI] [PubMed] [Google Scholar]
- 16.Tomas-Barberan FA, Ferreres F, Gil MI. Antioxidant phenolic metabolites from fruit and vegetables and changes during postharvest storage and processing. In: Rahman A, editor. Bioactive natural products (Part D) Amsterdam: Elsevier; 2000. pp. 739–95. [Google Scholar]
- 17. Prior RL, Wu X, Schaich K. Standardized methods for the determination of antioxidant capacity and phenolics in foods and dietary supplements. J Agric Food Chem. 2005;53:4290–302. doi: 10.1021/jf0502698. [DOI] [PubMed] [Google Scholar]
- 18. Kohen R, Beit-Yannai E, Berry EM, Tirosh O. Overall low molecular weight antioxidant activity of biological fluids and tissues by cyclic voltammetry. Methods Enzymo. 1999;300:285–96. doi: 10.1016/s0076-6879(99)00135-4. [DOI] [PubMed] [Google Scholar]
- 19.Van Sumere CF. Phenols and phenolic acids. Methods in plant biochemistry. In: Dey PM, Harborne JB, editors. Plant phenolics. Vol. 1. London, England: Academic Press; 1989. pp. 29–73. [Google Scholar]
- 20. Son S, Lewis BA. Free radical scavenging and antioxidative activity of caffeic acid amide and ester analogues: structure-activity relationship. J Agric Food Chem. 2002;50:468–72. doi: 10.1021/jf010830b. [DOI] [PubMed] [Google Scholar]
- 21. Artico M, Di Santo R, Costi R, Novellino E, Greco G, Massa S, Tramontano E, Marongiu ME, De Montis A, La Colla P. Geometrically and conformationally restrained cinnamoyl compounds as inhibitors of HIV-1 integrase: synthesis, biological evaluation, and molecular modeling. J Med Chem. 1998;41:3948–60. doi: 10.1021/jm9707232. [DOI] [PubMed] [Google Scholar]
- 22. Montpied P, de Bock F, Rondouin G, Niel G, Briant L, Courseau AS, Lerner-Natoli M, Bockaert J. Caffeic acid phenethyl ester (CAPE) prevents inflammatory stress in organotypic hippocampal slice cultures. Brain Res Mol Brain Res. 2003;115:111–20. doi: 10.1016/s0169-328x(03)00178-5. [DOI] [PubMed] [Google Scholar]
- 23.Freshney RI. Culture of animal cells: a manual of basic technique. New York: Wiley; 2000. [Google Scholar]
- 24. Formica JV, Regelson W. Review of the biology of quercetin and related bioflavonoids. Food Chem Toxicol. 1995;33:1061–80. doi: 10.1016/0278-6915(95)00077-1. [DOI] [PubMed] [Google Scholar]
- 25. Caltagirone S, Rossi C, Poggi A, Ranelletti FO, Natali PG, Brunetti M, Aiello FB, Piantelli M. Flavonoids apigenin and quercetin inhibit melanoma growth and metastatic potential. Int J Cancer. 2000;87:595–600. doi: 10.1002/1097-0215(20000815)87:4<595::aid-ijc21>3.0.co;2-5. [DOI] [PubMed] [Google Scholar]
- 26. Raghuvar Gopal DV, Narkar AA, Badrinath Y, Mishra KP, Joshi DS. Protection of Ewing’s sarcoma family tumor (ESFT) cell line SK-N-MC from betulinic acid induced apoptosis by R-DL-tocopherol. Toxicol Lett. 2004;153:201–12. doi: 10.1016/j.toxlet.2004.03.027. [DOI] [PubMed] [Google Scholar]
- 27. Hunt A, Evan G, Apoptosis Till death us do part. Science. 2001;293:1784–5. doi: 10.1126/science.11546862. [DOI] [PubMed] [Google Scholar]
- 28. Green DR, Reed JC. Mitochondria and apoptosis. Science. 1998;281:1309–12. doi: 10.1126/science.281.5381.1309. [DOI] [PubMed] [Google Scholar]
- 29. Chen YH, Chen HY, Hsu CL, Yen GC. Induction of apoptosis by the Lactuca indica L. in human leukemia cell line and its active components. J Agric Food Chem. 2007;55:1743–9. doi: 10.1021/jf063118t. [DOI] [PubMed] [Google Scholar]


