Abstract
Background
Cell survival or death is one of the key scientific issues of inflammatory response. To regulate cell death during the occurrence and development of periodontitis, various forms of programmed cell death, such as pyroptosis, ferroptosis, necroptosis, and apoptosis, have been proposed. It has been found that ferroptosis characterized by iron-dependent lipid peroxidation is involved in cancer, degenerative brain diseases and inflammatory diseases. Furthermore, NCOA4 is considered one of ferroptosis-related genes (FRGs) contributing to butyrate-induced cell death in the periodontitis. This research aims to analyze the expression of FRGs in periodontitis tissues and to explore the relationship between ferroptosis and periodontitis.
Method
Genes associated with periodontitis were retrieved from two Gene Expression Omnibus datasets. Then, we normalized microarray data and removed the batch effect using the R software. We used R to convert the mRNA expression data and collected the expression of FRGs. Gene Ontology (GO), Kyoto Encyclopedia of Genes and Genomes (KEGG), transcription factor (TF) and protein-protein interaction (PPI) network analyses were used. In addition, we constructed a receiver operating characteristic curve and obtained relative mRNA expression verified by quantitative reverse-transcription polymerase chain reaction (PCR).
Results
Eight and 10 FRGs related to periodontitis were upregulated and downregulated, respectively. GO analysis showed that FRGs were enriched in the regulation of glutathione biosynthetic, glutamate homeostasis, and endoplasmic reticulum-nucleus signaling pathway. The top TFs included CEBPB, JUND, ATF2. Based on the PPI network analysis, FRGs were mainly linked to the negative regulation of IRE1-mediated unfolded protein response, regulation of type IIa hypersensitivity, and regulation of apoptotic cell clearance. The expression levels of NCOA4, SLC1A5 and HSPB1 using PCR were significantly different between normal gingival samples and periodontitis samples. Furthermore, the diagnostic value of FRGs for periodontitis were “Good”.
Conclusions
We found significant associations between FRGs and periodontitis. The present study not only provides a new possible pathomechanism for the occurrence of periodontitis but also offers a new direction for the diagnosis and treatment of periodontitis.
Introduction
Periodontitis is characterized by pathological loss of the periodontal ligament and alveolar bone. It is affected by multiple actions of herpes viruses, bacterial pathogens and immune responses [1]. Tissue destruction in periodontitis is considered to be due to an excessive inflammatory response to bacterial plaque. When protecting the host from microbial invasion, polymorphonuclear neutrophils can cause an upregulated response of reactive oxygen species (ROS) [2–5]. ROS plays a key role in periodontitis due to excessive lipid peroxidation and tissue damage [6,7].
Ferroptosis is a form of cell death that depends on iron regulation; it is caused by the accumulation of active oxygen in lipids and loss of activity of the lipid repair enzyme GPX4 [8]. Furthermore, ferroptosis has different molecular characteristics from other forms of cell death [9]. There are two main pathways of ferroptosis, the transporter-dependent pathway and the enzyme-regulated pathway [10]. Data from several studies suggest that the biochemical hallmarks of ferroptosis include accumulation of cellular iron, induction of lipid peroxidation, and loss of antioxidant defense [11]. Ferroptosis has been associated with various pathological conditions such as tumor [12], degenerative diseases [13], ischemia–reperfusion injury [14], and inflammatory diseases [15]. Previous studies have determined that 24 genes play a key role in regulating ferroptosis [16]. These genes are defined as ferroptosis-related genes (FRGs) [17]. In general, the main ferroptosis-inducing event is lipid peroxidation. Interestingly, the characteristics of periodontitis include increased metabolites of lipid peroxidation, alveolar bone resorption, and increased inflammatory factors [18]. However, whether the periodontal pathogens can induce ferroptosis has rarely been reported.
Based on the results of previous studies [19,20], we designed the present study to analyze the effects of ferroptosis on periodontitis using bioinformatics methods and found that there is a clear association between ferroptosis and periodontitis.
Methods
Microarray data
Two microarray datasets of Periodontitis—GSE16134 and GSE10334—were downloaded from the GEO database (http://www.ncbi.nlm.nih.gov/geo/), using the following keywords: “periodontitis,” and “Homo sapiens.” GSE16134 and GSE10334 were submitted by Demmer RT, Pavlidis P, Papapanou PN. Since these were public datasets, it is impossible to obtain comprehensive personal information, which appears to be a potential limitation. The data obtained from GEO is shown in Table 1.
Table 1. The data obtained from GEO.
| GEO gene set ID | GSE16134 | GSE10334 |
|---|---|---|
| Platform | GPL570: [HG-U133_Plus_2] Affymetrix Human Genome U133 Plus 2.0 Array | |
| Number of Affected sites vs. Unaffected sites | 241 vs. 69 | 183 vs. 64 |
| Clinical Data | ||
| Affected sites | Probing Depth > 4 mm, Clinical Attachment Loss ≥ 3 mm, with Bleeding on Probing | Probing Depth > 4 mm, Clinical Attachment Loss ≥ 3 mm, with Bleeding on Probing |
| Unaffected sites | Probing Depth ≤ 4 mm, Clinical Attachment Loss ≤ 2 mm, no Bleeding on Probing | Probing Depth ≤ 4 mm, Clinical Attachment Loss ≤ 2 mm, no Bleeding on Probing |
| Smoking | Not | Not |
Normalized data and batch effect removed
The normalization of data was realized by log2 transformation. PreprocessCore package (R version: 3.4.1) was used to normalize the microarray data. Then we converted the probes into gene symbols according to the GEO annotation information. The probes containing multiple genes were integrated by averaging. Variance stabilized counts was used to control initial quality and individual horse effect removed by the Remove Batch Effect function of limma R package.
Enrichment analyses
The ferroptosis-related genes were uploaded to the ClueGo (version: 2.5.7). P <0.05 indicates a significant difference. In order to confirm the underlying function, the differentially expressed genes (DEGs) were analyzed through GO functional enrichment. GO is a representative and standardized work platform for terminology description or word meaning interpretation of gene and gene product characteristics. The role of FRGs in healthy tissues was observed by Metascape (https://metascape.org). We used the Cluster Profiler package (R version: 4.0.3) to analyze the GO function of DEGs. KEGG is known for "understanding the advanced functions of biological systems and a library of utility programs". KOBAS 3.0 (http://kobas.cbi.pku.edu.cn/kobas3) was used to enrich the KEGG pathway [21]. The box plot was implemented by the ggplot2 package; PCA graphs were drawn by the ggord package; the heat map was displayed by the pheatmap package.
ChIP-X enrichment analysis 3 (ChEA3)
ChEA3 (https://amp.pharm.mssm.edu/ChEA3) is a tool to find TF targets and sort them [22]. We can use it to obtain related biological functions of FRGs.
PPI network construction and module analysis
We used the STRING (version: 11.0) (http://string-db.org) to construct a PPI network of the FRGs and the DEGs. When the composite score is> 0.4, the interaction is significant. More in-depth analysis of the interactive network can be realised by the Cytoscape (version: 3.8.2).
The diagnostic value of FRGs for periodontitis
We established a ROC curve by MedCalc (version: 20.0.3). And area under the curve (AUC) means the diagnostic value of these hub genes for periodontitis. The diagnostic efficacy represented by AUC is divided into three levels: average (0.5–0.7), good (0.7–0.9), and excellent (0.9–1.0).
Collection of tissue specimens
6 diseased and 6 healthy gingival tissues specimens were obtained from patients in The Second Affiliated Hospital of Harbin Medical University. (Harbin, People’s Republic of China). All patients understand the nature of this study. The Ethics Committee of The Second Affiliated Hospital of Harbin Medical University reviewed and approved this study. We obtained informed written consent.
Real‐time quantitative PCR (qRT-PCR)
RNA was extracted from gingival samples using RNAiso Plus (TaKaRa, China). Then we used cDNA synthesis kit (TIANGEN, China) to reverse transcription. The primers for qRT-PCR were supply by GENERAL BIOL (China). The comparative 2 −ΔΔCt method was used for relative quantification. The primer sequences were described by Table 2. The analysis were calculated using GraphPad (version: 8.0.1). Statistical significance between two groups was evaluated by t test (p < 0.05).
Table 2. PCR primer sequences.
| Gene | Forward Primer (5’ to 3’) | Reverse Primer (5’ to 3’) |
|---|---|---|
| NCOA4 | GAGGTGTAGTGATGCACGGAG | GACGGCTTATGCAACTGTGAA |
| HSPB1 | ACGGTCAAGACCAAGGATGG | AGCGTGTATTTCCGCGTGA |
| SLC1A5 | GAGCTGCTTATCCGCTTCTTC | GGGGCGTACCACATGATCC |
Result
Identification of up/downregulated DEGs and FRGs
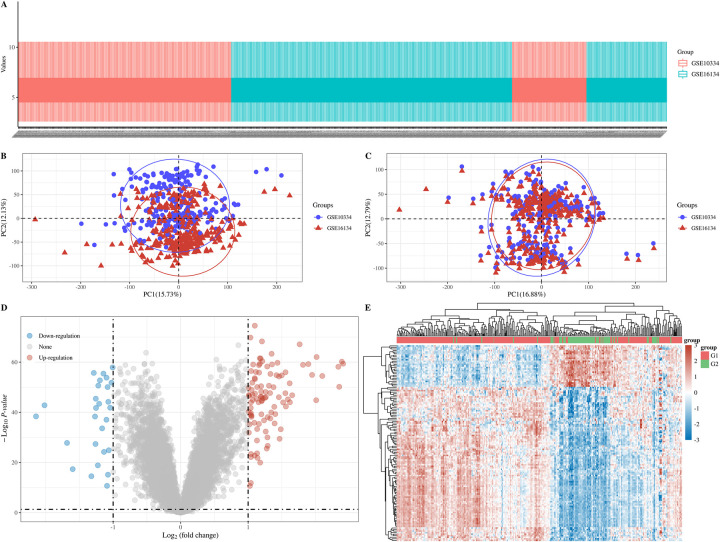
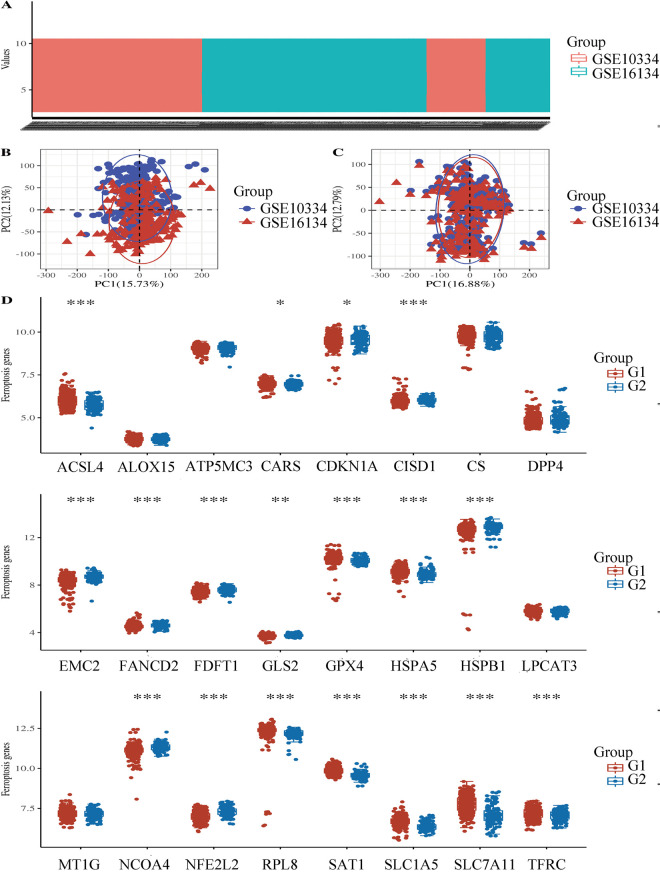
128 common DEGs in GSE16134 and GSE10334 between affected and unaffected groups were identified using R. We found that 101 DEGs were significantly upregulated and 27 DEGs were significantly downregulated (Table 3), the proportion was about 3.7:1. In this result, 8 ferroptosis-related genes related to periodontitis were up-regulated and 10 genes were down-regulated. The results after normalized data and individual horse effect removed are shown in Figs 1–3. And the frequency of NCOA4’s detection as the S1 Fig shows.
Table 3. Up/Downregulated DEGs.
| Gene symbol | Adjusted P-value | Fold change | Gene title |
|---|---|---|---|
| ADA2 | 3.92E-57 | 1.553844 | adenosine deaminase 2 |
| BHLHA15 | 7.42E-58 | 1.588507 | basic helix-loop-helix family, member a15 |
| BTG2 | 1.07E-48 | 1.162589 | BTG family, member 2 |
| C16ORF54 | 3.83E-56 | 1.559668 | chromosome 16 open reading frame 54 |
| C3 | 9.22E-53 | 1.185639 | complement component 3 |
| C4B | 1.95E-59 | 1.205283 | complement component 4B (Chido blood group) |
| CCL18 | 1.34E-43 | 1.131173 | chemokine (C-C motif) ligand 18 |
| CCN1 | 3.80E-53 | 1.133135 | cellular communication network factor 1 |
| CCN2 | 4.85E-57 | 1.01127 | cellular communication network factor 2 |
| CD177 | 8.00E-57 | 1.096126 | CD177 molecule |
| CD19 | 3.41E-64 | 1.192922 | CD19 molecule |
| CD27 | 1.81E-45 | 1.813238 | CD27 molecule |
| CD38 | 8.02E-43 | 1.551755 | CD38 molecule |
| CD79A | 5.19E-50 | 1.947502 | CD79a molecule, immunoglobulin-associated alpha |
| CFI | 6.18E-44 | 1.00665 | complement factor I |
| COL15A1 | 3.12E-41 | 1.205063 | collagen, type XV, alpha 1 |
| COL4A1 | 4.04E-54 | 1.160181 | collagen, type IV, alpha 1 |
| COL4A2 | 3.09E-46 | 1.1936 | collagen, type IV, alpha 2 |
| CORO1A | 8.85E-43 | 1.042673 | coronin, actin binding protein, 1A |
| CPNE5 | 5.56E-53 | 1.308945 | copine V |
| CSF2RB | 1.49E-32 | 1.173406 | colony stimulating factor 2 receptor, beta, low-affinity (granulocyte-macrophage) |
| CSF3 | 6.58E-29 | 1.259706 | colony stimulating factor 3 |
| CTSH | 1.38E-52 | 1.034782 | cathepsin H |
| CXCL1 | 9.72E-45 | 1.891672 | chemokine (C-X-C motif) ligand 1 (melanoma growth stimulating activity, alpha) |
| CXCL12 | 1.96E-57 | 1.075039 | chemokine (C-X-C motif) ligand 12 |
| CXCL13 | 4.72E-53 | 1.392421 | chemokine (C-X-C motif) ligand 13 |
| CXCL6 | 2.39E-38 | 2.008496 | chemokine (C-X-C motif) ligand 6 |
| CXCL8 | 8.48E-35 | 1.275532 | chemokine (C-X-C motif) ligand 8 |
| CXCR4 | 4.07E-41 | 1.763415 | chemokine (C-X-C motif) receptor 4 |
| CYP24A1 | 1.45E-48 | 1.376211 | cytochrome P450, family 24, subfamily A, polypeptide 1 |
| CYTIP | 6.14E-57 | 1.615435 | cytohesin 1 interacting protein |
| DDIT4L | 1.16E-60 | 1.051272 | DNA-damage-inducible transcript 4-like |
| DERL3 | 5.72E-39 | 1.013822 | derlin 3 |
| DNAJB9 | 1.63E-53 | 1.022911 | DnaJ (Hsp40) homolog, subfamily B, member 9 |
| DUSP5 | 1.06E-36 | 1.049658 | dual specificity phosphatase 5 |
| EGFL6 | 2.65E-46 | 1.102904 | EGF-like-domain, multiple 6 |
| ENPP2 | 4.46E-49 | 1.133815 | ectonucleotide pyrophosphatase/phosphodiesterase 2 |
| EVI2B | 3.21E-26 | 1.498001 | ecotropic viral integration site 2B |
| FCGR2B | 3.37E-37 | 1.249936 | Fc fragment of IgG, low affinity IIb, receptor (CD32) |
| FCGR3A | 1.95E-29 | 1.132553 | Fc fragment of IgG, low affinity IIIa, receptor (CD16a) |
| FCGR3B | 3.23E-56 | 1.342826 | Fc fragment of IgG, low affinity IIIb, receptor (CD16b) |
| FCN1 | 3.76E-25 | 1.011778 | ficolin (collagen/fibrinogen domain containing) 1 |
| FCRL5 | 9.33E-45 | 1.455488 | Fc receptor-like 5 |
| FCRLA | 1.09E-31 | 1.402519 | Fc receptor-like A |
| FKBP11 | 1.04E-46 | 1.42036 | FK506 binding protein 11 |
| FOS | 1.75E-44 | 1.290024 | FBJ murine osteosarcoma viral oncogene homolog |
| HBA1 | 5.87E-36 | 1.14025 | hemoglobin, alpha 1 |
| HCLS1 | 2.79E-44 | 1.210277 | hematopoietic cell-specific Lyn substrate 1 |
| HSPA13 | 5.84E-58 | 1.159802 | heat shock protein 70kDa family, member 13 |
| ICAM2 | 1.63E-43 | 1.347935 | intercellular adhesion molecule 2 |
| IGLL5 | 3.07E-65 | 2.336454 | immunoglobulin lambda-like polypeptide 5 |
| IL10RA | 3.18E-43 | 1.354325 | interleukin 10 receptor, alpha |
| IL1B | 2.82E-38 | 1.092466 | interleukin 1 beta |
| IL2RG | 6.34E-45 | 1.100459 | interleukin 2 receptor, gamma |
| ITM2C | 7.28E-47 | 1.184677 | integral membrane protein 2C |
| JCHAIN | 6.48E-49 | 1.286419 | joining chain of multimeric IgA and IgM |
| LAX1 | 6.21E-59 | 1.652774 | lymphocyte transmembrane adaptor 1 |
| LY96 | 6.74E-45 | 1.12351 | lymphocyte antigen 96 |
| MME | 9.12E-20 | 1.282694 | membrane metallo-endopeptidase |
| MMP1 | 3.92E-57 | 1.025763 | matrix metallopeptidase 1 |
| MMP12 | 5.57E-59 | 1.466344 | matrix metallopeptidase 12 |
| MMP13 | 5.12E-54 | 1.178796 | matrix metallopeptidase 13 |
| MMP3 | 9.63E-57 | 1.040563 | matrix metallopeptidase 3 |
| MMP7 | 1.34E-34 | 1.51808 | matrix metallopeptidase 7 |
| MZB1 | 7.94E-43 | 2.407337 | marginal zone B and B1 cell-specific protein |
| NCF4 | 1.49E-21 | 1.195206 | neutrophil cytosolic factor 4 |
| ODAM | 1.33E-48 | 1.483623 | odontogenic, ameloblast associated |
| P2RY8 | 1.21E-32 | 1.215359 | purinergic receptor P2Y, G-protein coupled, 8 |
| PDZRN4 | 2.52E-23 | 1.289339 | PDZ domain containing ring finger 4 |
| PECAM1 | 3.01E-28 | 1.098606 | platelet/endothelial cell adhesion molecule 1 |
| PIM2 | 4.14E-44 | 1.325032 | Pim-2 proto-oncogene, serine/threonine kinase |
| PLAC8 | 3.25E-54 | 1.260461 | placenta specific 8 |
| PLAT | 4.49E-46 | 1.43498 | plasminogen activator, tissue |
| PLPP5 | 1.40E-51 | 1.0399 | phospholipid phosphatase 5 |
| PNOC | 5.11E-71 | 1.387546 | prepronociceptin |
| POU2AF1 | 6.04E-52 | 2.388694 | POU class 2 associating factor 1 |
| PPBP | 1.82E-22 | 1.041058 | pro-platelet basic protein |
| PROK2 | 4.58E-35 | 1.042763 | prokineticin 2 |
| PTP4A3 | 6.34E-57 | 1.07086 | protein tyrosine phosphatase type IVA, member 3 |
| RAC2 | 1.11E-43 | 1.173037 | ras-related C3 botulinum toxin substrate 2 (rho family, small GTP binding protein Rac2) |
| RGS1 | 1.19E-45 | 1.196332 | regulator of G-protein signaling 1 |
| RGS4 | 3.12E-50 | 1.154445 | regulator of G-protein signaling 4 |
| RHOH | 1.54E-47 | 1.262168 | ras homolog family member H |
| RNASE6 | 8.98E-38 | 1.065063 | ribonuclease, RNase A family, k6 |
| SASH3 | 2.65E-37 | 1.005489 | SAM and SH3 domain containing 3 |
| SEL1L3 | 1.43E-54 | 1.097714 | sel-1 suppressor of lin-12-like 3 (C. elegans) |
| SELE | 4.59E-23 | 1.235928 | selectin E |
| SELENOM | 8.56E-43 | 1.199581 | selenoprotein M |
| SELL | 6.58E-22 | 1.458 | selectin L |
| SERPINI1 | 6.35E-12 | 1.038916 | serpin peptidase inhibitor, clade I (neuroserpin), member 1 |
| SFRP4 | 9.20E-39 | 1.32865 | secreted frizzled-related protein 4 |
| SLAMF7 | 9.87E-41 | 1.619179 | SLAM family member 7 |
| SPAG4 | 5.26E-38 | 2.09838 | sperm associated antigen 4 |
| SRGN | 1.36E-66 | 1.043883 | serglycin |
| ST6GAL1 | 8.80E-11 | 1.051981 | ST6 beta-galactosamide alpha-2,6-sialyltranferase 1 |
| TAGAP | 1.73E-34 | 1.11477 | T-cell activation RhoGTPase activating protein |
| TENT5C | 3.19E-45 | 2.014512 | terminal nucleotidyltransferase 5C |
| THEMIS2 | 1.45E-45 | 1.330465 | thymocyte selection associated family member 2 |
| TNFRSF17 | 2.93E-31 | 2.349733 | tumor necrosis factor receptor superfamily, member 17 |
| VCAN | 2.92E-39 | 1.038621 | versican |
| ZNF275 | 2.71E-48 | 1.062687 | zinc finger protein 275 |
| AADAC | 3.00E-42 | -1.20712 | arylacetamide deacetylase |
| AADACL2 | 1.08E-41 | -2.01688 | arylacetamide deacetylase-like 2 |
| ABCA12 | 6.64E-33 | -1.16284 | ATP binding cassette subfamily A member 12 |
| ATP6V1C2 | 1.23E-53 | -1.14311 | ATPase, H+ transporting, lysosomal 42kDa, V1 subunit C2 |
| BPIFC | 3.48E-44 | -1.25704 | BPI fold containing family C |
| CALML5 | 6.56E-27 | -1.26108 | calmodulin-like 5 |
| CLDN20 | 6.70E-54 | -1.28623 | claudin 20 |
| COBL | 6.96E-56 | -1.00726 | cordon-bleu WH2 repeat protein |
| DSC1 | 1.76E-37 | -2.14211 | desmocollin 1 |
| ELOVL4 | 1.09E-40 | -1.25365 | ELOVL fatty acid elongase 4 |
| EPCAM | 3.33E-36 | -1.09877 | epithelial cell adhesion molecule |
| FAM83C | 3.12E-50 | -1.02485 | family with sequence similarity 83, member C |
| FLG | 1.06E-18 | -1.22646 | filaggrin |
| FLG2 | 2.61E-27 | -1.68284 | filaggrin family member 2 |
| KRT1 | 7.92E-11 | -1.09036 | keratin 1, type II |
| KRT2 | 3.04E-17 | -1.5992 | keratin 2, type II |
| LCE2B | 1.67E-24 | -1.0645 | late cornified envelope 2B |
| LOR | 1.67E-14 | -1.32218 | loricrin |
| MAMDC2 | 7.12E-24 | -1.13528 | MAM domain containing 2 |
| NEFL | 4.06E-49 | -1.21988 | neurofilament, light polypeptide |
| NPR3 | 3.87E-52 | -1.09761 | natriuretic peptide receptor 3 |
| POF1B | 1.36E-48 | -1.08209 | premature ovarian failure, 1B |
| RPTN | 4.38E-15 | -1.07675 | repetin |
| SLC16A9 | 5.53E-43 | -1.0713 | solute carrier family 16, member 9 |
| SLC19A2 | 8.89E-41 | -1.04423 | solute carrier family 19 (thiamine transporter), member 2 |
| SLC27A6 | 2.00E-37 | -1.26819 | solute carrier family 27 (fatty acid transporter), member 6 |
| SPAG17 | 4.10E-51 | -1.19574 | sperm associated antigen 17 |
Fig 1.
A: Box plot, GSE10334 is shown in red and GSE16134 is shown in blue; B: PCA results before batch removal; C: PCA results after batch removal; D: Volcano plots, and |log2(FC)|>1, the over-expressed mRNAs are shown in red and the down-expressed mRNAs are shown in blue, the ordinate represents -log10 P-value; E: Hierarchical clustering analysis of mRNAs, different colors represent different expression trends, G1: Affected; G2: Unaffected.
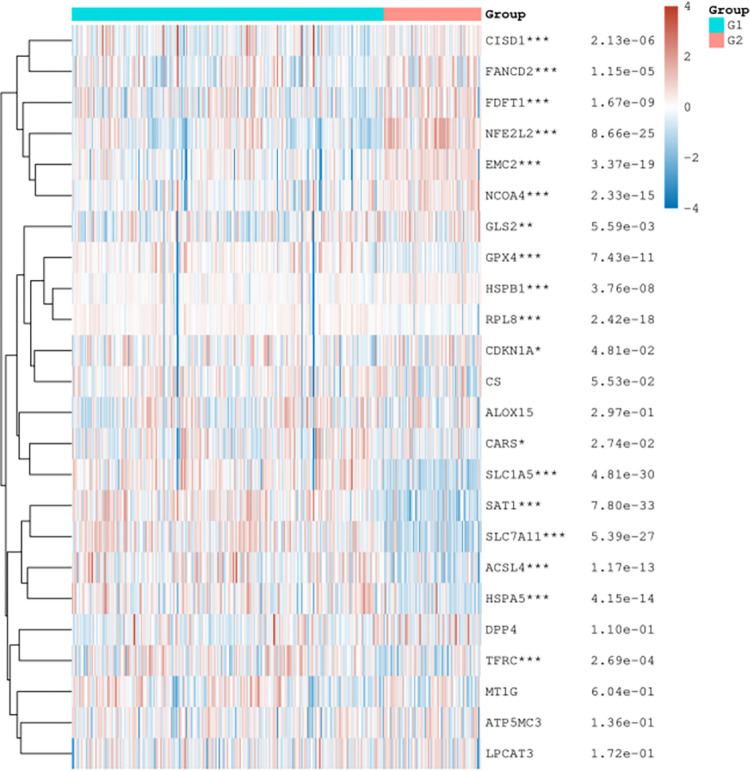
Fig 3. Ferroptosis-related gene expression heat map.
The expression trend in different samples were represented by different colors. * p-value < 0.05, **p-value < 0.01, ***p-value < 0.001. The significance of the two groups passed the Wilcox test.
Fig 2.
A: Box plot, GSE10334 is shown in red and GSE16134 is shown in blue; B: PCA results before batch removal; C: PCA results after batch removal; D: The expression distribution of Ferroptosis-related mRNA in case and control groups, where the horizontal axis indicates the name of mRNA, the vertical axis indicates the expression of mRNA, and the upper left corner represents the significance p-value test method. Asterisks represent levels of significance *p-value < 0.05, **p-value < 0.01, ***p-value < 0.001.
GO enrichment
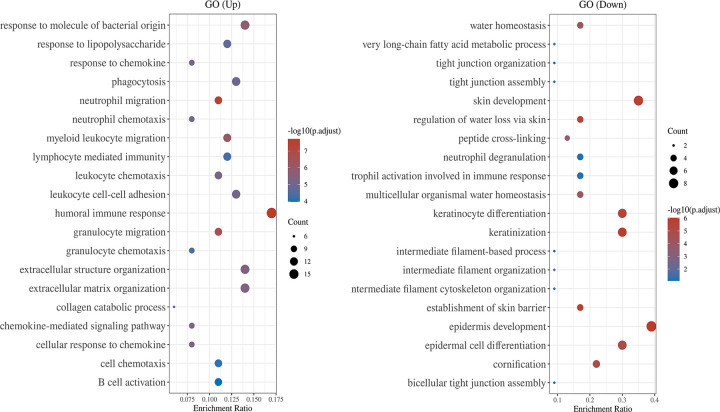
GO (Fig 4) showed that upregulated DEGs were enriched for humoral immune response, response to molecule of bacterial origin, extracellular structure organization, phagocytosis, and leukocyte cell-cell adhesion. Downregulated DEGs were enriched for the epidermis development, skin development, keratinocyte differentiation, keratinization, and epidermal cell differentiation. The results of functional enrichment analysis of FRGs in normal tissues are shown in S1 Table.
Fig 4. The abscissa represents gene ratio and the ordinate represents the enriched pathways.
GO analysis of potential targets of mRNAs. The cellular component, biological process, and molecular function of FRGs were clustered based on Cluster Profiler package (R version: 3.18.0). In the enrichment result, p-value <0.05 or false discovery rate (FDR) <0.05 is considered to be enriched to a meaningful pathway.
KEGG pathway enrichment analysis
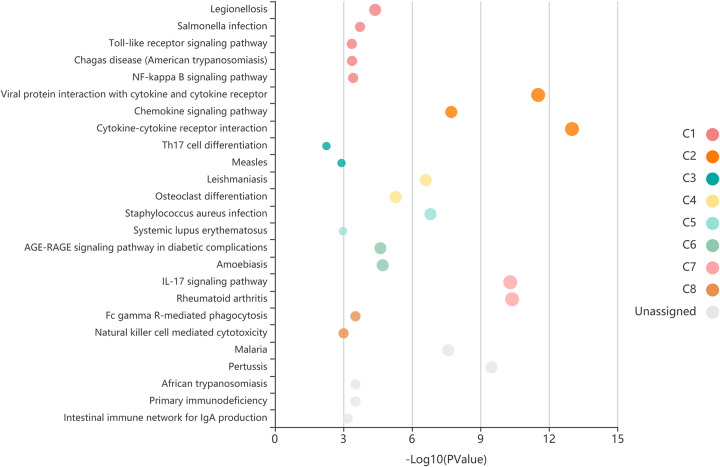
Fig 5 shows the result of KEGG pathway enrichment analysis. The five most regulated DEGs were those for the Cytokine-cytokine receptor interaction, Viral protein interaction with cytokine and cytokine receptor, Rheumatoid arthritis, IL-17 signaling pathway and Chemokine signaling pathway.
Fig 5. Each bubble which represents an enriched function is according to the number of input genes in this term.
The size of the bubble represents the different significance levels. The different color of the bar and bubbles represent different modules, named C1-C8. If there are more than 5 terms in each module, top 5 with the highest enrich ratio will be displayed.
GO-Biological process of ferroptosis-related genes
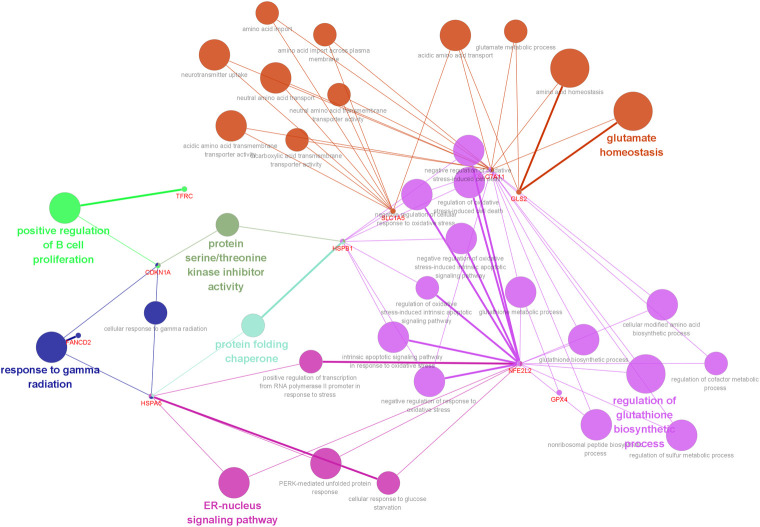
It was found that overlapping targets of ferroptosis-related genes in periodontitis were involved in 34 pathways by using ClueGO analysis, including regulation of glutathione biosynthetic, glutamate homeostasis, ER-nucleus signaling pathway, response to gamma radiation, protein folding chaperone, positive regulation of B cell proliferation, protein serine/threonine kinase inhibitor activity, and so on (Fig 6).
Fig 6. Pathways by using ClueGO analysis, p-value<0.05.
Different pathways are represented by different colors.
TF target analysis
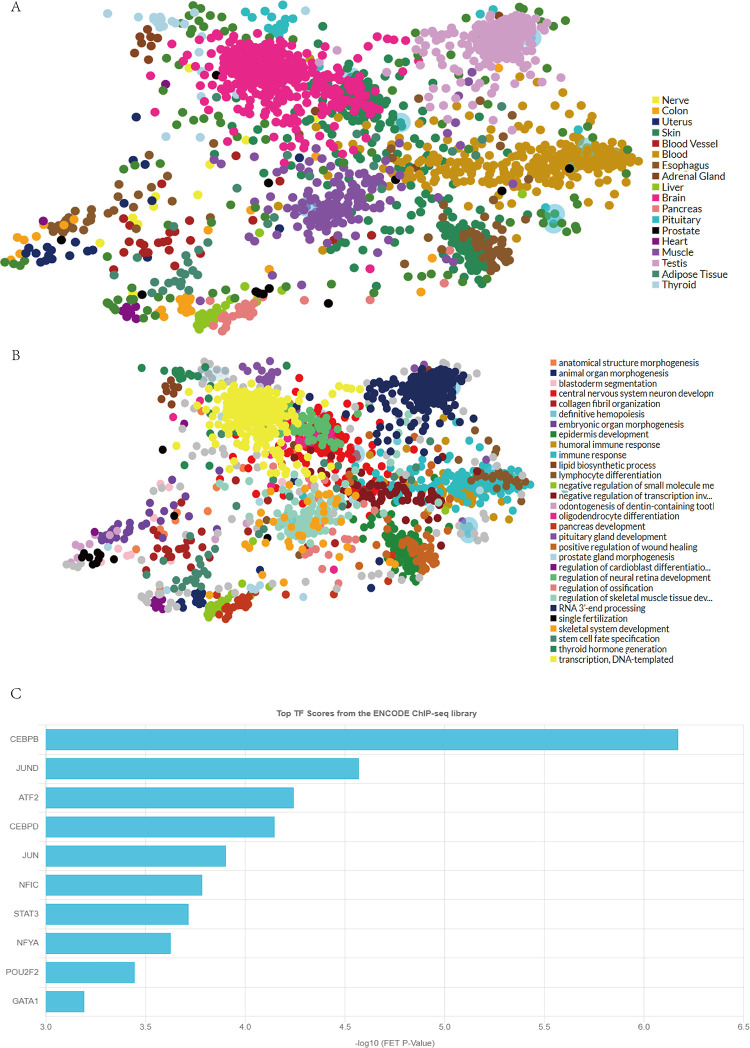
The TFs were found to be distributed in various tissues, such as the muscle, brain, testis, and blood (Fig 7A). And the TF targets’ functions included immune response, DNA transcription, and skeletal muscle tissue development (Fig 7B). The top 10 TFs included CEBPB, JUND, ATF2, CEBPD, and JUN (Fig 7C).
Fig 7.
A: Various tissues, different tissues are represented by different colors; B: The functions of the TF targets, different functions are represented by different colors; C: The top 10 TFs.
PPI analysis
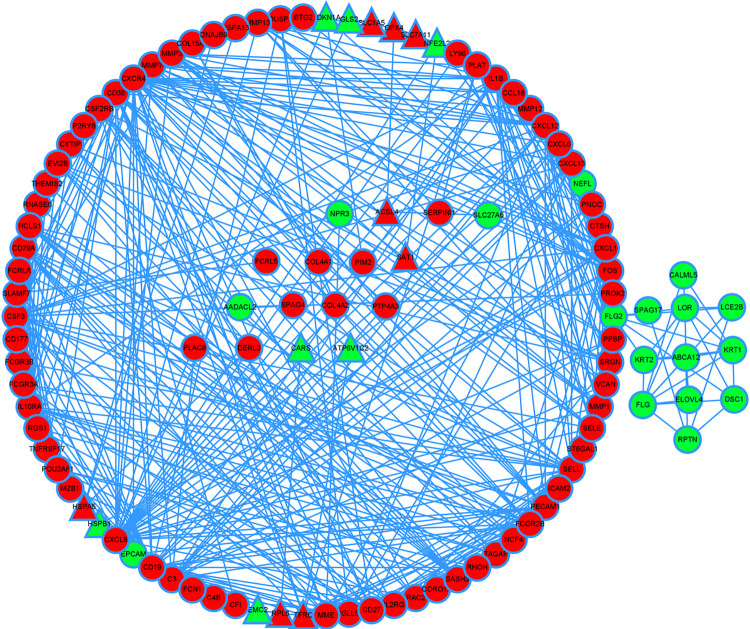
We used the Cytoscape and STRING databases to determin the greatest degree of network connection. The top ten hub genes identified were CXCL8, CXCR4, IL1B, CD19, SELL, CXCL1, CXCL12, CSF3, PECAM1, FCGR2B. And theTOP3 hub nodes connected to FRGs were CXCL8, FOS, ATP5G3. These genes were mainly linked to the negative regulation of IRE1-mediated unfolded protein response, regulation of type IIa hypersensitivity, regulation of apoptotic cell clearance, CXCR chemokine receptor binding, IgG binding, structural constituent of epidermis (Fig 8).
Fig 8. Significantly upregulated genes are marked in red and downregulated genes are marked in green.
The hub nodes connected to FRGs are represented by triangles.
ROC analysis
Corresponding AUCs for FRGs were obtained, the diagnostic efficacy detected as “medium” level including ACSL4 (AUC = 0.713), EMC2 (AUC = 0.757), HSPA5 (AUC = 0.717), NCOA4 (AUC = 0.727), NFE2L2 (AUC = 0.795), RPL8 (AUC = 0.751), SAT1 (AUC = 0.843), SLC1A5 (AUC = 0.827), and SLC7A11 (AUC = 0.809) (Fig 9).
Fig 9.
A: The ROC curves of ACSL4, CISD1, EMC2, FANCD2, FDFT1 and GPX4. B: The ROC curves of HSPA5, HSPB1, NCOA4, NFE2L2, RPL8 and SAT1. C: The ROC curves of SLC1A5, SLC7A11 and TFRC.
qRT-PCR experiment
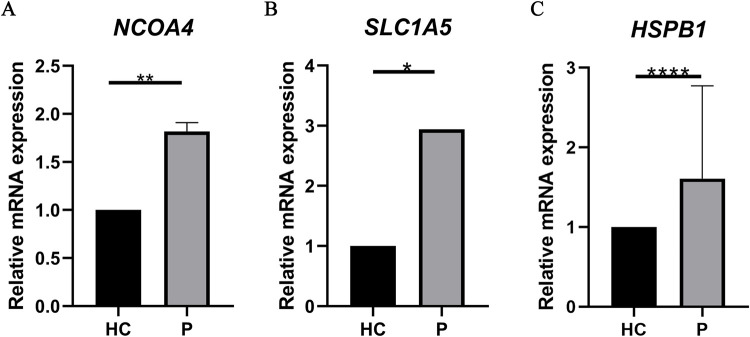
To further confirm the bioinformatics analysis results, 6 normal gingival samples and 6 diseased samples were collected. Fig 10 shows the expression levels of NCOA4, SLC1A5 and HSPB1 were significantly changed between normal gingival samples and diseased samples (p < 0.05).
Fig 10. The expression levels of the three FRGs between healthy control group (n = 6) and periodontitis group (n = 6).
All of the data are presented as means ± SD (p< 0.05).
Discussion
Currently, various factors, including smoking, alcohol, metabolic syndrome, and obesity, were deemed to be the contributing factors of periodontitis [23]. However, understanding of the pathogenesis of the disease is still limited. Based on the RNA-seq, Davanian H confirmed that the elevated levels of locally produced cytokines in the periodontium [24]. A recent study including molecular biology experiments showed that NCOA4, one of the FRGs, is related to the occurrence and development of periodontitis, indicating that iron homeostasis plays an important role in the pathogenesis of periodontitis [20]. Ferroptosis triggers excess intracellular ROS and promotes lipid peroxidation, which is critical for inflammation. This study aimed to identify FRGs associated with periodontitis using bioinformatics analysis and may provide a deeper understanding of the link between ferroptosis and periodontitis. Also, this study has a potential value for the diagnosis, prognosis, and treatment of periodontitis. We analyzed two mRNA microarray datasets, obtained differentially expressed genes (DEGs), and screened FRGs from affected and unaffected group. A total of 128 DEGs and 18 screened FRGs were identified between the two datasets. Then, the DEGs and screened FRGs were subjected to GO and KEGG pathway analysis. PPI analysis of DEG and FRG was performed to enhance our understanding of the molecular mechanisms between periodontitis and ferroptosis, revealing a strong association between FRG and DEG at the protein level. To confirm the validity of these results, we conducted polymerase chain reaction (PCR) analysis for molecular biological verification at the gene level and ROC analysis to further understand the relationship between FRG and DEG.
We analyzed the pathway and functional enrichment of screened FRGs between the two groups as well as the results including glutathione biosynthetic. Some studies confirm that glutathione levels in patients with periodontitis are higher than those in healthy individuals, which is related to oxidative stress [25]. ROS regulates NF-κB responses, and one of the major signaling pathways that intersect with NF-κB in terms of ROS and cell death is the crosstalk that occurs between NF-κB and JNK [26]. According to various studies, glutathioneization regulates the activity of many transcription factors (TFs) through the binding of glutathione to the DNA-binding domain, which contains the TF NF-κB. Moreover, NF-κB plays an important role in the activation of pro-inflammatory responses [27,28].
The GO analysis results revealed that the upregulated DEGs were enriched in the humoral immune response, response to molecule of bacterial origin, and extracellular structure organization, whereas the downregulated DEGs were enriched in epidermis development, skin development, and keratinocyte differentiation. More and more evidence shows that cells dying by ferroptosis secrete factors that activate the immune system as expressed in the vivo pathological and genetic models of ferroptosis [29]. This can cause a periodontal immune response and reduce gingival development, clarifying the clinical manifestations of periodontitis. The KEGG pathway analysis indicated that the regulated DEGs were mainly enriched in chemokine signaling pathway [30,31]. In addition, we established a DEG and screened FRG PPI network, the hub genes include chemokines such as CXCL8, CXCR4, CXCL1 and CXCL12. And theTOP3 hub nodes connected to screened FRG were CXCL8, FOS, ATP5G3. Some studies have shown that chemokines are small proteins that secreted by cells that influence the immune system. CXCL8 (interleukin-8) is a cytokine in the chemokine family [32] and an activator of neutrophils in inflammatory areas, which is released by gingival fibroblasts [33]. The final regulation of CXCL8 gene expression depends on the ratio of CEBPB to NF-κB [34]. CEBPB is an important TF regulating the expression of immune and inflammatory response-related genes. Interestingly, CEBPB is one of the TF targets of FRGs in our study. We believe that CEBPB also plays an important role in periodontitis-related immune responses [35–37]. Meanwhile, researchers have found that ATF2 is related to the occurrence of aggressive periodontitis [29]. These results suggest that TF targets and their signaling pathway genes are drivers of periodontitis progression. We also found that the analysis results of the downregulated genes include NCOA4, which is important in periodontitis. An article pointed out that periodontitis is mostly correlated with NCOA4-mediated ferritinophagy in intracellular iron level regulation [20], p38/hypoxia inducible factor-1α pathway activation, and bromodomain-containing protein 4 and cyclin-dependent kinase 9 transcription modulation mediated butyrate-triggered NCOA4 expression in periodontal ligament fibroblasts [19]. Conversely, NCOA4 over-expression increased sensitivity to ferroptosis [38]. It is fascinating that our biological experiments have proved that NCOA4 is increased, and it also reminds us that transcriptomic datasets have certain drawbacks [39]. The difference in results is also because periodontitis is a disease affected by multiple factors [40]. We still need to further study the relationship between ferroptosis and periodontitis in the future. Through the comprehensive analysis of bioinformatic results, we speculated that ferroptosis promoted the occurrence and development of periodontitis through oxidative stress ROS and NF-κB related pathways.
The bioinformatic analysis of this study was based on published data and quantitative reverse-transcription PCR analysis with a relatively small number of samples to explore the relationship between FRGs and periodontitis. Further studies on the prediction and validation of periodontitis treatment targets including more samples and more forms of molecular biology validation are required.
Conclusion
In summary, the present study determined the effect of ferroptosis in periodontitis. Ferroptosis provides new insights for understanding and preventing periodontitis. Better understanding of ferroptosis in periodontitis may aid in the diagnosis and treatment of periodontitis. Due to the limitations of bioinformatics itself, the findings of this study still need future experiments for further verification and research.
Supporting information
(TIF)
(XLSX)
(DOCX)
(BMP)
Data Availability
All relevant data are within the paper and its Supporting Information files and NCBI GEO database. (GSE16134, GSE10334, and GPL570.)
Funding Statement
YES BZ YL HJ National Natural Science Foundation of China (Grant Nos. 81801040, 81870736, 81500816, 81570951) and Natural Science Foundation of Heilongjiang Province of China (LH2020H057) http://www.nsfc.gov.cn/ http://www.hljkjt.gov.cn/ they decision to publish.
References
- 1.Slots J. Periodontitis: facts, fallacies and the future. Periodontology 2000. 2017;75(1):7–23. Epub 2017/08/02. doi: 10.1111/prd.12221 . [DOI] [PubMed] [Google Scholar]
- 2.Sczepanik FSC, Grossi ML, Casati M, Goldberg M, Glogauer M, Fine N, et al. Periodontitis is an inflammatory disease of oxidative stress: We should treat it that way. Periodontology 2000. 2020;84(1):45–68. Epub 2020/08/28. doi: 10.1111/prd.12342 . [DOI] [PubMed] [Google Scholar]
- 3.Miricescu D, Totan A, Calenic B, Mocanu B, Didilescu A, Mohora M, et al. Salivary biomarkers: relationship between oxidative stress and alveolar bone loss in chronic periodontitis. Acta odontologica Scandinavica. 2014;72(1):42–7. Epub 2013/07/23. doi: 10.3109/00016357.2013.795659 . [DOI] [PubMed] [Google Scholar]
- 4.Callaway DA, Jiang JX. Reactive oxygen species and oxidative stress in osteoclastogenesis, skeletal aging and bone diseases. Journal of bone and mineral metabolism. 2015;33(4):359–70. Epub 2015/03/26. doi: 10.1007/s00774-015-0656-4 . [DOI] [PubMed] [Google Scholar]
- 5.White PC, Chicca IJ, Cooper PR, Milward MR, Chapple IL. Neutrophil Extracellular Traps in Periodontitis: A Web of Intrigue. Journal of dental research. 2016;95(1):26–34. Epub 2015/10/08. doi: 10.1177/0022034515609097 . [DOI] [PubMed] [Google Scholar]
- 6.Kanzaki H, Wada S, Narimiya T, Yamaguchi Y, Katsumata Y, Itohiya K, et al. Pathways that Regulate ROS Scavenging Enzymes, and Their Role in Defense Against Tissue Destruction in Periodontitis. Frontiers in physiology. 2017;8:351. Epub 2017/06/15. doi: 10.3389/fphys.2017.00351 ; PubMed Central PMCID: PMC5447763. [DOI] [PMC free article] [PubMed] [Google Scholar]
- 7.Liu C, Mo L, Niu Y, Li X, Zhou X, Xu X. The Role of Reactive Oxygen Species and Autophagy in Periodontitis and Their Potential Linkage. Frontiers in physiology. 2017;8:439. Epub 2017/07/12. doi: 10.3389/fphys.2017.00439 ; PubMed Central PMCID: PMC5481360. [DOI] [PMC free article] [PubMed] [Google Scholar]
- 8.Yang WS, Stockwell BR. Ferroptosis: Death by Lipid Peroxidation. Trends in cell biology. 2016;26(3):165–76. Epub 2015/12/15. doi: 10.1016/j.tcb.2015.10.014 ; PubMed Central PMCID: PMC4764384. [DOI] [PMC free article] [PubMed] [Google Scholar]
- 9.Hirschhorn T, Stockwell BR. The development of the concept of ferroptosis. Free radical biology & medicine. 2019;133:130–43. Epub 2018/10/01. doi: 10.1016/j.freeradbiomed.2018.09.043 ; PubMed Central PMCID: PMC6368883. [DOI] [PMC free article] [PubMed] [Google Scholar]
- 10.Tang D, Chen X, Kang R, Kroemer G. Ferroptosis: molecular mechanisms and health implications. Cell research. 2021;31(2):107–25. Epub 2020/12/04. doi: 10.1038/s41422-020-00441-1 . [DOI] [PMC free article] [PubMed] [Google Scholar]
- 11.Chen X, Comish PB, Tang D, Kang R. Characteristics and Biomarkers of Ferroptosis. Frontiers in cell and developmental biology. 2021;9:637162. Epub 2021/02/09. doi: 10.3389/fcell.2021.637162 ; PubMed Central PMCID: PMC7859349. [DOI] [PMC free article] [PubMed] [Google Scholar]
- 12.Bebber CM, Müller F, Prieto Clemente L, Weber J, von Karstedt S. Ferroptosis in Cancer Cell Biology. Cancers. 2020;12(1). Epub 2020/01/16. doi: 10.3390/cancers12010164 ; PubMed Central PMCID: PMC7016816. [DOI] [PMC free article] [PubMed] [Google Scholar]
- 13.Wu JR, Tuo QZ, Lei P. Ferroptosis, a Recent Defined Form of Critical Cell Death in Neurological Disorders. Journal of molecular neuroscience: MN. 2018;66(2):197–206. Epub 2018/08/27. doi: 10.1007/s12031-018-1155-6 . [DOI] [PubMed] [Google Scholar]
- 14.Yan HF, Tuo QZ, Yin QZ, Lei P. The pathological role of ferroptosis in ischemia/reperfusion-related injury. Zoological research. 2020;41(3):220–30. Epub 2020/04/22. doi: 10.24272/j.issn.2095-8137.2020.042 ; PubMed Central PMCID: PMC7231469. [DOI] [PMC free article] [PubMed] [Google Scholar]
- 15.Mao H, Zhao Y, Li H, Lei L. Ferroptosis as an emerging target in inflammatory diseases. Progress in biophysics and molecular biology. 2020;155:20–8. Epub 2020/04/21. doi: 10.1016/j.pbiomolbio.2020.04.001 . [DOI] [PubMed] [Google Scholar]
- 16.Stockwell BR, Friedmann Angeli JP, Bayir H, Bush AI, Conrad M, Dixon SJ, et al. Ferroptosis: A Regulated Cell Death Nexus Linking Metabolism, Redox Biology, and Disease. Cell. 2017;171(2):273–85. Epub 2017/10/07. doi: 10.1016/j.cell.2017.09.021 ; PubMed Central PMCID: PMC5685180. [DOI] [PMC free article] [PubMed] [Google Scholar]
- 17.Liu Z, Zhao Q, Zuo ZX, Yuan SQ, Yu K, Zhang Q, et al. Systematic Analysis of the Aberrances and Functional Implications of Ferroptosis in Cancer. iScience. 2020;23(7):101302. Epub 2020/07/07. doi: 10.1016/j.isci.2020.101302 ; PubMed Central PMCID: PMC7334617. [DOI] [PMC free article] [PubMed] [Google Scholar]
- 18.Wang Y, Andrukhov O, Rausch-Fan X. Oxidative Stress and Antioxidant System in Periodontitis. Frontiers in physiology. 2017;8:910. Epub 2017/11/29. doi: 10.3389/fphys.2017.00910 ; PubMed Central PMCID: PMC5693842. [DOI] [PMC free article] [PubMed] [Google Scholar]
- 19.Zhao Y, Li J, Guo W, Li H, Lei L. Periodontitis-level butyrate-induced ferroptosis in periodontal ligament fibroblasts by activation of ferritinophagy. Cell death discovery. 2020;6(1):119. Epub 2020/12/11. doi: 10.1038/s41420-020-00356-1 ; PubMed Central PMCID: PMC7655826. [DOI] [PMC free article] [PubMed] [Google Scholar]
- 20.Guo W, Zhao Y, Li H, Lei L. NCOA4-mediated ferritinophagy promoted inflammatory responses in periodontitis. Journal of periodontal research. 2021. Epub 2021/02/04. doi: 10.1111/jre.12852 [DOI] [PubMed] [Google Scholar]
- 21.Xie C, Mao X, Huang J, Ding Y, Wu J, Dong S, et al. KOBAS 2.0: a web server for annotation and identification of enriched pathways and diseases. Nucleic acids research. 2011;39(Web Server issue):W316–22. Epub 2011/07/26. doi: 10.1093/nar/gkr483 ; PubMed Central PMCID: PMC3125809. [DOI] [PMC free article] [PubMed] [Google Scholar]
- 22.Keenan AB, Torre D, Lachmann A, Leong AK, Wojciechowicz ML, Utti V, et al. ChEA3: transcription factor enrichment analysis by orthogonal omics integration. Nucleic acids research. 2019;47(W1):W212–w24. Epub 2019/05/23. doi: 10.1093/nar/gkz446 ; PubMed Central PMCID: PMC6602523. [DOI] [PMC free article] [PubMed] [Google Scholar]
- 23.Genco RJ, Borgnakke WS. Risk factors for periodontal disease. Periodontology 2000. 2013;62(1):59–94. Epub 2013/04/12. doi: 10.1111/j.1600-0757.2012.00457.x . [DOI] [PubMed] [Google Scholar]
- 24.Davanian H, Stranneheim H, Båge T, Lagervall M, Jansson L, Lundeberg J, et al. Gene expression profiles in paired gingival biopsies from periodontitis-affected and healthy tissues revealed by massively parallel sequencing. PloS one. 2012;7(9):e46440. Epub 2012/10/03. doi: 10.1371/journal.pone.0046440 ; PubMed Central PMCID: PMC3460903. [DOI] [PMC free article] [PubMed] [Google Scholar]
- 25.Kluknavská J, Krajčíková K, Bolerázska B, Mašlanková J, Ohlasová J, Timková S, et al. Possible prognostic biomarkers of periodontitis in saliva. Eur Rev Med Pharmacol Sci. 2021;25(8):3154–61. Epub 2021/05/01. doi: 10.26355/eurrev_202104_25724 . [DOI] [PubMed] [Google Scholar]
- 26.Morgan MJ, Liu ZG. Crosstalk of reactive oxygen species and NF-κB signaling. Cell Res. 2011;21(1):103–15. Epub 2010/12/29. doi: 10.1038/cr.2010.178 ; PubMed Central PMCID: PMC3193400. [DOI] [PMC free article] [PubMed] [Google Scholar]
- 27.Klatt P, Molina EP, De Lacoba MG, Padilla CA, Martinez-Galesteo E, Barcena JA, et al. Redox regulation of c-Jun DNA binding by reversible S-glutathiolation. FASEB journal: official publication of the Federation of American Societies for Experimental Biology. 1999;13(12):1481–90. Epub 1999/08/27. doi: 10.1096/fasebj.13.12.1481 . [DOI] [PubMed] [Google Scholar]
- 28.Qanungo S, Starke DW, Pai HV, Mieyal JJ, Nieminen AL. Glutathione supplementation potentiates hypoxic apoptosis by S-glutathionylation of p65-NFkappaB. The Journal of biological chemistry. 2007;282(25):18427–36. Epub 2007/05/01. doi: 10.1074/jbc.M610934200 . [DOI] [PubMed] [Google Scholar]
- 29.Proneth B, Conrad M. Ferroptosis and necroinflammation, a yet poorly explored link. Cell death and differentiation. 2019;26(1):14–24. Epub 2018/08/08. doi: 10.1038/s41418-018-0173-9 ; PubMed Central PMCID: PMC6294786. [DOI] [PMC free article] [PubMed] [Google Scholar]
- 30.Azizidoost S, Asnafi AA, Saki N. Signaling-chemokine axis network in brain as a sanctuary site for metastasis. Journal of cellular physiology. 2019;234(4):3376–82. Epub 2018/09/07. doi: 10.1002/jcp.27305 . [DOI] [PubMed] [Google Scholar]
- 31.Ruytinx P, Proost P, Van Damme J, Struyf S. Chemokine-Induced Macrophage Polarization in Inflammatory Conditions. Frontiers in immunology. 2018;9:1930. Epub 2018/09/25. doi: 10.3389/fimmu.2018.01930 ; PubMed Central PMCID: PMC6137099. [DOI] [PMC free article] [PubMed] [Google Scholar]
- 32.Metzemaekers M, Vandendriessche S, Berghmans N, Gouwy M, Proost P. Truncation of CXCL8 to CXCL8(9–77) enhances actin polymerization and in vivo migration of neutrophils. Journal of leukocyte biology. 2020;107(6):1167–73. Epub 2020/04/10. doi: 10.1002/JLB.3AB0220-470R . [DOI] [PubMed] [Google Scholar]
- 33.Aleksandrowicz P, Brzezińska-Błaszczyk E, Kozłowska E, Żelechowska P, Borgonovo AE, Agier J. Analysis of IL-1β, CXCL8, and TNF-α levels in the crevicular fluid of patients with periodontitis or healthy implants. BMC Oral Health. 2021;21(1):120. Epub 2021/03/18. doi: 10.1186/s12903-021-01478-3 ; PubMed Central PMCID: PMC7968186. [DOI] [PMC free article] [PubMed] [Google Scholar]
- 34.Stein B, Baldwin AS Jr., Distinct mechanisms for regulation of the interleukin-8 gene involve synergism and cooperativity between C/EBP and NF-kappa B. Mol Cell Biol. 1993;13(11):7191–8. Epub 1993/11/01. doi: 10.1128/mcb.13.11.7191-7198.1993 PubMed Central PMCID: PMC364780. [DOI] [PMC free article] [PubMed] [Google Scholar]
- 35.Kinoshita S, Akira S, Kishimoto T. A member of the C/EBP family, NF-IL6 beta, forms a heterodimer and transcriptionally synergizes with NF-IL6. Proc Natl Acad Sci U S A. 1992;89(4):1473–6. Epub 1992/02/15. doi: 10.1073/pnas.89.4.1473 PubMed Central PMCID: PMC48473. [DOI] [PMC free article] [PubMed] [Google Scholar]
- 36.Pless O, Kowenz-Leutz E, Knoblich M, Lausen J, Beyermann M, Walsh MJ, et al. G9a-mediated lysine methylation alters the function of CCAAT/enhancer-binding protein-beta. J Biol Chem. 2008;283(39):26357–63. Epub 2008/07/24. doi: 10.1074/jbc.M802132200 ; PubMed Central PMCID: PMC3258912. [DOI] [PMC free article] [PubMed] [Google Scholar]
- 37.Roy SK, Hu J, Meng Q, Xia Y, Shapiro PS, Reddy SP, et al. MEKK1 plays a critical role in activating the transcription factor C/EBP-beta-dependent gene expression in response to IFN-gamma. Proc Natl Acad Sci U S A. 2002;99(12):7945–50. Epub 2002/06/06. doi: 10.1073/pnas.122075799 ; PubMed Central PMCID: PMC123000. [DOI] [PMC free article] [PubMed] [Google Scholar]
- 38.Hou W, Xie Y, Song X, Sun X, Lotze MT, Zeh HJ, 3rd, et al. Autophagy promotes ferroptosis by degradation of ferritin. Autophagy. 2016;12(8):1425–8. Epub 2016/06/02. doi: 10.1080/15548627.2016.1187366 ; PubMed Central PMCID: PMC4968231. [DOI] [PMC free article] [PubMed] [Google Scholar]
- 39.Goodwin S, McPherson JD, McCombie WR. Coming of age: ten years of next-generation sequencing technologies. Nature reviews Genetics. 2016;17(6):333–51. Epub 2016/05/18. doi: 10.1038/nrg.2016.49 . [DOI] [PMC free article] [PubMed] [Google Scholar]
- 40.Goodman SC, Letra A, Dorn S, Araujo-Pires AC, Vieira AE, Chaves de Souza L, et al. Expression of heat shock proteins in periapical granulomas. Journal of endodontics. 2014;40(6):830–6. Epub 2014/05/28. doi: 10.1016/j.joen.2013.10.021 . [DOI] [PubMed] [Google Scholar]
Associated Data
This section collects any data citations, data availability statements, or supplementary materials included in this article.
Supplementary Materials
(TIF)
(XLSX)
(DOCX)
(BMP)
Data Availability Statement
All relevant data are within the paper and its Supporting Information files and NCBI GEO database. (GSE16134, GSE10334, and GPL570.)


