Abstract
The present study aimed to examine the influence of leg dominance on the change of direction (COD) performance. In this study participated 94 healthy young highly trained male soccer players belonging from two categories (n = 27 vs. n = 67; 14.81 ± 0.40 vs. 16.64 ± 1.25 years of age; 170.61 ± 5.61 vs. 173.73 ± 7.19 cm of height; 64.74 ± 8.44 vs. 66.70 ± 7.95 kg of weight, for U16 and U18, respectively). Fitness assessments were performed two times in a period of three months, and included: (1) anthropometry measures, (2) 30–15 IFT, (3) 10-m sprint test, (4) 505-COD test, 90° COD test and cross-over hop test. A paired sample t-test was performed to evaluate the asymmetries at the intragroup level in each of the COD’s tests. A symmetry index was used to analyse the asymmetries between categories, and an independent sample t-test was used to compare the variability between the two categories in each of the three tests performed. The effect size was also evaluated. Analysis demonstrated that evidence a trend for a better performance with the preferred leg in the cross-over hop and 505-COD tests, and with the non-dominant leg in the 90° COD. However, in the intragroup analysis, only the 505-COD test registered differences, and no differences were notice din the intergroup comparison. Only in the 505-COD test the percentage of variability (CV) was statistically significant (7.03 ± 4.18% vs. 4.03 ± 2.02% from U16 and U18, respectively). In sum, bilateral differences were noticed in the intragroup comparison, although only in 505-COD test the leg dominance showed to influence performance. In the intergroup analysis any difference was noticed between age categories.
Subject terms: Physiology, Medical research, Engineering
Introduction
Change-of-direction (COD) ability assumes an importance role in invasion team sports, during both training and competition, as it is one of the most determinants of success in the final outcomes of this type of sport competition1. In fact, among the linear sprinting actions, which is considered the most physical capacity performed in goal situations, soccer players can reach up to approximately 700 COD actions at different angles and intensities throughout a single soccer match that can also influence the final outcome of a match, especially in set pieces2.
Invasion team sport athletes produce high-intensity actions mainly through unilateral lower-limbs movement patterns3. Also, the majority of players have a preferred limb (i.e., dominant leg)4. Indeed, team sport athletes seem to use their dominant leg to perform the majority of technical actions, such as ball control, passing, shooting, crossing, and even to perform COD tasks5. Given that, it is expected a higher volume of actions executed with the dominant leg than with the non-dominant leg, which induces some levels of lower limb asymmetries in terms of strength6. Although these lower limb strength asymmetries seem to decrease player’s technical and physical performance, there is still incongruences in the available literature regarding their cause-effect7,8.
There are several COD tests available to be conducted on athletes during periodic assessment during the season9,10. In practice, coaches and practitioners during a testing battery usually conducts one COD test that they feel that is better suited to their soccer teams10. In this sense, it is imperative to investigate the influence of leg dominance during different COD tests. Each of the available COD tests has their own characteristics. For example, the cross-over hop test (CHT) involves a jumping action from side-to-side from a static position, while the 505-COD test and de 90° COD tests involves running, in which both acceleration and linear sprint are present. Also, the 505-COD test involves only one COD, while the 90° COD test involves three CODs.
Furthermore, in 505 and 90° COD tests, the time to complete the test is used as the final outcome. However, the presence of acceleration and linear sprint in such tests can produce bias in the final outcomes. That is, players with greater acceleration and linear sprint capacity can outperform their slower counterparts and still, be worse at changing direction9. For those reasons, it seems prudent to consider other tests that does not have the influence of neither acceleration nor linear sprint, to assess lower limb asymmetries during COD tasks, and to analyze their differences. Moreover, in a study conducted on 73 youth soccer players, it was found that in performing a sidestepping COD test with the dominant leg was significantly better than with the non-dominant one. While, during other COD test with different angles, the dominant leg was better only during a 135° COD13. In fact, leg differences can produce different outcomes obtained from COD tests, which is also associated with functionality and non-functionally symmetries occurring in athletes14–16.
Beyond all the above-mentioned, players form different age categories can also perform differently during COD tasks and during different COD tests, as older players usually generate greater force levels in acceleration and sprint phases17. On the other side, the motor awkwardness of maturing players can be detrimental during COD tasks18. However, there are few studies analysing lower limb asymmetry during different COD tests in youth soccer players. A recent study conducted on 68 youth soccer players, found greater lower limb asymmetries during the 90° COD test for U-16 than the U-15, U-17 and U-18 age categories. Therefore, the aim of the present study was to examine the influence of leg dominance on the change of direction performance.
Methods
Experimental approach to the study
Participants completed 3 testing sessions, 7 days apart. During each session, we collected data from a cross-over hop test, 505 and the 90° COD test. Participants were familiar with all the tests as they were part of their regular fitness testing battery. Both testing sessions were completed at the same time of the day and during participants’ regular training times and always before training. This study was conducted in May of 2020/2021 season and consisted in a weekly resistance training session on day-4 (Wednesday), allowing a rest of 72 h prior to match and within the usual training hours (15:30–18:00 h). The assessments were carried under weather conditions (29 °C and 50% humidity). The type of grass was synthetic and of the 3rd generation basically characterized by being composed of the following elements: a support fabric and fibers woven to the support with a height between 35 and 70 mm and with a distance between them that allows the incorporation of a filling.
Participants
A total of 94 young highly trained male soccer players from high-performance academy were part of the present study. The soccer players were assigned into two categories: under 16 (U16) [(n = 27); age: 14.81 ± 0.40 years; height: 170.61 ± 5.61 cm; weight 64.74 ± 8.44 kg)] or under 19 (U18) [(n = 67); age: 16.64 ± 1.25 years; height: 173.73 ± 7.19 cm; weight 66.70 ± 7.95 kg)]. All participants were familiar with the evaluations carried out and they had experience in the different test carried out. These players trained 9 h of soccer training and played one competitive match per week.
Each soccer players and respective parents were informed about the objective of present study and giving the signed consent before the beginning of the study. The inclusion criteria were as follows: (1) being an active player with federation license with previous experience of ≥ 5 years (2) not presenting any injuries during the previous two month; (3) belong in the academy a full season; (4) participating in 3 tests proposed (100%) and (5) giving consent.
The participants were treated according to American Psychological Association (APA) guidelines, which ensured the anonymity of participants’ responses. In addition, the study was conducted in accordance with the ethical principles of Helsinki declaration16 for human research and was approved by the Research Ethics Committee of the Pontifical University of Comillas (internal project n°: 2021/65).
Procedure
Prior to conducting any tests, participants conducted a standardized warm up consisting of low aerobic activity, dynamic stretching, progressive sprinting, and submaximal pre-planned changes of direction, lasting 10 min. Following the standardized warm up, participants received verbal instruction and demonstrations from the research team immediately prior to conducting 2 familiarization attempts for each test. Recovery intervals between attempts were standardized at three minutes for each test. For the selection of the dominant leg, the players were asked which leg they preferably use to control, pass and throw the ball regardless of playing position20. All the evaluations (see Fig. 1) were performed at the same time and space, with the usual clothing for the soccer player, the specific footwear and supervised by the same technical specialists.
Figure 1.
Schematic representation of a test day (see text for full description).
Measures
Cross-over hop test
For the cross-over hop test (CHT), the participant performed three consecutive jumps over a 15 cm line that had been marked on the floor. The test consists of doing three jumps starting from a monopodal support and landing with the same leg as the impulse21. Subjects were instructed to place their hands on their hips and to maintain the landing position for 3 s (sec), without loss of balance or performing additional movements involving the free limb. The distance reached was measured in centimeters from the take-off line to the heel in the final position21. They made two attempts and the best was selected. See Fig. 2.
Figure 2.
Set up for the cross-over hop test.
505 COD test
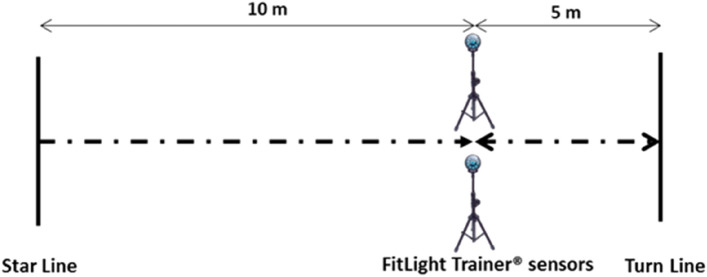
The methodology for the 505-COD test was as per originally established methods22, see Fig. 3. Therefore, this involved a 10 m linear sprint from a static start, a 180° turn using the right or left leg to stop the run (ensuring contact with a designated line), and a 5 m return sprint through an identified finish line. The time taken to complete the final 5 m of the 10-m linear sprint, turn, and 5 m return sprint was recorded20. For speed evaluation, 2 attempts were performed with a recovery time of 2 min between repetitions and an average of the two repetitions for subsequent analysis24,25. Times were measured in sec. The evaluation system was carried out through FitLight Trainer® sensors (Ontario, Canada). This system is used to calculate agility, reaction time, speed and coordination in football26. The optoelectronic devices were adjusted to an appropriate hip height as per the mean stature of the sample group. The recorded time for each of the players was stored in a portable tablet with an Android system and its subsequent analysis in the Microsoft Windows® Excel program (Redmond, Washington, USA).
Figure 3.
Set up for the 505 COD test.
90° COD test
Finally, they performed three 90° COD test (right/left) (10 m) with 90° (COD). See Fig. 4. The times of each repetition were taken in seconds. For data analysis, the average of the two attempts made in each series with 2 min of recovery among them was chosen24,25. For the evaluation, 2 Led FitLight Trainer® sensors were placed, one at the beginning and the other at the end of the route. Timing gates were adjusted to an appropriate hip height as per the mean stature of the sample group.
Figure 4.
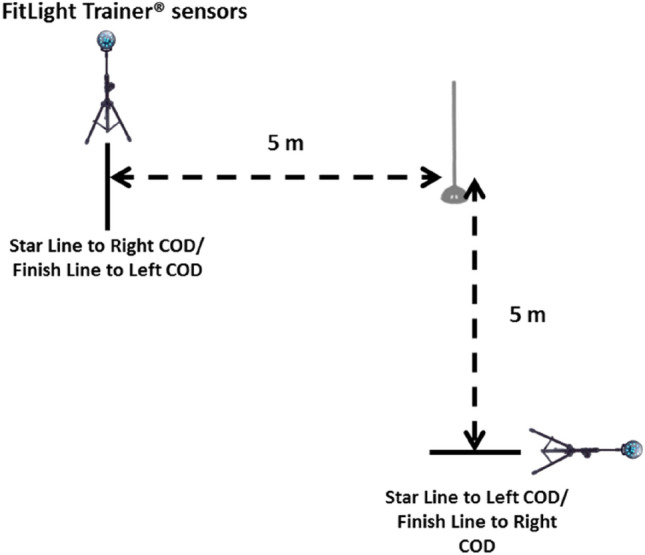
Set up for the 90° COD test.
Statistical analysis
Data were analyzed using software IBM SPSS Statistics (version 26). For data processing, mean and standard deviation were used. The variability of the results in each test [(percentage of variability (CV)] was also computed having into account the totality of the test performed per subject for each test (two to the dominant side and two to the non-dominant side). To evaluate the asymmetries at the intragroup level in each of the COD’s tests, a t-test of paired samples was performed, comparing the time of the test depending on different criteria (to facilitate the understanding of the results).
In the test CHT the criterion was the leg used to perform the jumps (dominant or non-dominant).
In the test 505 COD test the criterion was the legs that performs the last support before changing direction (dominant or non-dominant).
In the 90° COD test the criteria was the turning direction (dominant or non-dominant).
To study the asymmetries between U16 and U18 in the CHT, the symmetry index (SI) in percentage was calculated27 using different formulas, based on the mentioned criteria’s: the formula (1) was used for the cross-over hop test (SI-CHT), the formula (2) was used for the 505 COD test (SI-505) and formula (3) was used for the 90° COD test (SI-90). Then a t-test between U16 and U18 players was performed for independent samples using the symmetry index as the dependent variable
| 1 |
where Hd is the time of the COD test performing the hop with the dominant leg and Hnd the time performing the hop with the non-dominant leg
| 2 |
where Sd is the time of the COD test performing the stop with the dominant leg and Snd the time of the COD test performing the stop with the non-dominant leg
| 3 |
where Td is the time of the COD test performing the turn toward the dominant side and Tnd the time of the COD test performing the turn towards the non-dominant side.
Finally, an independent sample t-test was used to compare the variability (CV [%]) between the two age categories in each of the three tests performed. Significant p value was established at 0.01. The effect size was evaluated using the Cohen scale28: (1) 0–0.20, negligible effect; (2) 0.20–0.50, small effect; (3) 0.50–0.80, medium effect; (4) 0.80–1, large effect.
Ethics approval and consent to participate
Players and their parents or guardian were then invited to sign an informed consent document before any of the tests were performed. The study has conducted according to the Declaration of Helsinki, and the study was conducted in accordance with the ethical principles of the 1964 Helsinki declaration for human research and was approved by the Research Ethics Committee of the Pontifical University of Comillas (2021/65).
Consent for publication
Authors have a formal written consent of each participant, in order to publish data after the manuscript may be accepted.
Results
Descriptive data showed a predominance of players who performed better jumping with the preferred leg in the case of the CHT or stopping with the dominant leg in the case of the 505 COD test (See Table 1, for more information). In the case of the CHT the numbers of players who obtained a better result jumping with the dominant leg was 61 versus 43 who performed better jumping with the non-dominant leg. In the 505 COD test the number of players who performed better stopping the sprint with the dominant leg was of 64 versus 30 who performed better stopping with the non-dominant leg. In the 90° COD test, 39 players turned faster towards the dominant side and 54 towards the non-dominant side.
Table 1.
Descriptive values of the symmetry index by COD test and by best hopping leg (cross-over hop test), best braking leg during cutting (505 COD test) or best turning direction (90° COD test).
| Test | Best leg/direction | Group | N of players | SI (%) | SI SD (%) | SI p25th (%) |
|---|---|---|---|---|---|---|
| Cross-over hop test | Best hopping leg (D) | U16 | 15 | 6.6 | 5.2 | 10.1 |
| U18 | 36 | 5.6 | 4.1 | 8.9 | ||
| All | 51 | 5.9 | 4.4 | 9.1 | ||
| Best hopping leg (ND) | U16 | 12 | 5.9 | 4.3 | 9.7 | |
| U18 | 31 | 5.3 | 4.5 | 6.8 | ||
| All | 43 | 5.5 | 4.4 | 2.4 | ||
| 505 COD test | Best braking leg (D) | U16 | 17 | 7.8 | 7.7 | 11.2 |
| U18 | 47 | 4.2 | 2.7 | 5.5 | ||
| All | 64 | 5.2 | 4.8 | 6.4 | ||
| Best braking leg (ND) | U16 | 10 | 4.6 | 3.7 | 6.7 | |
| U18 | 20 | 4.1 | 2.7 | 6.3 | ||
| All | 30 | 4.3 | 3.0 | 1.8 | ||
| 90° COD test | Best turning direction (D) | U16 | 8 | 5.7 | 4.2 | 8.9 |
| U18 | 31 | 4.6 | 3.7 | 5.8 | ||
| All | 39 | 4.8 | 3.8 | 6.3 | ||
| Best turning direction (ND) | U16 | 19 | 6.7 | 4.6 | 12 | |
| U18 | 35 | 4.3 | 4.2 | 6.8 | ||
| All | 54 | 5.2 | 4.5 | 1.6 |
D dominant, ND non-dominant.
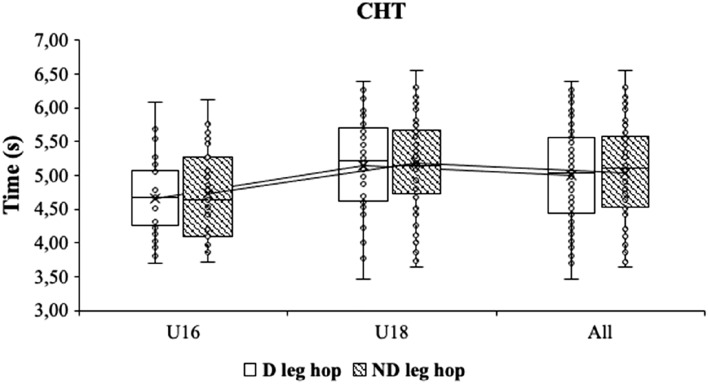
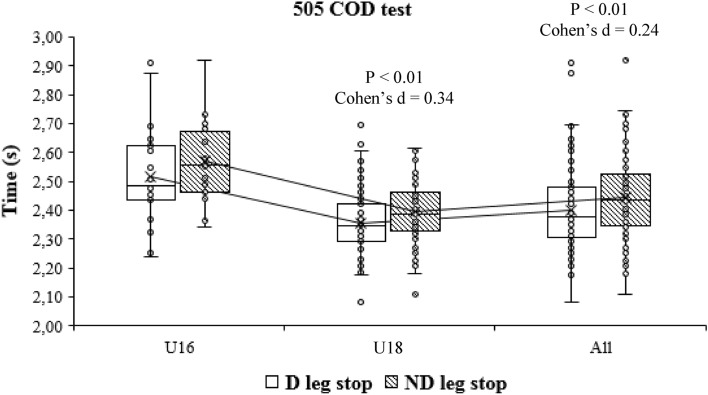
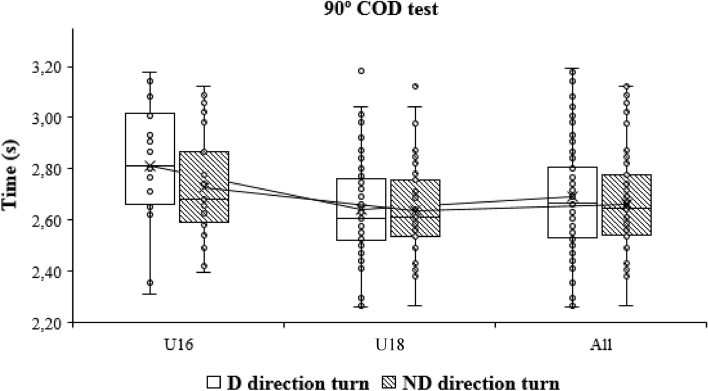
When the time of the performance of the COD test was compared at the intragroup level depending on the dominance, differences were only obtained in the case of the 505 COD test, with the players being faster when they stop with the dominant leg (2.39 ± 0.17 s vs. 2.44 ± 0.14 s; p < 0.01) (Fig. 5) when they stop with the dominant leg, when the full sample was analysed and in the case of the U18 players. The effect size in this case was small (Cohen’s d = 0.35). Posteriorly, intragroup comparisons of the 505 COD test. D: Dominant; ND: non-dominant (Fig. 6). In addition, intragroup comparisons of the 90° COD test. CHT. D: Dominant; ND: non-dominant (Fig. 7).
Figure 5.
Intragroup comparisons of the change of direction text. CHT cross-over hop test, D dominant, ND non-dominant.
Figure 6.
Intragroup comparisons of the 505 COD test. D dominant, ND non-dominant.
Figure 7.
Intragroup comparisons of the 90° COD test. CHT. D dominant, ND non-dominant.
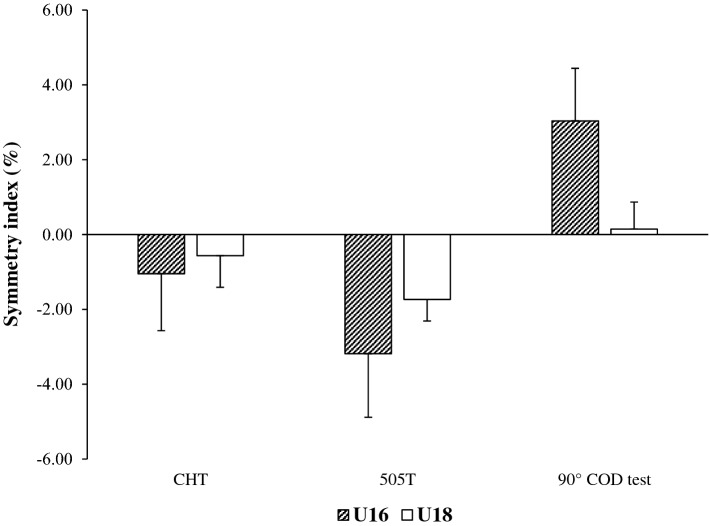
In the case of intergroup comparisons, although the U16 had higher values of asymmetries than the juveniles in the three COD tests, there were no significant differences in any of the cases analysed (Fig. 8).
Figure 8.
Intergroups comparisons of the symmetry index by age category in the change of direction tests. CHT cross-over hop test, 505 COD test and 90° COD test.
Relatively to the variability values of the test performed, the CV was of 7.07 ± 3% (U16) and 5.99 ± 3.49% (U18) in the CHT, of 7.03 ± 4.18% (U16) and 4.03 ± 2.02% (U18) in the test 505 COD test and of 5.7 ± 3.33% (U16) and 4.82 ± 2.25% (U18) in the 90° COD test. There were statistically significant differences only in the case of the 505 COD test between the two age categories, the effect size being large (p < 0.001; Cohen’s d = 1.07).
Discussion
The results of the intragroup comparisons showed bilateral differences in each test. A greater number of subjects performed the test better by jumping with the dominant leg in the case of the cross-over hop test or braking with the dominant leg in the case of the 505 COD test. In the case of the 90° COD test, a greater number of subjects performed better when they turned in the direction of the non-dominant leg. Despite this, only in the case of the 505 COD test these differences were significant. Intergroup comparisons did not show significant differences between groups U16 and U18, in any of the three tests evaluated.
Being asymmetric in human activities is part of biology since sports performance and sports training conducts to an overuse of a specific leg for performing specific actions29. Thus, asymmetry is somehow part of human biology with some benefits if functional30. This functionality is highly individual since for some players a huge asymmetry can be a support for better performance, while for another one may be detrimental31,32. In our study was found that 59% of the best results come from dominant leg, while 68% of the best results in 505 COD test was obtained in the dominant leg. This confirms an evidence that COD is typically performed in a faster way using dominant leg13. In the opposite way, only 42% of the best results in 90° COD test was observed in the dominant leg.
The results of the current research revealed that in an intra-group analysis, in particular U18 group, performing COD in 505 COD test with dominant leg (in case the preferred leg) helped players to be significantly faster while using the leg for braking. These findings are in line with previous research conduct in soccer players33,34. This can be partially explained by different strength levels occurring in preferred and non-preferred legs regarding knee flexors/extensors and hip abductors/adductors13. As example, in braking hip joint will play a determinant role while knee extensors and flexors may help to eccentrically decelerate the downward motion of the bod’s centre of mass to stabilize the knee joint and also provide a support for the propulsion phase13. Thus, considering that strength levels can be different between legs (in some cases greater than 14%)35, it can be expectable observe a consequence in COD performance between legs as well.
Regarding between-age group analysis, only significant differences were found in 505 COD test (best results in older). Since COD time in 505 COD test is predominantly explained by acceleration36 and considering that greater force and sprint are observed in latest stage of youth period37, it is expectable to observe the results observed in this test. This also highlight that besides typical field-based training, physical qualities related with COD tests must be oriented to improve the skill across the time. Interestingly, the asymmetries were not significant different across age groups, which is not in line with a previous study testing different age groups asymmetries COD tests performed in soccer34. However, in such a study34, COD deficit was considered and not properly the COD time which means a significant difference in the type of outcomes. The COD time express a great dependency of acceleration, thus smaller variations in COD ability, while COD deficit is a better representation of COD ability with less dependency from sprint.
Practical application
It is well known that asymmetry is a detrimental factor to soccer performance. However, there are some doubts about the practical evidence on soccer and the type of asymmetry because is often not defined. Crucially, the majority of soccer asymmetries are a results of limb dominance and increase with the training and competition. For this reason, testing the existence of asymmetries on soccer, that in the present work are linked with COD test, could be effective in detecting sporting asymmetries. Therefore, professional and multidisciplinary (physical coach, physical therapist and medical staff) training interventions can reduce the different sporting asymmetries and improve the soccer performance. In fact, observe the different sporting asymmetries in different categories could be a decisive strategy in light of ‘development windows’ that can be targeted for attaining more general neuromuscular improvements26.
Conclusions
As a conclusion, we could assume that bilateral differences exist in the whole group of youth soccer athletes, with a greater number of subjects performed the test better by jumping with the dominant leg in the case of the cross-over hop test and in braking with the dominant leg in the case of the 505 COD test. Nevertheless, only in 505 COD test the leg dominance showed to influence performance. When comparing age categories (U16 vs. U18), no difference was noticed in any of the three tests.
Acknowledgements
The authors would like to thank all the coaches and players for their willingness to participate in this study.
Abbreviations
- COD
Changes of direction
- CH
Cross-over hop test
- APA
American Psychological Association
- SI
Symmetry index (SI)
- D
Dominant
- ND
Non-dominant
Author contributions
Conceptualization, F.M.C., F.T.G.F., H.N., and M.F.P. Methodology, M.F.P., F.M.C. and F.T.G.F. Data collection, M.F.P. and F.T.G.F. Analysis, G.G.D. and F.T.G.F. writing—review and editing original draft preparation, H.N., R.S., and A.F.S. All authors have read and agreed to the published version of the manuscript.
Funding
No specific sources of funding were used to assist in the preparation of this article.
Data availability
The datasets generated during and analyzed during the current study are available from F.T.G.F. on reasonable request.
Competing interests
The authors declare no competing interests.
Footnotes
Publisher's note
Springer Nature remains neutral with regard to jurisdictional claims in published maps and institutional affiliations.
References
- 1.Pojskic H, Åslin E, Krolo A, Jukic I, Uljevic O, Spasic M, Sekulic D. Importance of reactive agility and change of direction speed in differentiating performance levels in junior soccer players: Reliability and validity of newly developed soccer-specific tests. Front Physiol. 2018;9:506. doi: 10.3389/fphys.2018.00506. [DOI] [PMC free article] [PubMed] [Google Scholar]
- 2.Nygaard-Falch H, Guldteig-Rædergård H, van den Tillaar R. Effect of different physical training forms on change of direction ability: A systematic review and meta-analysis. Sports Med. Open. 2019;5(1):1–37. doi: 10.1186/s40798-019-0223-y. [DOI] [PMC free article] [PubMed] [Google Scholar]
- 3.Raya-González J, Bishop C, Gómez-Piqueras P, Veiga S, Viejo-Romero D, Navandar A. Strength, jumping, and change of direction speed asymmetries are not associated with athletic performance in elite academy soccer players. Front. Physiol. 2020;11:175. doi: 10.3389/fpsyg.2020.00175. [DOI] [PMC free article] [PubMed] [Google Scholar]
- 4.Chtara M, Rouissi M, Bragazzi NL, Owen AL, Haddad M, Chamari K. Dynamic balance ability in young elite soccer players: Implication of isometric strength. J. Sports Med. Phys. Fitness. 2018;58(4):414–420. doi: 10.23736/S0022-4707.16.06724-4. [DOI] [PubMed] [Google Scholar]
- 5.Madruga-Parera M, Bishop C, Read P, Lake J, Brazier J, Romero-Rodríguez D. Jumping-based asymmetries are negatively associated with jump, change of direction, and repeated sprint performance, but not linear speed, in Adolescent Handball Athletes. J. Hum. Kinet. 2020;71(1):47–58. doi: 10.2478/hukin-2019-0095. [DOI] [PMC free article] [PubMed] [Google Scholar]
- 6.Bishop C, Calum B, Abbott W, Read P, Lake J, Turner A. Jumping asymmetries are associated with speed, change of direction speed, and jump performance in elite academy soccer players. Strength Cond J. 2021;35(7):1841–1847. doi: 10.1519/JSC.0000000000003058. [DOI] [PubMed] [Google Scholar]
- 7.Bishop C, Turner A, Read P. Effects of inter-limb asymmetries on physical and sports performance: A systematic review. J. Sports Sci. 2018;36(10):1135–1144. doi: 10.1080/02640414.2017.1361894. [DOI] [PubMed] [Google Scholar]
- 8.Falces-Prieto M, Baena-Morales S, Benítez-Jiménez A, Revilla-Gil R, Muñoz-Muñoz A, Salinas-Palacios V, Betanzos-López R, Adalid-Leiva JJ, González-Fernández FT. Y-balance-test in soccer players according to the level of competition. Retos. 2020;37:333–338. [Google Scholar]
- 9.Nimphius S, Callaghan SJ, Bezodis NE, Lockie RG. Change of direction and agility tests: Challenging our current measures of performance. Strength Cond J. 2018;40(1):26–38. doi: 10.1519/SSC.0000000000000309. [DOI] [Google Scholar]
- 10.Turner A, Walker S, Stembridge M, Coneyworth P, Reed G, Birdsey L, Moody J. A testing battery for the assessment of fitness in soccer players. Strength Cond. J. 2011;33(5):29–39. doi: 10.1519/SSC.0b013e31822fc80a. [DOI] [Google Scholar]
- 11.Delaney JA, Scott TJ, Ballard DA, Duthie GM, Hickmans JA, Lockie RG, Dascombe BJ. Contributing factors to change-of-direction ability in professional rugby league players. J. Strength Cond. Res. 2015;29(10):2688–2696. doi: 10.1519/JSC.0000000000000960. [DOI] [PubMed] [Google Scholar]
- 12.Reid A, Birmingham TB, Stratford PW, Alcock GK, Giffin JR. Hop testing provides a reliable and valid outcome measure during rehabilitation after anterior cruciate ligament reconstruction. Phys. Ther. 2007;87(3):337–349. doi: 10.2522/ptj.20060143. [DOI] [PubMed] [Google Scholar]
- 13.Rouissi M, Chtara M, Berriri A, Owen A, Chamari K. Asymmetry of the modified Illinois change of direction test impacts young elite soccer players’ performance. Asian J. Sports Med. 2016;7(2):e33598. doi: 10.5812/asjsm.33598. [DOI] [PMC free article] [PubMed] [Google Scholar]
- 14.Sannicandro I, Piccinno A, Rosa RA, De Pascalis S. Correlation between functional asymmetry of professional soccer players and sprint. Br. J. Sport Med. 2011;45:370–371. [Google Scholar]
- 15.Sannicandro I, Quarto A, Piccinno A, Cofano G, Rosa RA. Lower limb functional asymmetries in young soccer players: Do differences exist between different age groups? Br. J. Sports Med. 2014;48:657–657. [Google Scholar]
- 16.Mesfar A, Hammami R, Selmi W, Gaied-Chortane S, Duncan M, Bowman TG, Nobari H, van den Tillaar R. Effects of 8-week in-season contrast strength training program on measures of athletic performance and lower-limb asymmetry in male youth volleyball players. Int. J. Environ. Res. Public Health. 2022;19(11):6547. doi: 10.3390/ijerph19116547. [DOI] [PMC free article] [PubMed] [Google Scholar]
- 17.Darrall-Jones JD, Jones B, Till K. Anthropometric and physical profiles of English academy rugby union players. J Strength Cond Res. 2015;29(8):2086–2096. doi: 10.1519/JSC.0000000000000872. [DOI] [PubMed] [Google Scholar]
- 18.John C, Rahlf AL, Hamacher D, Zech A. Influence of biological maturity on static and dynamic postural control among male youth soccer players. Gait Posture. 2019;68:18–22. doi: 10.1016/j.gaitpost.2018.10.036. [DOI] [PubMed] [Google Scholar]
- 19.World Medical Association. World Medical Association Declaration of Helsinki Ethical principles for medical research involving human subjects. Bull. World Health Org. 2001;79(4):373. [PMC free article] [PubMed] [Google Scholar]
- 20.Carey D, Smith G, Smith D, Shepeherd J, Skriver J, Ord L, Rutland A. Footedness in world soccer: An analysis of France´98. J. Sports Sci. 2001;19:855–864. doi: 10.1080/026404101753113804. [DOI] [PubMed] [Google Scholar]
- 21.Arboix-Alió J, Aguilera-Castells J, Rey-Abella F, Buscá B, Fort-Vanm eer haeg h A. Lower limb neuromuscular asymmetry in roller hochey players. Rev. Int. Cienc. Deporte. 2018;54(14):358–373. doi: 10.5232/ricyde2018.05406. [DOI] [Google Scholar]
- 22.Draper JA, Lancaster MG. The 505 test: A test for agility in the horizontal plane. Aust. J. Sci. Med. Sport. 1985;17(1):15–18. [Google Scholar]
- 23.Dugdale JH, Sanders D, Hunter AM. Reliability of change of direction and agility assessments in youth soccer players. Sports. 2020;8(4):51. doi: 10.3390/sports8040051. [DOI] [PMC free article] [PubMed] [Google Scholar]
- 24.Barbieri RA, Zagatto AM, Milioni F, Barbieri FA. Specific futsal training program can improve the physical performance of futsal players. Sport Sci. Health. 2016;12(2):247–253. doi: 10.1007/s11332-016-0283-z. [DOI] [Google Scholar]
- 25.Hohmann A, Siener M. Talent identification in youth soccer: Prognosis of U17 soccer performance on the basis of general athleticism and talent promotion interventions in second-grade children. Front. Sports Act. Living. 2021;3:625645. doi: 10.3389/fspor.2021.625645. [DOI] [PMC free article] [PubMed] [Google Scholar]
- 26.Rauter S, Coh M, Vodicar J, Zvan M, Krizaj J, Simenko J, Szmajda L, Mackala K. Analysis of reactive agility and change of direction speed between soccer players and physical education students. Hum. Mov. 2018;19(2):68–74. doi: 10.5114/hm.2018.74061. [DOI] [Google Scholar]
- 27.Björklund G, Alricsson M, Svantesson U. Using bilateral functional and anthropometric tests to define symmetry in cross-country skiers. J. Hum. Kinet. 2017;60:9–18. doi: 10.1515/hukin-2017-0107. [DOI] [PMC free article] [PubMed] [Google Scholar]
- 28.Cohen J. Statistical Power Analysis for the behavioral sciences. 2. Psychology Press; 1988. [Google Scholar]
- 29.Pardos-Mainer E, Bishop C, Gonzalo-Skok O, Nobari H, Pérez-Gómez J, Lozano D. Associations between inter-limb asymmetries in jump and change of direction speed tests and physical performance in adolescent female soccer players. Int. J. Environ. Res. Public Health. 2021;18(7):3474. doi: 10.3390/ijerph18073474. [DOI] [PMC free article] [PubMed] [Google Scholar]
- 30.Afonso J, Bessa C, Pinto F, Ribeiro D, Moura B, Rocha T, Clemente FM. Asymmetry as a foundational and functional requirement. Hum. Mov. 2020 doi: 10.1007/978-981-15-2549-0. [DOI] [Google Scholar]
- 31.Davids K, Araújo D. The concept of ‘Organismic Asymmetry’ in sport science. J. Sci. Med. Sport. 2010;13(6):633–640. doi: 10.1016/j.jsams.2010.05.002. [DOI] [PubMed] [Google Scholar]
- 32.Rouissi M, Chtara M, Owen A, Chaalali A, Chaouachi A, Gabbett T, Chamari K. Effect of leg dominance on change of direction ability amongst young elite soccer players. J. Sports Sci. 2016;34(6):542–548. doi: 10.1080/02640414.2015.1129432. [DOI] [PubMed] [Google Scholar]
- 33.Rouissi M, Chtara M, Owen A, Chaalali A, Chaouachi A, Gabbett T, Chamri K. “Side-stepping maneuver”: Not the more efficient technique to change direction amongst young elite soccer players. Int. J. Perform Anal. Sport. 2015;15(2):749–763. doi: 10.1080/24748668.2015.11868827. [DOI] [Google Scholar]
- 34.Trecroci A, Rossi A, DosSantos T, Formenti D, Cavaggioni L, Longo S, Alberti G. Change of direction asymmetry across different age categories in youth soccer. Peer J. 2020;8:e9486. doi: 10.7717/peerj.9486. [DOI] [PMC free article] [PubMed] [Google Scholar]
- 35.Thorborg K, Couppe C, Petersen J, Magnusson SP, Holmich P. Eccentric hip adduction and abduction strength in elite soccer players and matched controls: A cross-sectional study. Br. J. Sports Med. 2011;45(1):10–13. doi: 10.1136/bjsm.2009.061762. [DOI] [PubMed] [Google Scholar]
- 36.Nimphius S, Callaghan SJ, Spiteri T, Lockie RG. Change of direction deficit: A more isolated measure of change of direction performance than total 505 time. J. Strength Cond. Res. 2016;30(11):3024–3032. doi: 10.1519/JSC.0000000000001421. [DOI] [PubMed] [Google Scholar]
- 37.Dellal A, Wong DP. Repeated sprint and change-of-direction abilities in soccer players. J. Strength Cond. Res. 2013;27(9):2504–2508. doi: 10.1519/JSC.0b013e31827f540c. [DOI] [PubMed] [Google Scholar]
Associated Data
This section collects any data citations, data availability statements, or supplementary materials included in this article.
Data Availability Statement
The datasets generated during and analyzed during the current study are available from F.T.G.F. on reasonable request.


