

Abstract
Drosophila bipectinata species complex includes four monophyletic closely related sympatric species with perfect reproductive isolation in natural conditions. Among these, two species, i.e., D. bipectinata and D. malerkotliana are known to be more prevalent in their occurrence all along their distribution area of Oriental–Australian regions. Genetic characteristics of these two species have been studied by earlier researchers mainly by focusing on their chromosomal polymorphism to gain knowledge pertaining to their evolutionary trend. The present work is one step farther, as we considered isozyme variants of three polymorphic enzymes to envisage genetic differentiation among the different natural populations of these two species, along with, a comparative perusal of their certain population genetic parameters. Natural populations of these two species were sampled from eight places aligned on the north–south axis of India and were subjected to isozyme analysis. The collection of both species and the geographical locations were kept same to avoid the effect of temporal or seasonal factors on the distribution of their allelic frequency. The results of this study clearly indicate that there is intraspecific genetic structuring among the populations of both the species with a distinct steady increase in the level of heterozygosity from north to south. The evolutionary tree in the form of dendrogram depicts two genetically differentiated groups of natural populations, one for north and other for South India. Most essential aspect that has been noticed through this study is the evolutionary trend of these two sympatric species being largely similar all along the north–south axis of India.
Keywords: Protein polymorphism, Genetic differentiation, Intra- and interspecific comparison, D. bipectinata, D. malerkotliana
Introduction
D. bipectinata species complex comprises four morphologically very similar species; D. bipectinata, D. parabipectinata, D. malerkotliana and D. pseudoananassae which have been shown to have a common ancestry (Bock 1971; Bock and Wheeler 1972; Matsuda et al. 2005, 2009; Tomimura et al. 2005; Banerjee and Singh 2017; Singh and Singh 2020, 2021). The phylogenetic relationships among these species have been ascertained by using morphological, chromosomal and nucleotide affinities (Bock 1971; Bock and Wheeler 1972; Matsuda et al. 2005, 2009; Tomimura et al. 2005; Banerjee and Singh 2017; Singh and Singh 2021). It was Bock and his coworkers (Bock 1971; Bock and Wheeler 1972) who through their studies on their morphological and chromosomal analysis brought the attention of Drosophila geneticist to scrutinize this species complex so that intricacies of evolutionary trend can be studied among the members of this species complex. Since then, these four species have been the research subject for a number of researchers, especially to observe their genetical, behavioral and phylogenetic characteristics (Matsuda et al. 2005, 2009; Tomimura et al. 2005; Banerjee and Singh 2012; Singh and Singh 2020, 2021). These four species have a very close phylogenetic relationship and it is postulated that they have diverged about 2,83,000–3,85,000 years ago (Kopp and Barmina 2005).
The patterns and amounts of genetic variations in different species of Drosophila have been of extreme interest for investigators in the area of population and evolutionary genetics (Barker et al. 1986; Bubliy et al. 1999; Hoffmann et al. 2005; Singh 2013; Singh and Banerjee 2016; Lewald et al. 2021; Petermann et al. 2021). Genetic polymorphism is reflected at every level in population, like at the phenotypic, chromosomal, protein and DNA level. These polymorphisms are results of several evolutionary and ecological factors, for example, selection, migration, genetic drift, genetic recombination, hybridization, gene duplication etc. (Kumar and Singh 2016, 2017). Moreover, early studies on Drosophila have also suggested that genetic variation in natural populations is plentiful and widespread. Population genetical studies help us to understand the genetic structuring and level of genetic differentiations among the populations of a species (Yue et al. 2021). Phylogenetic relationship among the different populations of a species can be estimated through the studies on genetic polymorphisms that may give idea about the genetic distance among them. Almost all forms of organisms have been analyzed to record genetic variation in them by selecting specific genetic markers. D. bipectinata and D. malerkotliana have been utilized comparatively more for their genetical, behavioral, and evolutionary analysis only because they have a wide distribution in the Indian subcontinent (Kopp and Barmina 2005; Ng et al. 2008; Singh and Singh 2021).
Protein polymorphism is one of the ways to observe genetic variations among the individuals of a species (Pecsenye and Saura 2002; Morton et al. 2004; Andersen et al. 2008; Singh 2013). This practice of population analysis was much popular between 1966 and 2000 and helped population geneticists to examine a number of species of animals including Drosophila (Harris 1966; Ayala et al.1974; Barker et al. 1986; Bubliy et al. 1999; Kliman et al. 2000; Faleh et al. 2009). Nearly 50 different species of genus Drosophila have been utilized to survey their genetic profile based on allozyme analysis (Ayala et al. 1974; Voelkar et al. 1980; Oakeshott et al. 1982; Inoue et al. 1984; Morton et al. 2004; Arthur et al. 2008; Faleh et al. 2009; Kumar et al. 2019). Sporadic studies on the enzyme polymorphism have also been done on the natural populations of the four species of bipectinata species complex (Hegde and Krishnamurthy 1976; Sharma et al. 1993; Prakash 1977, Singh et al. 2017). Based on the allozyme analysis in the four members of D. bipectinata species complex, Yang (1972) estimated evolutionary relationship among them.
In this article, the population genetical study on D. bipectinata and D. malerkotliana has been presented. These two species are found distributed side by side as co-occur in the Oriental–Australian regions. Earlier workers have done some population genetical work on their chromosomal polymorphism and very little work on allozyme variations (Yang 1972; Sharma et al. 1993; Ometto et al. 2005; Singh and Singh 2018, 2020, 2021). Previously, we analyzed these two species (D. bipectinata, and D. malerkotliana) for their genetic structuring at the chromosomal level and found them to be genetically diversified in the Indian subcontinent (Singh and Singh 2020, 2021). In the present work, enzyme polymorphism has been investigated in two phylogenetically related sympatric species: D. bipectinata and D. malerkotliana to observe genetic differentiation in their natural populations. Besides this, an interspecific comparison on the trend of their genetic differentiation has also been studied.
Materials and methods
Flies were sampled from eight geographical localities of India (Table1). Since females of these two species are morphologically indistinguishable, they were individually placed in food vials to get their next generation progeny. Naturally inseminated females were able to produce progeny and therefore, the species identification of the respective female was accomplished by the male’s morphology because males of the two species differ in their abdominal tinge pattern and sex comb structure (Banerjee and Singh 2012). Thus, D. bipectinata flies could be procured from seven places (two from North India and five from South India) whereas, D. malerkotliana from six places (two from North India and four from South India).
Table 1.
Geographical localities, their latitudinal position and time of collection of D. bipectinata (A) and D. malerkotliana (B) flies
| Population | Latitude (°N) | Time of collection | |
|---|---|---|---|
| Kanyakumari (KKR) | 8.9 | JAN 2017 | A |
| Nagercoil (NGC) | 8.18 | JAN 2017 | A&B |
| Thiruvananthapuram (TVM) | 8.52 | JAN 2017 | A&B |
| Rameshwaram (RMM) | 9.28 | JAN 2017 | A&B |
| Madurai (MDR) | 9.52 | JAN 2017 | A&B |
| Varanasi (VNS) | 25.32 | AUG 2016 | A&B |
| Lucknow (LKO) | 26.85 | AUG 2017 | B |
| Moradabad (MDB) | 28.83 | AUG 2016 | A |
Protein polymorphism was done by considering three enzymes, i.e., Aldehyde oxidase (Ao), Esterase (Est) and Xanthine dehydrogenase (Xdh). These three enzymes were observed to be expressed by a total of seven gene loci (3 for Ao, 2 for Xdh and 2 for Est), each being represented by two distinct variants. The specificity of these enzymes is as follows:
Aldehyde oxidase (Ao): Aldehyde oxidase enzyme was observed in all the seven populations of D. bipectinata and six populations of D. malerkotliana. It had three polymorphic loci Ao1, Ao2 and Ao3, each having two variants (fast and slow) represented as Ao1–Ao11.00, Ao11.20; Ao2–Ao21.00, Ao21.20 and Ao3–Ao30.98 and Ao3.1.20. Enzyme-specific staining solution was prepared for Aldehyde oxidase. Gel was incubated in the solution of 100 ml Tris (pH 8.6) containing 20 mg NAD, 20 mg NBT, 5 mg PMS and 2–4 drops of substrate, i.e., Benzaldehyde and incubated in the dark condition at 37 °C for approximately 2 h. (Harris 1966; Lewontin and Hubby 1966; Kumar and Singh 2019)
Esterase: This enzyme was found to be represented by two distinct loci, i.e., Est1 and Est2 in both the species. In the natural populations of D. bipectinata, Est1 locus had two alleles observed as Est11.00and Est10.98 and two alleles of Est2; Est21.00and Es2t1.20. Exactly similar variants were observed for Est1 and Est2 in different populations of D. malerkotliana. For the detection of electrophoretic variants, gel was treated in 0.5 M boric acid (50 ml) for 30 min and washed with distilled water for 2 times. Enzyme-specific solution of 100 ml 0.1 M phosphate buffer (pH 6.8) was prepared containing 2 ml 2-Naphthyle acetate (1:1; Acetone:water) and 20 mg fast blue RR salt. Thereafter, gel was incubated in the dark condition at 37 °C for 2 h (Harris 1966; Lewontin and Hubby 1966; Kumar and Singh 2019).
Xanthine dehydrogenase: An analysis of allozyme polymorphism in natural populations of both the species revealed that Xanthine dehydrogenase enzyme has two well-marked polymorphic loci, i.e., Xdh1 and Xdh2. Locus Xdh1 had two variants (slow and fast), i.e., Xdh11.00 and Xdh11.20, other locus Xdh2 was also observed to be expressed in two allelic forms, Xdh21.00 and Xdh20.98. The gel was incubated in enzyme-specific solution of 100 ml 0.05 M Tris (pH 8.8) containing 20 mg NAD, 20 mg NBT, 5 mg PMS and 100 mg hypoxanthine. Gel was kept in the solution at 37 °C for 2–3 h in the dark condition (Harris 1966; Lewontin and Hubby 1966; Kumar and Singh 2019).
Gel electrophoresis
Poly-acrylamide gel electrophoresis (PAGE) was done to observe electrophoretic variants in the natural populations of the two species. Poly-acrylamide gel was prepared by using 8% resolving and 5% stacking gels. Tris–glycine buffer system of the pH 8.2 was used to counter the pH change occurring at both negative and positive ends of the apparatus due to electric power applied across the gel. Single fly from each isofemale line of a population was used for the allozyme analysis. The total number of individuals observed for allozyme analysis from different locations for both the species is presented in Table 4. Whole fly was homogenized in 50 μl of 20 mM Tris buffer called as sample buffer (pH 7.4). Homogenate was centrifuged at 12,000 rpm at 4 °C for 10 min. Supernatant was separated and then 10 µl of gel loading dye was added (0.1% Bromophenol Blue + 10% glycerol + 20 mM Tris pH 7.4). Equal amount of sample (30 μl) was loaded into every gel slot of polyacrylamide gel and electrophoresis was carried out in 25 mM Tris and 250 mM glycine electrode buffer or Tris–Glycine buffer (pH 8.2) at 100 V for 4 h at 4 °C. After the completion of electrophoresis, staining for a specific enzyme was done. The locus and allele designations were decided by expression of enzyme bands. A single locus was marked by the appearance of its variants separated by some distance, whereas, two loci of a gene were seen to be separated by marked distance.
Table 4.
Estimation of mean heterozygosity (observed and expected) and inbreeding coefficient (F) in natural populations of D. bipectinata (A) and D. malerkotliana (B)
| Populations | N | Ho ± SE | He ± SE | F ± SE | |
|---|---|---|---|---|---|
| MBD | 49 | 0.29 ± 0.030 | 0.45 ± 0.009 | 0.35 ± 0.08 | A |
| – | – – | – – | – – | B | |
| LKO | – | – – | – – | – – | A |
| 45 | 0.26 ± 0.022 | 0.45 ± 0.009 | 0.42 ± 0.010 | B | |
| VNS | 51 | 0.33 ± 0.025 | 0.46 ± 0.007 | 0.29 ± 0.07 | A |
| 40 | 0.32 ± 0.026 | 0.46 ± 0.008 | 0.30 ± 0.07 | B | |
| MDR | 46 | 0.33 ± 0.023 | 0.47 ± 0.007 | 0.29 ± 0.07 | A |
| 42 | 0.32 ± 0.018 | 0.47 ± 0.006 | 0.31 ± 0.08 | B | |
| RMM | 53 | 0.35 ± 0.020 | 0.48 ± 0.005 | 0.27 ± 0.06 | A |
| 38 | 0.32 ± 0.017 | 0.48 ± 0.004 | 0.33 ± 0.08 | B | |
| TVM | 50 | 0.37 ± 0.018 | 0.49 ± 0.004 | 0.24 ± 0.06 | A |
| 42 | 0.35 ± 0.012 | 0.48 ± 0.004 | 0.27 ± 0.07 | B | |
| NGC | 47 | 0.39 ± 0.016 | 0.49 ± 0.003 | 0.18 ± 0.05 | A |
| 56 | 0.36 ± 0.013 | 0.49 ± 0.003 | 0.26 ± 0.07 | B | |
| KKR | 65 | 0.40 ± 0.016 | 0.49 ± 0.003 | 0.20 ± 0.05 | A |
| – | – – | – – | – – | B | |
| Mean | 0.35 ± 0.021 | 0.48 ± 0.005 | 0.26 ± 0.06 | A | |
| 0.32 ± 0.018 | 0.47 ± 0.006 | 0.32 ± 0.08 | B | ||
Population genetical parameters and statistical analysis
Data obtained regarding the different genotypes for all the seven loci were used to compute the allelic frequencies of respective gene locus following Hardy–Weinberg equilibrium and based on this equilibrium, the expected frequencies of different genotypes were also calculated for all the populations of both the species. Chi-square (χ2) analyses were performed to see the difference between observed and expected numbers of different genotypes to test whether the concerned population is in H–W equilibrium. Arithmetic mean ± SE values were calculated to find out the mean heterozygosity in the natural populations of both the species. Genetic identity (I) between the paired populations was calculated by using GenAlEx 6.5 (Peakall and Smouse 2012) which is based on Nei’s calculation (1972). Inbreeding coefficient (F) was calculated to measure the extent of inbreeding in a population. This parameter was analyzed for each population of both the species. The formula used for this calculation is He–Ho/He, where, He = expected heterozygosity and Ho = observed heterozygosity. Pearson’s correlation coefficient was computed to observe the interrelationships between geographical distance and heterozygosity and geographical distance and genetic identity. Based on the values of genetic identity (I) of different populations of both the species, dendrograms were constructed by using UPGMA clustering (past-3 software).
Results
The frequency of electrophoretic variants of seven enzyme loci of D. bipectinata and D. malerkotliana is presented in Tables 2 and 3 respectively. A perusal of the data gives idea that the slow alleles of Ao1 and Ao2, Est2 and Xdh1 enzymes are in higher frequency than their respective fast allele. In case of enzyme loci Ao3, Est1 and Xdh2, the frequency of fast allele was found to be higher than slow allele in almost all the natural populations analyzed. Hardy–Weinberg equilibrium test for all these populations of both the species showed that majority of gene loci exist in H–W equilibrium because, out of 49 loci tested, only 14 in D. bipectinata and out of 42 gene loci in D. malerkotliana, only 17 were found to show disequilibrium.
Table 2.
Allelic frequencies and chi-square (χ2) values of 7 different enzyme loci in seven natural populations of D. bipectinata
| Gene locus | Population | |||||||
|---|---|---|---|---|---|---|---|---|
| MBD | VNS | MDR | RMM | TVM | NGC | KKR | ||
| Ao1 | Alleles | |||||||
| 1.00 | 0.70 | 0.69 | 0.66 | 0.63 | 0.61 | 0.58 | 0.59 | |
| 1.20 | 0.30 | 0.31 | 0.34 | 0.37 | 0.39 | 0.42 | 0.41 | |
| χ2 | 3.45 | 1.66 | 3.36 | 2.78 | 2.03 | 2.7 | 1.31 | |
| Ao2 | 1.00 | 0.66 | 0.65 | 0.63 | 0.60 | 0.58 | 0.56 | 0.57 |
| 1.20 | 0.34 | 0.35 | 0.37 | 0.40 | 0.42 | 0.44 | 0.43 | |
| χ2 | 3.82 | 2.64 | 2.95 | 2.36 | 1.6 | 1.59 | 0.79 | |
| Ao3 | 1.00 | 0.57 | 0.59 | 0.54 | 0.54 | 0.52 | 0.52 | 0.52 |
| 0.98 | 0.43 | 0.41 | 0.46 | 0.46 | 0.48 | 0.48 | 0.48 | |
| χ2 | 21.78*** | 18.07*** | 14.52*** | 13.60*** | 9.64** | 9.55** | 6.10* | |
| Est1 | 1.00 | 0.64 | 0.62 | 0.61 | 0.60 | 0.57 | 0.55 | 0.55 |
| 0.98 | 0.36 | 0.38 | 0.39 | 0.40 | 0.43 | 0.45 | 0.45 | |
| χ2 | 2.92 | 2.28 | 1.47 | 3.48 | 2.53 | 1.7 | 0.91 | |
| Est2 | 1.00 | 0.62 | 0.60 | 0.60 | 0.58 | 0.55 | 0.52 | 0.52 |
| 1.20 | 0.38 | 0.40 | 0.40 | 0.42 | 0.45 | 0.48 | 0.48 | |
| χ2 | 3.36 | 7.68* | 2.46 | 1.89 | 1.14 | 2.55 | 1.69 | |
| Xdh1 | 1.00 | 0.67 | 0.65 | 0.64 | 0.62 | 0.60 | 0.56 | 0.56 |
| 1.20 | 0.33 | 0.35 | 0.36 | 0.38 | 0.40 | 0.44 | 0.44 | |
| χ2 | 14.07*** | 5.00* | 6.84** | 6.78** | 5.55* | 5.14* | 3.29 | |
| Xdh2 | 1.00 | 0.67 | 0.66 | 0.66 | 0.64 | 0.62 | 0.57 | 0.59 |
| 0.98 | 0.33 | 0.34 | 0.34 | 0.36 | 0.38 | 0.43 | 0.41 | |
| χ2 | 1.33 | 0.38 | 1.37 | 1.71 | 1.14 | 1.27 | 0.79 | |
*P < 0.05
**P < 0.01
***P < 0.001
Table 3.
Allelic frequencies and chi-square (χ2) values of 7 different enzyme loci in six natural populations of D. malerkotliana
| Gene locus | Population | ||||||
|---|---|---|---|---|---|---|---|
| LKO | MBD | MDR | RMM | TVM | NGC | ||
| Ao1 | Alleles | ||||||
| 1.00 | 0.66 | 0.64 | 0.61 | 0.60 | 0.54 | 0.54 | |
| 0.98 | 0.34 | 0.36 | 0.39 | 0.40 | 0.46 | 0.46 | |
| χ2 | 5.84* | 1.42 | 2.65 | 1.99 | 3.34 | 2.45 | |
| Ao2 | 1.00 | 0.62 | 0.61 | 0.61 | 0.6 | 0.54 | 0.54 |
| 0.98 | 0.38 | 0.39 | 0.39 | 0.4 | 0.46 | 0.46 | |
| χ2 | 17.4* | 11.06* | 8.93* | 8.05* | 7.29* | 6.61* | |
| Ao3 | 1.00 | 0.58 | 0.57 | 0.57 | 0.54 | 0.55 | 0.54 |
| 1.20 | 0.42 | 0.43 | 0.43 | 0.46 | 0.45 | 0.46 | |
| χ2 | 13.34*** | 9.54** | 7.29** | 6.62* | 4.49* | 7.53** | |
| Est1 | 1.00 | 0.66 | 0.64 | 0.61 | 0.58 | 0.55 | 0.54 |
| 0.98 | 0.34 | 0.36 | 0.39 | 0.42 | 0.45 | 0.46 | |
| χ2 | 3.75 | 3.52 | 2.65 | 2.26 | 2.24 | 1.66 | |
| Est2 | 1.00 | 0.72 | 0.70 | 0.67 | 0.64 | 0.63 | 0.60 |
| 1.20 | 0.28 | 0.30 | 0.33 | 0.36 | 0.37 | 0.40 | |
| χ2 | 3.52 | 3.26 | 2.62 | 2.44 | 2.28 | 2.7 | |
| Xdh1 | 1.00 | 0.64 | 0.61 | 0.58 | 0.57 | 0.58 | 0.58 |
| 1.20 | 0.36 | 0.39 | 0.42 | 0.43 | 0.42 | 0.42 | |
| χ2 | 16.85*** | 11.06*** | 8.93** | 6.41* | 2.95 | 3.8 | |
| Xdh2 | 1.00 | 0.66 | 0.63 | 0.61 | 0.59 | 0.60 | 0.54 |
| 0.98 | 0.34 | 0.37 | 0.39 | 0.41 | 0.40 | 0.46 | |
| χ2 | 3.1 | 1.43 | 2.65 | 3.23 | 1.84 | 3.33 | |
*P < 0.05
**P < 0.01
***P < 0.001
The values obtained regarding observed and expected heterozygosity and inbreeding coefficient (F) of these two species are presented in Table 4. Observed heterozygosity (Ho) was found to range from 0.29 to 0.40 in D. bipectinata, whereas it ranged between 0.26 and 0.36 in D. malerkotliana. The inbreeding coefficient was found to be maximum in MBD of D. bipectinata and LKO of D. malerkotliana, which came from the extreme north and showed minimal heterozygosity; however, KKR and NGC being located at extreme south possessed highest heterozygosity and consequently, lower values of F. Thus, there is indication that average Ho values did not exceed average He for none of the populations analyzed, giving clear view that heterozygotes, although persist in the populations, but did not show superiority over homozygotes. Populations of both the species coming in between extreme north to south most places showed an increasing trend in heterozygosity from north to south. Thus, there exists clonal variation in the level of heterozygosity for allozyme variants. Mean heterozygosity observed for all the populations of D. bipectinata and D. malerkotliana was observed to be 0.35–0.32 respectively. In this Table 4, the value of ‘F’ is also depicted. This value denotes the extent of inbreeding in the natural populations of both the species. Since its calculation is based on the Ho and He values, the highest inbreeding has been seen in MBD (0.35) and minimum in NGC (0.18) in D. bipectinata and 0.42 (LKO) to 0.26 (NGC) in D. malerkotliana, giving a clue that South Indian populations are large-sized populations and experience random mating than the North Indian populations.
The Fig. 1A, B show frequency of heterozygotes of Ao, Est and Xdh enzymes in the natural populations of D. bipectinata and D. malerkotliana. There is steady increase in the heterozygosity of Ao from north to south in both the species, although, in D. bipectinata, the extent of heterozygosity remained similar in VNS & MDR. This trend also persists for Est and Xdh, with some exception, like Xdh heterozygosity in VNS was found to be higher than some of the South Indian populations in D. bipectinata (Fig. 1A). Figure 1B presents the frequency of the heterozygotes of the 3 enzymes in the six natural populations of D. malerkotliana. The heterozygotes were found to be minimum in LKO when compared with other populations for all the 3 enzymes. The frequency of Ao heterozygotes increased steadily from LKO to NGC in a series of latitudinal increase; however, this trend was not observed with other two enzymes (Est and Xdh), because the level of heterozygosity in VNS population was recorded higher than MDR and RMM populations for Est and Xdh enzymes. The frequency of heterozygotes for Xdh was found to be quite similar for MDR and RMM and also for TVM and NGC.
Fig. 1.
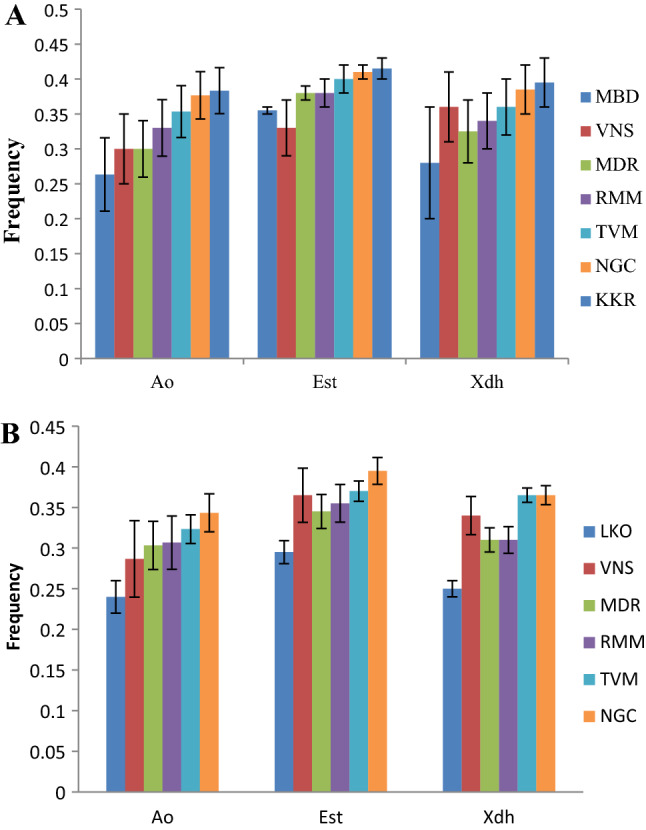
Bar diagrams showing frequency of heterozygotes of Aldehyde oxidase (Ao), Esterase (Est) and Xanthine dehydrogenase (Xdh) enzymes in natural populations of D. bipectinata (A) and D. malerkotliana (B)
The Fig. 2A and B show the graphical presentation of average frequency of observed and expected heterozygosity (Ho and He) and inbreeding coefficient (F) in the natural populations of D. bipectinata and D. malerkotliana. The mean frequency of Ho showed a fair pattern of increase in heterozygosity from north to south in both the species. Figure 3A and B depict the average frequency of observed and expected heterozygotes in the natural populations of these two species by a bar diagram and both the species showing steadily increase in average observed heterozygotes. A graph (Fig. 4A, B) depicting relationships between latitude and average heterozygosity of three major enzyme loci also displays two marked clusters, one for south Indian populations and another for north Indian populations. There exists significant negative correlation (r = − 0.81, p < 0.05 for D. bipetinata and r = − 0.76, p < 0.05 for D. malerkotliana) between these two variables, i.e., latitude and heterozygosity. Heterozygosity was observed to be more at latitude ranging between 8 and 10°N and low at latitude close to 25°N. Since populations have been sampled from two distantly located parts of India, two distinct groups of scattered dots can be observed in this figure. Thus, there is a clear-cut indication that those populations which were sampled from distant geographical localities have undergone more genetic differentiation than populations derived from near places. Since genetic identity (I) of all the paired comparisons was available, an analysis regarding correlation between genetic identity and geographical distance (Km) was also performed (Fig. 5A, B). The results of this analysis indicate two patches of scattered dots, one being formed for those comparisons which show closer distance between them and the other for distantly located places. A distinct negative correlation exists between genetic identity (I) and geographical distance in both the species (r = − 0.503 for D. bipectinata and r = − 0.654 for D. malerkotliana); however, this correlation was found to be statistically insignificant.
Fig. 2.
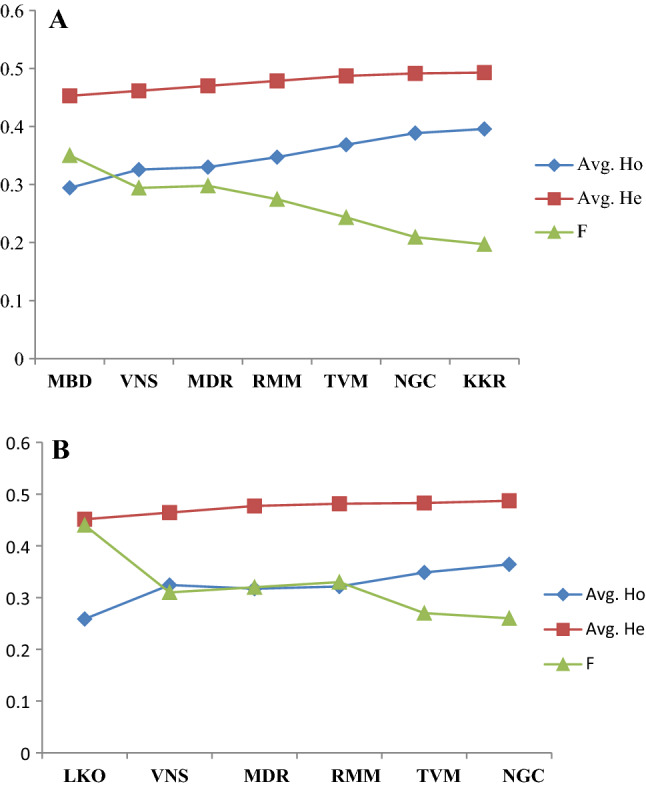
Graphical presentation of average frequency of observed and expected heterozygosity (Ho and He) and inbreeding coefficient (F) of Aldehyde oxidase (Ao), Esterase (Est) and Xanthine dehydrogenase (Xdh) enzymes in natural populations of D. bipectinata (A) and D. malerkotliana (B)
Fig. 3.

Bar diagrams showing average frequencies of observed and expected heterozygotes (Ho and He) in natural populations of D. bipectinata (A) and D. malerkotliana (B)
Fig. 4.

Scattered dots showing two distinct clustering when observed with respect to latitude and average heterozygosity of three enzymes in D. bipectinata (A) and D. malerkotliana (B)
Fig. 5.

Correlation between geographical distance (Km) and genetic identity (I) in natural populations of D. bipectinata (A) and D. malerkotliana (B)
The correlation analysis to see interrelationships between latitude and frequency of less-occurring allele in both the species also showed two distinct patches of scattered dots, one for the south populations, showing higher values and the other for the north populations (Figs. 6 and 7).
Fig. 6.

Scattered dots showing relationships between latitude and frequency of less-occurring alleles of three enzyme (Ao, Est and Xdh) loci in natural populations of D. bipectinata
Fig. 7.
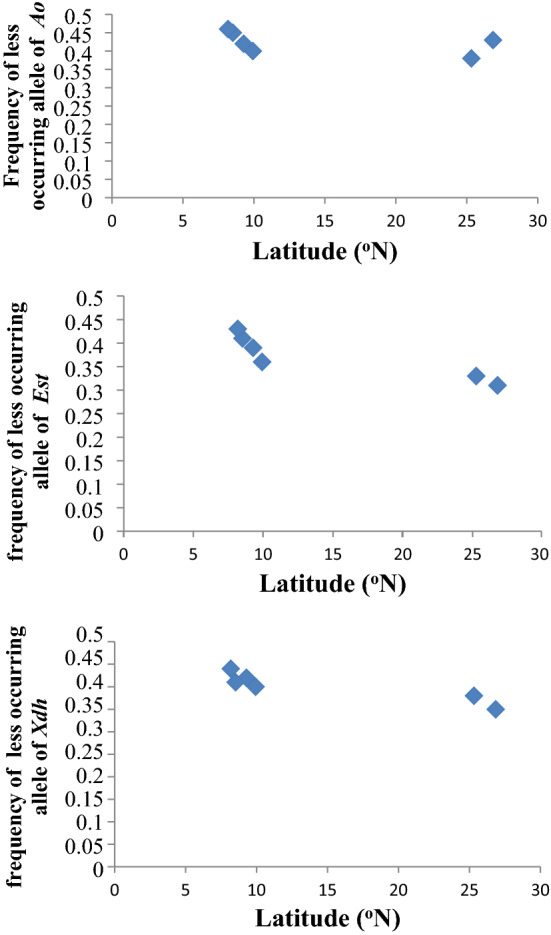
Scattered dots showing relationships between latitude and frequency of less-occurring alleles of three enzyme (Ao, Est and Xdh) loci in natural populations of D. malerkotliana
Based on the frequency of allozyme variants of three enzyme variants, genetic identity (I) between all the possible comparisons was computed in both the species. Since seven populations of D. bipectinata, and six populations of D. malerkotliana, have been analyzed, a total of 21 and 15 such comparisons respectively have been possible (k (k − 1)/2, where k = number of populations). The pairwise comparison of genetic identity (I) among the different populations of D. bipectinata is presented in Fig. 8A. Populations that showed very high values of I were NGC vs. KKR, MDR vs. RMM, TVM vs. KKR, RMM vs. TVM, MBD vs. VNS and TVM vs. NGC. Very low range of I values could be observed between MBD vs. NGC, MBD vs. KKR, VNS vs. NGC and VNS vs. KKR. Figure 8B shows genetic identity (I) between six populations of D. malerkotliana, where maximum genetic similarity has been observed between TVM vs. NGC, MDR vs. RMM and LKO vs. VNS and the value of I was found to be at a lower side for LKO vs. NGC, LKO vs. TVM and VNS vs. NGC.
Fig. 8.

Pairwise comparison of genetic identity (I) in natural populations of D. bipectinata (A) and D. malerkotliana (B)
In this study, values of genetic identity were obtained on the basis of allozyme polymorphism for all the natural populations of both the species and these values have been used to construct UPGMA dendrogram (Fig. 9A and B). In D. bipectinata, the five South Indian populations make a cluster where, NGC and KKR are identical populations. Another cluster included remaining two North Indian populations. Similar analysis for D. malerkotliana also depicted same trend where two distinct groups have been formed for the North Indian populations and the other for four populations which make a major cluster due to more genetic identity among them belong to southern peninsula of India where TVM and NGC are maximally identical.
Fig. 9.
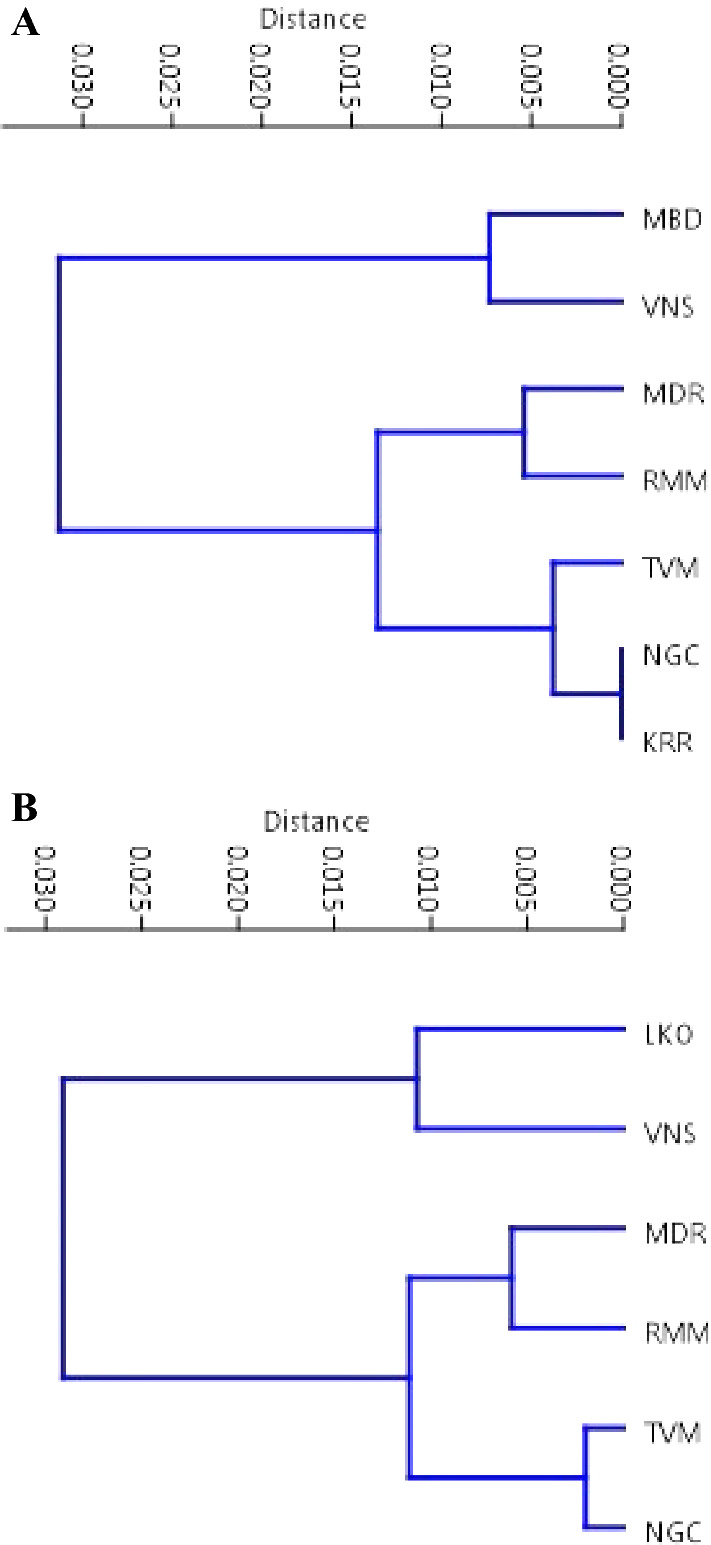
Construction of dendrograms based on UPGMA clustering showing genetic affinities among the natural populations of D. bipectinata (A) and D. malerkotliana (B)
Discussion
A number of polymorphic enzyme systems have been subjected to analyze the protein polymorphism in both natural and cage populations of genus Drosophila. Some of the species subjected to this kind of analysis are D. melanogaster, D. ananassae, D. sechellia, D. subobscura, D. simulans, D. pseudoobscura and D. aldrichi (Morton et al. 2004; Fry et al. 2008; Kumar and Singh 2014, Kumar et al. 2019). Very insufficient reports on the enzyme polymorphisms are available regarding the four species of bipectinata species complex. Hegde and Krishnamurthy (1976) studied isozyme variation in the four species of bipectinata species complex, as well as, in their hybrids by considering three enzymes and suggested that hybrids of D. bipectinata and D. malerkotliana expressed same alleles from one of the parental species. On the other hand, hybrids of D. bipectinata and D. parabipectinata exhibited intermediary alleles as the parental species. On the basis of their study, one can anticipate that D. bipectinata is closer with D. malerkotliana than D. parabipectinata. Electrophoretic studies on alcohol dehydrogenase (ADH) allozyme polymorphism have been investigated by Jha et al. (1979) and they revealed co-dominant inheritance of all the alleles of ADH in the F1 hybrids of D. bipectinata and D. malerkotliana. Taking this study further, Sharma et al. 1993 observed that alcohol dehydrogenase exhibited clinal variations and ethanol tolerance at different latitude in D. bipectinata populations. Earlier researchers who worked on genetic polymorphism of this species complex found that D. bipectinata possesses comparatively higher polymorphism than other members of this complex (Hegde and Krishnamurthy 1976; Sharma et al. 1993).
There is role of selection that results into clinal variation in the expression of certain traits or genotypes, which may ultimately lead to directional selection for the differentiations among the populations of a species. A number of abiotic factors, with convincing impact of temperature strongly affect the physiology of the individuals (Hoffmann et al. 2005). In this study, correlation coefficient was computed with respect to the latitude and less frequent allele and average heterozygosity in both the species and results clearly reveal that there exists clinal variation in the allelic frequency and heterozygosity by changing latitudinal position. The frequency of less-occurring alleles and average heterozygosity was found to decrease with the increasing latitudinal position in both the species of this species complex. Latitudinal cline was also reported for the Adh polymorphism in D. melanogaster by Umina et al. (2005). Moraes and Sene (2007) showed latitudinal cline for allozyme polymorphism in the natural populations of cactophilic species of Drosophila: D. antonietae and D. gouveal and suggested that environmental variations influence allozyme polymorphism in Drosophila.
Based on the allelic frequencies of 7 different enzyme loci, chi-square (χ2) values were computed to see whether the studied populations of both the species occur in Hardy–Weinberg equilibrium for these loci. The results obtained distinctly indicate that most of the enzyme loci occur in Hardy–Weinberg equilibrium. Inbreeding coefficient (F), a parameter that reflects the level of inbreeding in a population can be helpful to envisage whether a population is large enough and experiences random mating or being small experiences inbreeding. This parameter was found to range from 0.18 to 0.35 (with an average value of 0.26) in D. bipectinata and from 0.26 to 0.42 (with an average value of 0.32) in D. malerkotliana. Hence, the observed heterozygotes did not exceed the expected heterozygotes in any of the populations of both the species. However, it can be stated that distribution wise, D. bipectinata populations were larger in number at the respective place than D. malerkotliana.
Genetic identity (I) observed among all the 21 possible pairs of D. bipectinata populations, higher I values was observed between NGR vs. KKR, MDR vs. RMM, TVM vs. KKR and RMM vs. TVM. All these populations belong to southern part of India. Value of I was found to be 1 between NGC vs. KKR indicating total genetic resemblance of both the populations. This is largely due to closeness (distance between the two places is approximately 20 km) of the populations which may lead to contiguity between the two due to gene flow and their exposure to similar ecological niche. The two Northern Indian populations of this species, i.e., VNS and MBD also showed high I value, whereas a comparison between distantly located populations, like MBD vs. NGC, MBD vs. KKR and VNS vs. NGC showed least genetic identity. In D. malerkotliana, pairwise comparisons of genetic identity indicate higher I values between MDR vs. RMM and TVM vs. NGC. Two North Indian populations VNS and MBD were also found to show high I value. Populations that came from distantly located places like LKO vs. NGC showed lowest value of genetic identity (I) indicating that distance is one of the factors that lead to variation in genetic makeup. Results of this study also showed a negative correlation between the value of genetic identity and geographic distances, as the value of I continuously decreased with the increasing geographical distance in the natural populations of both the species. Thus, the pairwise genetic identity (I) values help to support ‘isolation by distance’ effect (Wright 1943).
Interrelationships were also observed between latitudinal position and average heterozygosity which revealed that North and South Indian populations of both the species form distinct clusters, i.e., one for the South Indian populations sampled from lower latitude and the other for North Indian populations of higher latitude. Correlation coefficient (r) between latitude and average heterozygosity of the enzymes in the natural populations of D. bipectinata and D. malerkotliana showed negative correlation between these two variables. Heterozygosity was observed to be more at latitude ranging between 8 and 10°N for South Indian populations and low for the North Indian populations at latitude close to 25°N in both the species. Clinal variation in the frequency of specific enzyme variants supports the role of natural selection of certain genotypes in the populations. Although, populations in the north do not face similar ecological conditions all across the year and undergo population crash during summer (April–July) as well as winter (November–February) due to unfavorable conditions. This situation may lead to random change in the allelic frequencies of enzymes; however, the results reveal dominating impact of selection over drift in the north populations of both the species.
The comparative scrutiny of the allelic frequency of the seven gene loci of the matched populations of both the species has revealed gross level resemblance between these two species. The genetic identity values have been used to observe the level of genetic divergence among the populations of a species. This parameter was measured in both the species of the bipectinata species complex. This analysis shows that the tendency of genetic divergence goes on exhibiting parallel trend in both the species revealing similar evolutionary pathway being adopted by them. The South populations of both species have undergone changes following a pattern that make them accumulating similar genetic shape. Gupta and Panigrahy (1990) have reported that the hybrids of these two species can be obtained in the laboratory conditions when kept in male choice (male of one species with females of both species) or no choice (male of one species with female of other species). These two species have lived sympatrically all along their spread zone abstaining reproductive bonding but undergoing genetic differentiation in the same pattern. Researchers working on the evolutionary relationships among the members of this complex have stipulated their diversification time and a close phylogenetic link between D. bipectinata and D. malerkotliana (Singh and Banerjee 2016; Banerjee and Singh 2017; Tomimura et al. 2005). We through this study can only opine that since there is much resemblance at the level of genetic differentiation between these two species, therefore, they might have diversified as independent species recently.
Measuring the level of the heterozygosity in the different populations of a species is the simplest way to check variability of these populations. The measure of average heterozygosity when compared with the two species of this species complex indicates that D. bipectinata is more polymorphic at its enzyme loci than its sympatric ally D. malerkotliana. This study on enzyme polymorphism has shown higher value of mean heterozygosity of allozymes in both the species of Drosophila than earlier reports on many other species of Drosophila (Barker and Mulley 1976; Mateus et al. 2010; Mateus and Sene 2003; Mateus and Sene 2007). Similar studies have been conducted in D. ananassae utilizing its fifteen natural populations sampled from North and South zones of India and the results have shown a distinct higher frequency of slow alleles and higher heterozygosity in South populations than North (Kumar and Singh 2014, 2017; Kumar et al. 2019).
Acknowledgements
We sincerely thank the anonymous reviewers for their valuable comments and suggestions on the manuscript for its improvement. Authors are also thankful to University Grants Commission and Indian Council of Medical Research (ICMR), New Delhi for providing research fellowship in the form of SRF (2019-4830/GEN-BMS) to GS. We earnestly thank the unspecified persons who met at the flies’ collection sites as a matter of chance and helped in their possible capacity.
Author contributions
GS conducted experiments, collected and analyzed the data. AKS conceived and designed the research. GS drafted the manuscript. AKS revised the final version. Both the authors read and approved the manuscript.
Funding
Indian Council of Medical Research (ICMR), New Delhi is highly acknowledged for providing financial support (Project code- 2019–4830/GEN-BMS).
Declarations
Conflict of interest
The authors declare that they do not have any competing interests.
References
- Andersen DH, Pertoldi C, Loeschcke V, Cavicchi S, Scali V. Divergence at neutral and non-neutral loci in Drosophila buzzatii populations and their hybrids. Evol Ecol. 2008;22(5):593–605. [Google Scholar]
- Arthur A, Weeks A, Sgro CM. Investigating latitudinal clines for life history and stress resistance traits in Drosophila simulans from eastern Australia. J Evol Biol. 2008;21(6):1470–1479. doi: 10.1111/j.1420-9101.2008.01617.x. [DOI] [PubMed] [Google Scholar]
- Ayala FJ, Tracey ML, Barr LG, McDonald JF, Pérez-Salas S. Genetic variation in natural populations of five Drosophila species and the hypothesis of the selective neutrality of protein polymorphisms. Genetics. 1974;77(2):343–384. doi: 10.1093/genetics/77.2.343. [DOI] [PMC free article] [PubMed] [Google Scholar]
- Banerjee P, Singh BN. Interspecific sexual isolation and phylogeny among different members of the Drosophila bipectinata species complex. Genetica. 2012;140(1):75–81. doi: 10.1007/s10709-012-9659-4. [DOI] [PubMed] [Google Scholar]
- Banerjee P, Singh BN. The Drosophila bipectinata species complex: phylogenetic relationship among different members based on chromosomal variations. J Genet. 2017;96(1):97–107. doi: 10.1007/s12041-017-0746-2. [DOI] [PubMed] [Google Scholar]
- Barker J, Mulley J. Isozyme variation in natural populations of Drosophila buzzatii. Evolution. 1976;30:213–233. doi: 10.1111/j.1558-5646.1976.tb00905.x. [DOI] [PubMed] [Google Scholar]
- Barker J, East P, Weir B. Temporal and microgeographic variation in allozyme frequencies in a natural population of Drosophila buzzatii. Genetics. 1986;112(3):577–611. doi: 10.1093/genetics/112.3.577. [DOI] [PMC free article] [PubMed] [Google Scholar]
- Bock I. Taxonomy of the Drosophila bipectinata species complex. Stud Genet. 1971;1971:273. [Google Scholar]
- Bock IR, Wheeler MR. The Drosophila melanogaster species group. Tex Univ Publ. 1972;7213:1–102. [Google Scholar]
- Bubliy OA, Kalabushkin BA, Imasheva AG. Geographic variation of six allozyme loci in Drosophila melanogaster: an analysis of data from different continents. Hereditas. 1999;130(1):25–32. doi: 10.1111/j.1601-5223.1999.00025.x. [DOI] [PubMed] [Google Scholar]
- Faleh AB, Shahin AA, Said K. Allozyme polymorphism and genetic differentiation among populations of Jaculus jaculus and J. orientalis (Rodentia: Dipodidae) in Tunisia. Zool Res. 2009;3:247–254. [Google Scholar]
- Fry JD, Donlon K, Saweikis M. A worldwide polymorphism in aldehyde dehydrogenase in Drosophila melanogaster: evidence for selection mediated by dietary ethanol. Evolution. 2008;62(1):66–75. doi: 10.1111/j.1558-5646.2007.00288.x. [DOI] [PubMed] [Google Scholar]
- Gupta J, Panigrahy K. Chromosomal polymorphism in Indian populations of Drosophila bipectinata Duda. Genetica. 1990;82(1):45–49. doi: 10.1007/BF00057672. [DOI] [PubMed] [Google Scholar]
- Harris H. C. Genetics of Man Enzyme polymorphisms in man. Proc R Soc Lond B Biol Sci. 1966;164(995):298–310. doi: 10.1098/rspb.1966.0032. [DOI] [PubMed] [Google Scholar]
- Hegde S, Krishnamurthy N. Studies on the genetics of isozymes in the hybrids of Drosophila bipectinata complex. Aust J Zool. 1976;27:421–431. [Google Scholar]
- Hoffmann A, Shirriffs J, Scott M. Relative importance of plastic vs genetic factors in adaptive differentiation: geographical variation for stress resistance in Drosophila melanogaster from eastern Australia. Funct Ecol. 2005;19(2):222–227. [Google Scholar]
- Inoue Y, Tobari YN, Tsuno K, Watanabe TK. Association of chromosome and enzyme polymorphisms in natural and cage populations of Drosophila melanogaster. Genetics. 1984;106(2):267–277. doi: 10.1093/genetics/106.2.267. [DOI] [PMC free article] [PubMed] [Google Scholar]
- Jha AP, Mishra DN, Pandey BN. Alcohol dehydrogenase isoenzymes in Drosophila species hybrids. Ind J Exp Biol. 1979;17:647–649. [PubMed] [Google Scholar]
- Kliman RM, Andolfatto P, Coyne JA, Depaulis F, Kreitman M, Berry AJ, McCarter J, Wakeley J, Hey J. The population genetics of the origin and divergence of the Drosophila simulans complex species. Genetics. 2000;156(4):1913–1931. doi: 10.1093/genetics/156.4.1913. [DOI] [PMC free article] [PubMed] [Google Scholar]
- Kopp A, Barmina O. Evolutionary history of the Drosophila bipectinata species complex. Genet Res. 2005;85(1):23–46. doi: 10.1017/s0016672305007317. [DOI] [PubMed] [Google Scholar]
- Krishnamoorti K, Singh AK. Fitness differences due to allelic variation at esterase-4 locus in Drosophila ananassae. J Genet. 2017;96(4):625–631. doi: 10.1007/s12041-017-0814-7. [DOI] [PubMed] [Google Scholar]
- Singh A, Kumar S, Bhumika Random genetic drift affecting Alcohol dehydrogenase polymorphism in laboratory populations of Drosophila ananassae. Jour Sci Res BHU. 2013;57:104–108. [Google Scholar]
- Kumar S, Singh A. Latitudinal clines of allozymes in Indian natural populations of Drosophila ananassae. Dros Inf Serv. 2014;97:63–67. [Google Scholar]
- Kumar S, Singh A. Allozyme polymorphism in Drosophila. Proc Zool Soc. 2016;1:22–31. [Google Scholar]
- Kumar S, Singh AK. Population genetics of Drosophila: genetic variation and differentiation among Indian natural populations of Drosophila ananassae. Zool Stud. 2017;56:e1. doi: 10.6620/ZS.2017.56-01. [DOI] [PMC free article] [PubMed] [Google Scholar]
- Kumar S, Singh AK, Singh S. Persistence of heterozygosity owing to balancing selection at allozyme loci in laboratory populations of Drosophila ananassae. Genomics Genet. 2019;12(1):11–18. [Google Scholar]
- Lewald KM, Abrieux A, Wilson DA, Lee Y, Conner WR, Andreazza F, Beers EH, Burrack HJ, Daane KM, Diepenbrock L. Population genomics of Drosophila suzukii reveal longitudinal population structure and signals of migrations in and out of the continental United States. G3. 2021;11(12):jkab343. doi: 10.1093/g3journal/jkab343. [DOI] [PMC free article] [PubMed] [Google Scholar]
- Lewontin RC, Hubby JL. A molecular approach to the study of genic heterozygosity in natural populations. II. Amount of variation and degree of heterozygosity in natural populations of Drosophila pseudoobscura. Genetics. 1966;54(2):595. doi: 10.1093/genetics/54.2.595. [DOI] [PMC free article] [PubMed] [Google Scholar]
- Mateus R, Sene F. Temporal and spatial allozyme variation in the South American cactophilic Drosophila antonietae (Diptera; Drosophilidae) Biochem Genet. 2003;41(7):219–233. doi: 10.1023/a:1025506301239. [DOI] [PubMed] [Google Scholar]
- Mateus R, Sene F. Population genetic study of allozyme variation in natural populations of Drosophila antonietae (Insecta, Diptera) J Zool Syst Evol Res. 2007;45(2):136–143. [Google Scholar]
- Mateus RP, Machado LP, Moraes EM, Sene FM. Allozymatic divergence between border populations of two cryptic species of the Drosophila buzzatii cluster species (Diptera: Drosophilidae) Biochem Syst Ecol. 2010;38(3):410–415. [Google Scholar]
- Matsuda M, Tomimura Y, Tobari YN. Reproductive isolation among geographical populations of Drosophila bipectinata Duda (Diptera, Drosophilidae) with recognition of three subspecies. Genetica. 2005;125(1):69–78. doi: 10.1007/s10709-005-0393-z. [DOI] [PubMed] [Google Scholar]
- Matsuda M, Ng C-S, Doi M, Kopp A, Tobari Y. Evolution in the Drosophila ananassae species subgroup. Fly. 2009;3(2):157–169. doi: 10.4161/fly.8395. [DOI] [PubMed] [Google Scholar]
- Morton RA, Choudhary M, Cariou M-L, Singh RS. A reanalysis of protein polymorphism in Drosophila melanogaster, D. simulans, D. sechellia and D. mauritiana effects of population size and selection. Genetica. 2004;120(1):101–114. doi: 10.1023/b:gene.0000017634.17098.aa. [DOI] [PubMed] [Google Scholar]
- Nei M. Genetic distance between populations. Am Nat. 1972;106:283–292. [Google Scholar]
- Ng CS, Hamilton AM, Frank A, Barmina O, Kopp A. Genetic basis of sex-specific color pattern variation in Drosophila malerkotliana. Genetics. 2008;180(1):421–429. doi: 10.1534/genetics.108.091728. [DOI] [PMC free article] [PubMed] [Google Scholar]
- Oakeshott J, Gibson J, Anderson P, Knibb W, Anderson D, Chambers G. Alcohol dehydrogenase and glycerol-3-phosphate dehydrogenase clines in Drosophila melanogaster on different continents. Evolution. 1982;36:86–96. doi: 10.1111/j.1558-5646.1982.tb05013.x. [DOI] [PubMed] [Google Scholar]
- Ometto L, Glinka S, De Lorenzo D, Stephan W. Inferring the effects of demography and selection on Drosophila melanogaster populations from a chromosome-wide scan of DNA variation. Mol Biol Evol. 2005;22(10):2119–2130. doi: 10.1093/molbev/msi207. [DOI] [PubMed] [Google Scholar]
- Parkash R, Singh D, Lambhod C. Divergent strategies for adaptations to stress resistance in two tropical Drosophila species: effects of developmental acclimation in D. bipectinata and the invasive species D. malerkotliana. J Exp Biol. 2014;217(6):924–934. doi: 10.1242/jeb.096818. [DOI] [PubMed] [Google Scholar]
- Peakall R, Smouse PE. GenAlEx 6,5, genetic analysis in Excel: Population genetic software for teaching and research, an update. Bioinformatics. 2012;28:2537–2539. doi: 10.1093/bioinformatics/bts460. [DOI] [PMC free article] [PubMed] [Google Scholar]
- Pecsenye K, Saura A. Structure of variation in enzyme activity in natural Drosophila melanogaster populations. Hereditas. 2002;136(1):75–83. doi: 10.1034/j.1601-5223.2002.1360111.x. [DOI] [PubMed] [Google Scholar]
- Petermann S, Otto S, Eichner G, Schetelig MF. Spatial and temporal genetic variation of Drosophila suzukii in Germany. J Pest Sci. 2021;94:1–15. [Google Scholar]
- Prakash S. Allelic variants at the xanthine dehydrogenase locus affecting enzyme activity in Drosophila pseudoobscura. Genetics. 1977;87(1):159–168. doi: 10.1093/genetics/87.1.159. [DOI] [PMC free article] [PubMed] [Google Scholar]
- Sharma M, Sharma S, Parkash R. ADH polymorphism and ethanol tolerance in three species of ananassae species subgroup. Evol Biol. 1993;7:51–62. [Google Scholar]
- Singh BN. Genetic polymorphisms in Drosophila. Curr Sci. 2013;105:461–469. [Google Scholar]
- Singh BN, Banerjee P. Population genetical, behavioural and evolutionary studies in the Drosophila bipectinata species complex. Proc Indian Nat Sci Acad. 2016;82:99–115. [Google Scholar]
- Singh G, Singh A. Excessive occurrence of paracentric inversions in a Natural population of Drosophila bipectinata. J Exp Zool India. 2018;21:29–33. [Google Scholar]
- Singh G, Singh A. Non-random distribution of heterozygous inversions in a natural population of Drosophila malerkotliana. J Sci Res. 2020;64(1):85. [Google Scholar]
- Singh G, Singh AK. Genetic structuring of Drosophila bipectinata in Indian natural populations based on the distribution of cosmopolitan inversions. J Genet. 2021;100(2):1–10. [PubMed] [Google Scholar]
- Singh AK, Yadav N, Singh G. Isozyme variants in two natural populations of Lymnaea luteola. Eur J Biol Res. 2017;7(4):360–365. [Google Scholar]
- Tomimura Y, Matsuda M, Tobari YN. Chromosomal phylogeny and geographical divergence in the Drosophila bipectinata complex. Genome. 2005;48(3):487–502. doi: 10.1139/g05-012. [DOI] [PubMed] [Google Scholar]
- Umina PA, Weeks AR, Kearney MR, McKechnie SW, Hoffmann AA. A rapid shift in a classic clinal pattern in Drosophila reflecting climate change. Science. 2005;308(5722):691–693. doi: 10.1126/science.1109523. [DOI] [PubMed] [Google Scholar]
- Voelkar RA, Langley CH, Leigh-Brown AJ, Ohnishi S, Kickson B, Montgomeri E, Smith SC. Enzyme null alleles in natural populations of Drosophila melanogaster. Proc Natl Acad Sci USA. 1980;77:1091–1095. doi: 10.1073/pnas.77.2.1091. [DOI] [PMC free article] [PubMed] [Google Scholar]
- Wright S. Isolation by distance. Genetics. 1943;28:114. doi: 10.1093/genetics/28.2.114. [DOI] [PMC free article] [PubMed] [Google Scholar]
- Yang S. Isozyme variations and phylogenetic relationships in the Drosophila bipectinata species complex. Univ Texas Publ. 1972;7213:213–227. [Google Scholar]
- Yue L, Cao LJ, Chen JC, et al. Low levels of genetic differentiation with isolation by geography and environment in populations of Drosophila melanogaster from across China. Heredity. 2021 doi: 10.1038/s41437-021-00419-8. [DOI] [PMC free article] [PubMed] [Google Scholar]