Abstract
Nutrient deficiencies lead to various health issues and are common worldwide. Potato germplasm is a rich source of natural variations and genetic variability present in it can be exploited for developing nutrient-rich high-yielding potato varieties. In this study, variations in the yield, dry matter (DM) and mineral nutrients concentrations were evaluated in both peeled and unpeeled tubers of 243 highly diverse tetraploid potato accessions. These were raised under field conditions for two consecutive years. The germplasm studied has a wider range of variations in peeled tubers DM (13.71–27.80%), Fe (17.08–71.03 mg/kg), Zn (9.55–34.78 mg/kg), Cu (2.13–13.25 mg/kg), Mn (7.04–25.15), Ca (117.4-922.5 mg/kg), Mg (656.6-1510.6 mg/kg), S (1121.3-3765.8 mg/kg), K (1.20–3.09%), P (0.21–0.50%) and Mo (53.6–1164.0 ppb) concentrations compared to popular Indian potato varieties. Higher nutrient concentrations in whole tubers compared to tuber flesh suggest that these are present in high concentration in the tuber peripheral layers and peeling off the tubers results in the loss of nutrients. Highest loss due to peeling off the tubers was observed in Fe (35.63%) followed by Cu (22.80%), Mn (21.69%), Ca (21.27%), Mg (12.89%), K (12.75%), Zn (10.13%), and Mo (9.87%). The GCV and PCV for all the traits in peeled tubers ranged from 9.67 to 29.91%, and 13.84 to 43.32%, respectively. Several significant positive correlations were observed among the parameters and the first two principal components accounted for 39.37% of total variations. The results of this study will pave a way for the development of nutrient-rich high-yielding potato varieties.
Supplementary Information
The online version contains supplementary material available at 10.1007/s12298-022-01197-1.
Keywords: Potato nutrients, Dry matter, PCV, GCV, Heritability, Genetic advance
Introduction
Mineral malnutrition has become one of the most challenging issues with an ever-increasing global population (White and Brown 2010). Presently, around 800 million people are malnourished (FAO, 2017) and nearly two billion individuals are suffering from hidden hunger (Allen et al. 2006; IFPRI 2016). Among all minerals, iron and zinc deficiencies are most prevalent (McLean et al. 2009; King et al. 2016; Hefferon 2019). This condition is worse in developing nations like India, where 50% of the global micronutrient deficient population lives (USAID OMNI 2005). In these circumstances, the biofortification of staple crops seems like a sustainable solution.
Potato (Solanum tuberosum. L) is the third most important crop in terms of human consumption, which is cultivated in more than 100 countries (Dutt et al. 2017; Alsahlany et al. 2019). The global potato production is about 300 million tonnes per year and more than 1 billion people across the world consume it (Trapero-Mozos et al. 2018; Kennedy et al. 2019) reported that China ranks first in potato production, followed by India. It is a staple crop in many countries because it is easy to grow, requires less land than other major crops, and has high nutritional value (Mullins et al. 2006). It contributes key macro and micronutrients to the human diet, especially when consumed with the skin (Subramanian et al. 2011). Moreover, potato tubers contain lower concentrations of anti-nutrient compounds such as phytates. Previous studies showed that Fe and Zn bioavailability from potato tubers is high compared to cereals (Vergara Carmona et al. 2019; Jongstra et al. 2020). More than 50% of potatoes are produced by developing nations (Food and Agriculture Organization of the United Nations 2009), where the mineral malnutrition has become an abysmal (Perez-Escamilla et al. 2018; Wakeel et al. 2018). Different potato germplasm banks are maintaining highly diverse potato germplasm throughout the globe (Bradshaw et al. 2006), which could be used for the development of nutrient-rich potato cultivars through conventional breeding or modern genetic engineering tools. Therefore, it is an essential crop for ensuring food and nutritional security to fight hunger and malnutrition (Singh et al. 2021a). The aim of the present study was to evaluate the variation in the tuber yield, dry matter content and mineral nutrients concentration in 243 highly diverse tetraploid potato accessions.
Material and method
Plant material
A panel of 243 diverse tetraploid potato accessions was formed based upon different morphological traits. These accessions originated from The Netherlands, Australia, New Zealand, India, USA, UK, Norway, Canada, Colombia, Peru, Hungary, Germany, Italy, Romania, France, Mexico and some with an unknown origin were also a part of this population (Table S1). All accessions were collected from the Potato Germplasm Repository, Division of Crop Improvement & Seed Technology, ICAR-Central Potato Research Institute (CPRI), Shimla, India. The selected potato diversity panel was grown in the experimental fields of ICAR-Central Potato Regional Station (CPRS), Modipurum, India (29°04’06.9″ N 77°42’26.1″ E) for two consecutive years (2019 and 2020) under uniform agronomic practices and non-nutrient limited conditions. The tubers were sown 20 cm apart within the rows whereas the row-to-row spacing was 60 cm. NPK fertilizer was applied in a ratio of 240: 40: 100, whereas no micronutrients were applied to the crop artificially. After 30 days of planting, roguing was performed to remove the off type, and plants showing mosaics and rolling of leaves.
Soil samples from each bed of the potato fields were randomly taken. These were analyzed for pH, electric conductivity (EC), organic carbon percent (OC %), nitrogen (N), phosphorous (P), potassium (K), iron (Fe), zinc (Zn), copper (Cu), manganese (Mn), boron (B), calcium (Ca), magnesium (Mg), sodium (Na) and sulfur (S). The soil type was normal and non-saline with average pH of 6.69 and EC 0.32 Ec dsm− 1. The concentration of NPK present in the soil were within the recommended limits of NPK for potato. The concentrations of secondary nutrients (Ca, Mg, Na, and S) and micronutrients (Fe, Zn, Cu, Mn, and B) were higher than their critical limits (Table 1). This indicates that the crop was raised under non-limiting nutrient conditions and the variations in the tuber nutrient content are due to their differential genetic capabilities. The soil variations within the plots were taken care of by planting K. Jyoti and K. Himalini potato varieties as reference checks.
Table 1.
Summary of all measured soil characteristics
| Parameter | Average | SD | CV |
|---|---|---|---|
| N kg/ha | 279.25 | 7.52 | 2.69 |
| P kg/ha | 141.40 | 9.70 | 6.86 |
| K kg /ha | 194.65 | 12.42 | 6.38 |
| Fe ppm | 13.78 | 2.12 | 15.42 |
| Zn ppm | 2.82 | 0.23 | 8.00 |
| Cu ppm | 2.09 | 0.24 | 11.63 |
| Mn ppm | 10.63 | 1.80 | 16.93 |
| B ppm | 0.50 | 0.03 | 6.79 |
| Ca ppm | 684.92 | 68.54 | 10.01 |
| Mg ppm | 112.92 | 7.26 | 6.43 |
| Na ppm | 36.97 | 7.29 | 19.71 |
| S ppm | 50.58 | 8.69 | 17.19 |
| pH | 6.69 | 0.18 | 2.66 |
| EC (dsm-1) | 0.32 | 0.08 | 26.07 |
The potato tubers were harvested 90 days after sowing. The morphological traits namely prominent tuber shape, skin color, flesh color and eye depth were recorded at the time of harvesting. Then by following the standard protocol (Porras et al. 2014), seven even-sized potato tubers were collected from each accession for nutrient analysis. These tubers were first hand-rinsed under running tap water to remove the dirt from tuber skin. After that, these were washed with high purity 0.1% nitric acid (HNO3) followed by another washing with ddH2O to remove the soil traces, if any. Firstly, the tubers were dried with the help of paper towels and then were kept in dark for air-drying prior to processing. Then about 0.5 mm tuber peel was removed by using a high quality stainless steel vegetable peeler followed by chopping off the tubers with a knife for the same quality. The vegetable peelers, knives, petri plates and plastic ware were washed with 0.5% HNO3 acid followed by ddH2O prior to use. Then chopped tuber samples were kept at 70° C in glass petri plates for oven drying. Then the percentage of dry matter (DM) was calculated using the following formula:
Then oven-dried samples were ground and then digested with nitric acid (69%) and perchloric acid (70%). The acid digested tuber samples were diluted 100 times using ddH2O. The micronutrient analysis was performed by using inductively coupled plasma mass spectrometry (iCAP 7000 Series ICP-OES, Thermo Scientific™). The mineral concentration was analyzed for Fe, Zn, Cu, Mn, Ca, Mg, S, and Mo. The content of Phosphorus (P) in potato tubers was measured by taking 5 ml from each digested potato tuber sample. Then 10 ml of vanadate-molybdate solution was added to it and the final 50 ml volume was prepared by the addition of ddH2O. Then the samples were kept at room temperature for 20 min. Then the readings were observed by using a spectrophotometer (UV-1700 PharmaSpec Shimadzu™) at 420 nm wavelength. The concentration of K in potato samples was determined by taking 1 g of dried potato tuber powder from each sample. Then 50 ml of 2% acetic acid was added and samples were kept overnight for pre-digestion. The next day, these were mechanically shaken for 40 min. After that, samples were filtered by using Whatman No. 42 filter papers and the filtrates were used to measure the K concentration using of flame photometer (Elico® CL378). The reference genotypes have statistically similar concentrations for every nutrient in different blocks. The homogeneity in the soil samples, in terms of nutrient concentration and reference checks at different sites in the field signified a homogenous environment for nutrients. It was crucial to maintain uniformity within the field and between the years to reduce the influence of environmental factors on tuber nutrient concentration.
Statistical analysis
The analysis of variance (ANOVA) was performed by using package ‘lme4’ in R. The environmental variance, genotypic variance, phenotypic variance, environmental coefficient of variation (ECV), genotypic coefficient of variation (GCV), phenotypic coefficient of variation (PCV), heritability (H2) (broad sense), Genetic advance (GA), and genetic advance as percentage of the mean (GAM) were calculated using ‘variability’ package. To determine the genetic relations among the nutrients, DM and yield traits Pearson correlation coefficients were calculated using package ‘corrplot’ in R. Cluster analysis was performed using Gower distances in R using the ‘daisy’ function and a dendrogram was constructed based on k-medoids clustering method using ‘pam’ (Partitioning Around Medoids) function of package ‘cluster’ based on nutrient and DM data. The number of clusters and quality of clustering were determined by the average silhouette method. Principal component analysis (PCA) was performed to capture most of the variability in original data for nutrients. Prior to PCA, the data was standardized by scaling the data to have a mean of ‘0’ and SD of ‘1’.
Results and discussion
Characterization of potato germplasm for tuber nutrient concentrations
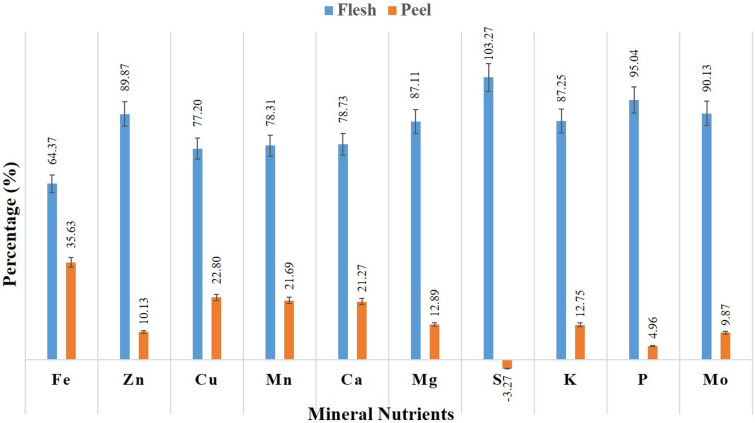
Tubers harvested in the years 2020 and 2021 were analyzed for Fe, Zn, Cu, Mn, Ca, Mg, S, K, P and Mo concentrations (Table S2). Cultivated potato varieties, Kufri Jyoti and Kufri Himalini were used as checks in the study. In tuber flesh, Kufri Jyoti and Kufri Himalini had a mean Fe concentration of 21.51 ppm and 27.72 ppm, respectively and mean Zn concentrations were 13.28 ppm and 21.69 ppm, respectively (Table 2). Whereas, in the diversity panel Fe concentration in the potato tuber flesh ranged from 17.08 to 71.03 ppm, Zn from 9.55 to 34.78 ppm, Cu from 2.13 to 13.25 ppm and Mn 7.04–25.15 ppm. Likewise, a wide range of variations was observed for other nutrients in the potato tuber flesh and whole tuber samples compared to the checks. Higher nutrient concentrations were observed in whole tubers than peeled tubers with an exemption of S in which a slightly higher concentration was observed in tuber flesh. This indicates that outer layers near the periderm of potato tubers have more concentrations of nutrients than the cortex. These results are in agreement with previous reports (Wszelaki et al. 2005; Subramanian et al. 2011; Sharma et al. 2017). The percent losses due to peeling off the potatoes were calculated (Table S3). The highest loss due to peeling off the tubers were observed in Fe (35.63%) followed by Cu (22.80%), Mn (21.69%), Ca (21.27%), Mg (12.89%), K (12.75%), Zn (10.13%), and Mo (9.87%) (Fig. 1). Previously, Sharma et al. (2017) also reported 39.87%, 21.75%, 15.36% and 12.46% loss of Fe, Mn, Cu and Zn due to peeling off the potato tubers. The reason behind high concentrations of Fe Ca and Mn in the tuber surface layers is its low mobility in the phloem, whereas a slightly higher concentration of sulfur in tuber flesh might be because of its high mobility in the phloem (Subramanian et al. 2011; Singh et al. 2020a). The summary statistics for the two year's data for nutrients in tuber flesh and whole are provided in Tables 3 and 4, respectively.
Table 2.
Comparison of micronutrient concentration between popular tetraploid potato varieties (Kufri Jyoti and Kufri Himalini) and accessions in the association-mapping panel
| Nutrient | Micronutrient concentrations (on the basis of 2 years mean values) | |||||
|---|---|---|---|---|---|---|
| K. Jyoti | K. Himalini | Range in the AM Panel | ||||
| TF* | WT** | TF | WT | TF | WT | |
| Fe (ppm) | 21.51 | 42.21 | 27.72 | 38.64 | 17.08–71.03 | 27.60-87.08 |
| Zn (ppm) | 13.28 | 16.74 | 21.69 | 23.47 | 9.55–34.78 | 11.82–35.63 |
| Cu (ppm) | 4.14 | 5.65 | 5.78 | 6.93 | 2.13–13.25 | 3.0–14.83 |
| Mn (ppm) | 11.34 | 16.55 | 16.56 | 19.82 | 7.04–25.15 | 9.37–39.70 |
| Ca (ppm) | 572.74 | 600.87 | 382.59 | 515.25 | 117.43–922.49 | 186.74-1062.79 |
| Mg (ppm) | 1031.65 | 1279.88 | 938.23 | 1087.22 | 656.56-1510.58 | 770.94-2022.64 |
| S (ppm) | 1898.64 | 1828.29 | 2444.27 | 2303.80 | 1121.31–3765.08 | 1111.05–3870.28 |
| P (%) | 0.33 | 0.34 | 0.28 | 0.30 | 0.21–0.50 | 0.20–0.57 |
| K (%) | 2.11 | 2.44 | 2.36 | 2.61 | 1.20–3.09 | 1.79–3.53 |
| Mo (ppb) | 322.90 | 315.60 | 122.60 | 214.30 | 53.60–1164.0 | 30.47–1080.0 |
*Tuber Flesh; **Whole Tuber
Fig. 1.
Percent distribution of micro, secondary and macronutrients in tuber flesh and peel based on two years data
Table 3.
Variations nutrient content in peeled tubers based upon 2 years data
| Fe (ppm) | Zn (ppm) | Cu (ppm) | Mn (ppm) | Ca (ppm) | Mg (ppm) | S (ppm) |
K (%) | P (%) | Mo (ppb) | |
|---|---|---|---|---|---|---|---|---|---|---|
| Range | 17.08–71.03 | 9.55–34.78 | 2.13–13.25 | 7.04–25.15 | 117.43-922.49 | 656.56-1510.58 | 1121.31-3765.08 | 1.20–3.09 | 0.21–0.50 | 53.63–1164.0 |
| Mean | 31.63 | 18.48 | 5.00 | 13.51 | 343.61 | 1006.07 | 2011.73 | 2.14 | 0.34 | 257.69 |
| SD | 8.77 | 4.27 | 1.66 | 4.03 | 114.93 | 157.48 | 434.49 | 0.28 | 0.05 | 167.24 |
| CV | 27.73 | 23.11 | 33.11 | 29.79 | 33.45 | 15.65 | 21.60 | 13.17 | 16.16 | 64.90 |
Table 4.
Variations nutrient content in whole tubers based upon 2 years data
| Fe (ppm) | Zn (ppm) | Cu (ppm) | Mn (ppm) | Ca (ppm) | Mg (ppm) | S (ppm) |
K (%) | P (%) | Mo (ppb) | |
|---|---|---|---|---|---|---|---|---|---|---|
| Range | 27.60–87.60 | 11.82–35.63 | 3.00-14.83 | 9.37–39.70 | 186.74-1062.79 | 778.94-2022.64 | 1111.05-3870.28 | 1.79–3.53 | 0.20–0.57 | 30.47–1080.0 |
| Mean | 49.15 | 20.55 | 6.48 | 17.25 | 436.08 | 1154.94 | 1948.08 | 2.46 | 0.37 | 285.90 |
| SD | 11.42 | 4.32 | 2.01 | 4.62 | 128.55 | 216.34 | 379.81 | 0.29 | 0.06 | 153.20 |
| CV | 23.23 | 21.01 | 30.97 | 26.77 | 29.48 | 18.73 | 19.50 | 11.98 | 16.13 | 53.59 |
Iron
There were significant variations among the accessions for Fe, Zn, Mn and Cu concentrations in peeled as well as in whole tubers. Our findings suggest a much wider range of Fe content in peeled tubers than previously reported by (Burgos et al. 2007; Paget et al. 2014; Singh et al. 2020b). However, Dalamu et al. (2017, 2019) reported somewhat similar ranges of Fe content (14.90-67.13 mg/kg and 19.28–63.94 mg/kg) in peeled potato tubers, whereas a wider range of Fe content (17.13 to 164.83 mg/kg) in peeled has been reported by Abebe et al. (2012). Average Fe concentrations in the accession varied from 27.60 to 87.60 mg/kg in whole tubers. This is a much wider range of Fe content in whole tubers than previously published reports (reviewed by Singh et al. 2021b). However, Andre et al. (2007) reported a broader range of Fe content (29.87–157.96 mg/kg) in whole tubers with a mean of 54.95 in 74 Andean potato cultivars.
Zinc
The Zn content ranged from 9.55 to 34.78 mg/kg with a mean of 18.48 mg/kg in peeled tubers and 11.82–35.63 mg/kg with an average of 20.55 mg/kg in whole tubers. Singh et al. (2021c), reported a little higher mean concentration (22.56 mg/kg) of Zn in whole tubers of 100 potato accessions. The highest Zn concentration was observed in CP 1304, followed by CP 2397 and CP 1468. The ranges observed are slightly higher than the ranges reported in the earlier studies (Abebe et al. 2012; Andre et at. 2007; Brown et al. 2011; Haynes et al. 2012; Sharma et al. 2017; Subramanian et al. 2017), while Dalamu et al. (2017, 2019) reported a slightly wider range of Zn content potato tubers.
Manganese
In the case of peeled tubers, Mn content varied from 7.04 to 25.15 mg/kg, which is slightly lower than the Mn content reported by Singh et al. (2020b) (7.27–29.80 mg/kg) and Sharma et al. (14.19–29.86 mg/kg) in Solanum tuberosum ssp. andigena germplasm and Indian potato varieties, respectively. The average Mn content in whole tubers ranged from 9.37 to 39.70 mg/kg, which is higher than earlier reports published by Haynes et al. (2012) (7.8–12.9 mg/kg), Singh et al. (2021c) (7.20–28.40 mg/kg) and Subramanian et al. (2017) (3.9–11.7 mg/kg). Sharma et al. (2017) reported a somewhat similar range of Mn in whole tubers of Indian potato varieties.
Copper
There were fewer variations in potatoes for Cu content than in other micronutrients and there was a slight difference between the ranges of Cu in peeled (2.13–13.25 mg/kg) and whole tubers (3.00-14.83 mg/kg). Similar ranges of Cu in potato germplasm had been reported in the previous studies (Rivero et al. 2003; Haynes et al. 2012; Subramanian et al. 2017). The accessions JEX/A-1152 and CP 2086 had the highest Cu concentrations. In peeled tubers, only 10 accessions had a Cu concentration of more than 8 mg/kg, whereas in whole tubers 47 accessions had a Cu concentration of more than 8 mg/kg.
Calcium
The mean Ca concentration varied from 117.43 mg/kg in CP 4433 to 922.49 mg/kg in CP 4452 in peeled tubers. Similarly, the lowest average Ca concentration 186.74 mg/kg was observed in CP 4433 and the highest average Ca concentration of 1062.79 mg/kg was observed in CP 4452 in whole tuber samples. In tuber flesh, only five accessions had Ca concentrations more the 600 mg/kg while in the case of whole tubers twenty accessions had Ca concentrations more than 600 mg/kg. In general, Ca contents lies within the previously reported ranges for potato. Andre et al. (2007) reported a range for Ca content in potatoes from 271.09 mg/kg to 1092.93 mg/kg in Andean cultivars and Subramanian et al. (2017) reported a range for Ca content from 100 mg/kg to 700 mg/kg by analyzing the commonwealth potato collection. The overall mean for Ca content in whole tubers was 436.08 mg/kg, which is higher than the mean Ca content reported by Subramanian et al. (2017) but it is less than the mean Ca content reported by Andre et al. (2007).
Magnesium
The magnesium content in peeled tubers varied from 656.56 mg/kg to 1510.58 mg/kg with a mean of 1006.07 mg/kg and in whole tubers, it ranged from 778.94 mg/kg to 2022.64 mg/kg with a mean of 1154.94 mg/kg. Our range for Mg content in potatoes lies within the previously reported range (450–2200 mg/kg) (Patil et al. 2016). In peeled tubers 41.98% and whole tubers, 38.27% of the total number of accessions had Mg content higher than their overall mean values. The lowest-ranked accession for Mg content was CP 1633 in both peeled and unpeeled tubers and CP 2285 was the highest-ranked accession in peeled tubers, while CP 3318 had the highest Mg content in the case of whole tubers.
Sulfur
There were significant variations among the accessions for S concentrations in potato tubers. The S content varied from 1121.31 mg/kg in JEX/A-705 to 3765.08 mg/kg in CP 1225 in tuber flesh. Our ranges for S concentration in potatoes are within the previously reported range (400–4000 mg/kg) (Patil et al. 2016). The mean S content in tuber flesh was 2011.73 mg/kg and in the whole tubers, it was 1948.08 mg/kg. In the case of tuber flesh, eight accessions had an S content of more than 3000 mg/kg, while in the case of whole tuber samples only two accessions had S content more than 3000 mg/kg. A slightly higher concentration of sulfur in the tuber flesh are might be because of its phloem mobility. These results are in agreement with Subramanian et al. (2011).
Potassium
There were notable variations for K content in the peeled as well as unpeeled tubers. In peeled tubers, it varied from 1.20 to 3.09% whereas in whole tubers K content varied from 1.79 to 3.53%. In tuber flesh, the least K concentration was found in JEX/A-638 and CP 4175 had the highest K content. There were only two accessions in with more than 3% K content in tuber flesh, while in the case of whole tubers there were thirteen accessions with more than 3% K content.
Phosphorus
There were large differences among the potato accessions for P content in peeled and unpeeled tubers. The mean P content in tuber flesh ranged from 0.21% in CP 4316 to 0.50% in CP 4163. The P concentration in the majority of accessions ranged between 0.3 − 0.4%. Only three accessions (CP 3816, CP 1435 and CP 4163) had more than 0.45% P content in tuber flesh.
Dry matter
There was no significant difference in the DM in peeled and whole tubers. The DM content in unpeeled tubers varied from 13.02 to 28.47% with an average of 18.65%. Abebe et al. (2012) reported 23.49% dry matter in potato varieties grown at two distinct locations in Ethiopia. Subramanian et al. (2017) also reported significantly high DM in potato accessions ranging from 17.3 to 48.4% with a mean of 28.9% maintained at Commonwealth Potato Collection, United Kingdom. These variations in the nutrient concentrations indicate that different accessions have differential genetic capabilities for mineral accumulation, as these accessions were grown under uniform conditions.
The mean tuber yield by potato varieties (16.25 kg/plot) was higher in the case compared to potato germplasm (12.01 kg/plot). The lowest mean tuber yield (9.02 kg/plot) was obtained in Solanum tuberosum ssp. andigena germplasm. For most of the nutrients in tuber flesh, there was no significant difference in the mean values of potato germplasm and varieties. However, wider ranges for all the nutrients and DM were observed in the Solanum tuberosum germplasm. The average values for Zn, Mn, Cu, Ca, Mg and P were slightly higher in the Solanum tuberosum ssp. andigena germplasm (Table 5).
Table 5.
Comparison of Solanum tuberosum and Solanum tuberosum ssp. andigena germplasm with popular potato varieties for different nutrient concentrations in tuber flesh, dry matter content and yield
| Trait |
Solanum tuberosum Number 178 |
Solanum tuberosum ssp. andigena Number 26 |
Popular Indian Varieties Number 39 |
|||
|---|---|---|---|---|---|---|
| Range | Mean | Range | Mean | Range | Mean | |
| Fe (ppm) | 17.08–71.03 | 31.68 | 22.12–50.82 | 31.53 | 21.51–58.80 | 31.45 |
| Zn (ppm) | 10.57–34.78 | 18.37 | 14.44–26.51 | 21.26 | 9.55–26.18 | 17.09 |
| Mn (ppm) | 7.04–25.15 | 12.72 | 10.73–24.15 | 15.81 | 9.29–24.73 | 15.60 |
| Cu (ppm) | 2.13–10.18 | 4.69 | 4.68–13.25 | 6.95 | 3.05–8.46 | 5.13 |
| Ca (ppm) | 117.43–922.49 | 330.97 | 197.25–625.92 | 402.39 | 178.69–745.71 | 362.12 |
| Mg (ppm) | 656.56–1510.58 | 1004.22 | 798.89–1426.14 | 1054.43 | 746.37–1254.60 | 982.27 |
| S (ppm) | 1185.03–3765.08 | 1977.96 | 1121.31–2682.72 | 2011.83 | 1412.36–3199.35 | 2165.81 |
| P (%) | 0.21–0.50 | 0.33 | 0.23–0.44 | 0.35 | 0.22–0.45 | 0.33 |
| K (%) | 1.54–3.09 | 2.15 | 1.20–2.74 | 2.13 | 1.62–2.84 | 2.12 |
| Mo (ppb) | 53.60–1164.00 | 267.89 | 68.40–534.4 | 166.35 | 66.67–940.8 | 272.03 |
| DM (%) | 13.74–29.00 | 19.62 | 15.85–25.97 | 19.84 | 14.58–23.96 | 18.37 |
| Yield kg/plot* | 3.9–22.50 | 12.01 | 3.55–16.75 | 9.02 | 11.30–24.00 | 16.25 |
*Plot size 3.6 m2
Several accessions with high concentrations of micronutrients (Fe, Zn, Cu, Mn) in tuber flesh were found in this study (Table S4). Some accessions are a rich source of an individual nutrient, and some accessions are a rich source of several nutrients. For example, genotype CP 1685 had a high concentration of Fe, Zn, S and K with mean concentrations of 55.70 ppm, 28.80 ppm, 3565.30 ppm and 2.81%, respectively. Two accessions belonging to S. tuberosum L. ssp. andigena, JEX/A-288 and JEX/A-361 had high concentrations of both calcium and magnesium. These variations in the nutrient concentrations indicate that different accessions have differential genetic capabilities for mineral accumulation, as these accessions were grown under uniform conditions. The potato accessions exhibiting high nutrient contents could be used as parental lines to catalyze the breeding programs aimed to develop nutrient-rich, high-yielding potato varieties.
Morphological characterization
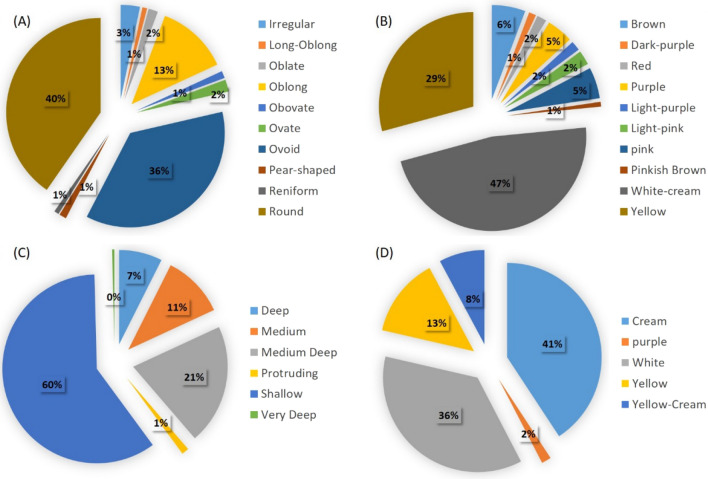
Extensive variations were observed in the potato germplasm in terms of tuber shape, eye depth skin color, and flesh color (Table S5). The genotypes were categorized into 10 groups based on predominant tuber shape. The majority of potato genotypes in this AM panel have predominant tuber shapes round (40%), ovoid (36%) and oblong (13%). The variations in tuber eye depth were characterized by making five categories based on predominant eye depth; (1) protruding, (2) shallow, (3) medium, (4) medium-deep and (5) deep. More than half of the genotypes (60%) have shallow eyes while medium deep eyes were observed in 21% genotypes and 11% genotypes have medium eye depth. The white-cream tuber skin color was observed in 47% population (115 accessions), followed by yellow color in 71 accessions (29%). However, a small portion of the potato accessions has red, purple, dark purple and pink tuber skin color. White and cream flesh colors were present in the majority, whereas four genotypes have purple tuber flesh color (Fig. 2).
Fig. 2.
Pie chart depicting the variability in the diverse tetraploid potato accessions used in this study in terms of predominant a tuber shape, b skin color, c eye depth and (4) flesh color
(A)
Analysis of variance
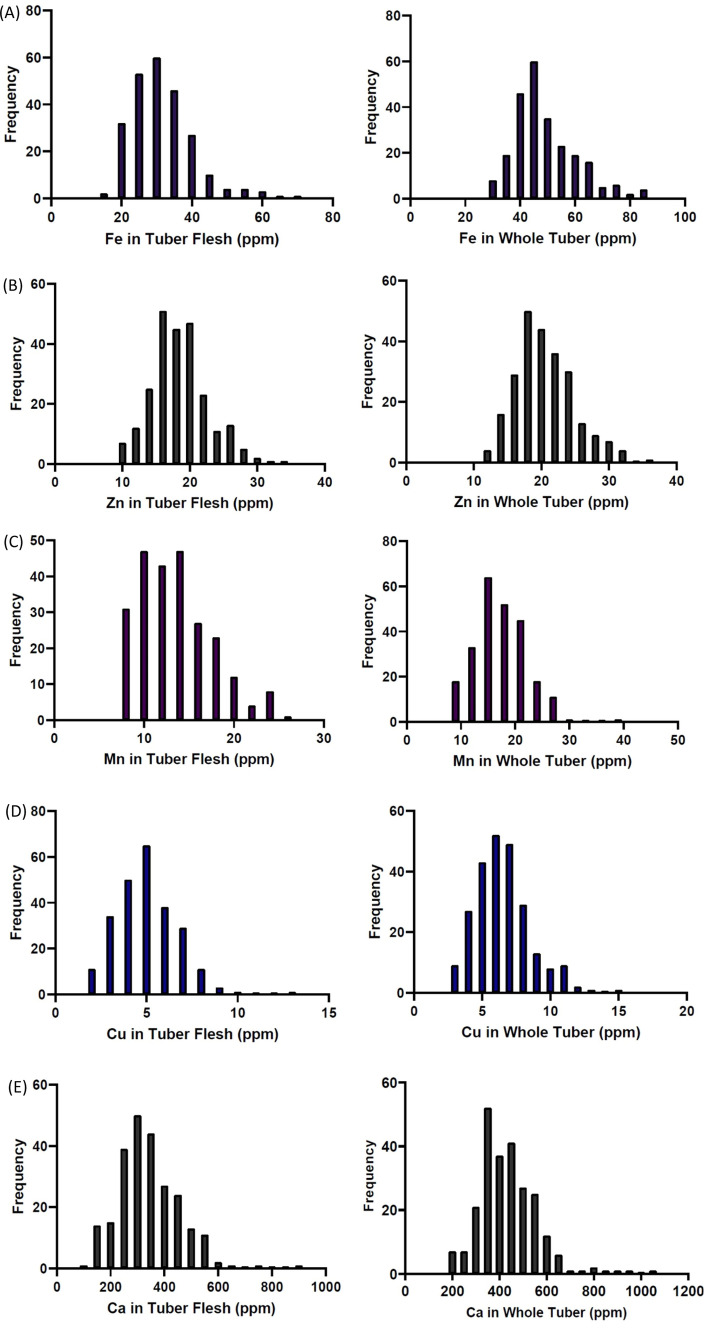
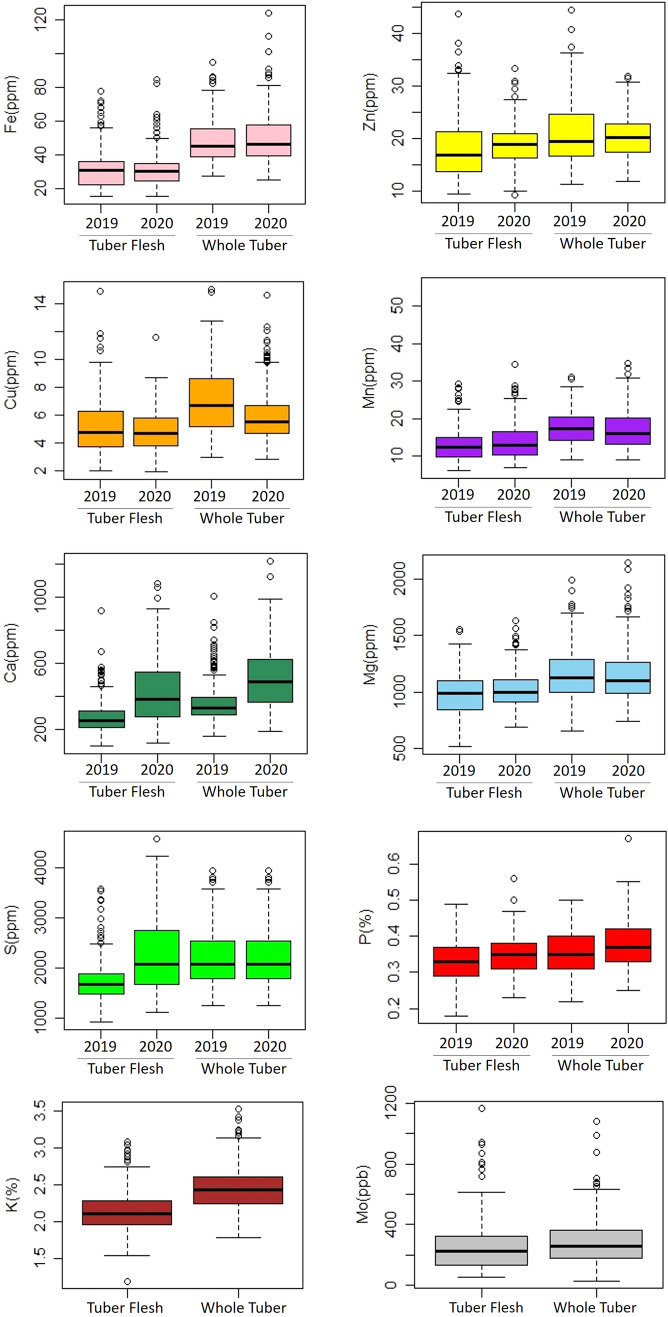
The frequency distributions of nutrient content in potato tuber flesh and whole tuber are presented in Fig. 3. The continuous distribution of tuber nutrient content showed that these as quantitatively inherited traits. All nutrients showed continuous distribution and higher ranges of all nutrients were observed in the whole tubers in comparison to tuber flesh except sulfur. Potential outliers were identified based on two years data. The dry matter content remain almost similar in both the years and there was not much difference observed in the DM between peeled and whole tubers. The concentrations of Mn, Ca and S were higher in the year 2020, whereas Cu and Fe concentrations were a little higher for the year 2019 (Fig. 4). This variation might be because of the environmental effect. The ANOVA showed that in peeled tubers, the genotype x year interaction components were significant for all the nutrients except Fe and Zn (Table 6), whereas in the case of whole tubers the genotype x year interaction components were significant for all the nutrients except Fe, Mn and Mg (Table 7). The genotype x year interaction components were significant for DM content in peeled tubers but not in whole tubers.
Fig. 3.
Frequency distribution of tetraploid potato accessions for grain micronutrients (Fe, Zn, Cu, Mn, Ca, Mg, S, P, and K) in tuber flesh and whole tubers based on two years data. Figures represent grain a Iron b Zinc c manganese d Copper e Calcium, f Magnesium, g Sulfur concentrations (ppm) and h Phosphorus, i Potassium concentrations in percent
Fig. 4.
Boxplots representing variation in tetraploid potato nutrient concentrations in tuber flesh and whole tuber samples for the years 2019 and 2020. Potential outliers are represented by circles. The analysis for K and Mo was performed only for 1 year
Table 6.
A tabular representation of F-values from analysis of variance (ANOVA) for year and genotype and genetic variability components for nutrients, dry matter content and yield traits in potato genotypes based on peeled tubers
| Trait | F values from ANOVA (Year) | Environmental Coefficient of Variance | Genotypic Coefficient of Variance | Phenotypic Coefficient of Variance | Heritability (Broad Sense) | Genetic Advance | Genetic Advance as percentage of mean |
|---|---|---|---|---|---|---|---|
| Fe | 0.0002ns | 26.632 | 20.4394 | 33.5713 | 0.3707 | 8.107 | 25.6352 |
| Zn | 3.8402 ns | 19.0544 | 18.834 | 26.7916 | 0.4942 | 5.0389 | 27.2742 |
| Mn | 9.7353** | 21.8035 | 25.5573 | 33.5941 | 0.5788 | 5.4126 | 40.0529 |
| Cu | 12.5485*** | 20.2985 | 29.9113 | 36.1485 | 0.6847 | 2.5509 | 50.9851 |
| Ca | 148.9471*** | 38.8214 | 19.232 | 43.324 | 0.1971 | 60.4307 | 17.5869 |
| Mg | 8.4528** | 13.8064 | 12.2766 | 18.4751 | 0.4415 | 169.068 | 16.8048 |
| S | 116.4982*** | 27.385 | 9.6658 | 29.0408 | 0.1108 | 133.3239 | 6.6273 |
| P | 101.2701*** | 7.746 | 15.2125 | 17.1385 | 0.7879 | 0.0932 | 27.8055 |
| DM | 4.7068* | 7.3266 | 11.7372 | 13.8363 | 0.7196 | 3.9878 | 20.5105 |
| Yield | 12.940*** | 10.5919 | 31.2833 | 33.0277 | 0.8972 | 7.5526 | 61.0394 |
ECV, GCV and PCV environmental, genetic and phenotypic coefficient of variation as %; H2 broad-sense heritability; GA genetic Advance; GAM genetic advance over mean
ns, not significant; ***Significant at P < 0.001; **Significant at P < 0.05; *Significant at P < 0.05
Table 7.
A tabular representation of F-values from analysis of variance (ANOVA) for year and genotype, and genetic variability components for nutrients, and dry matter content in potato genotypes based on whole tubers
| Trait | F values from ANOVA (Year) | Environmental Coefficient of Variance | Genotypic Coefficient of Variance | Phenotypic Coefficient of Variance | Heritability (Broad Sense) | Genetic Advance | Genetic Advance as percentage of mean |
|---|---|---|---|---|---|---|---|
| Fe | 3.4301 ns | 23.0996 | 16.5888 | 28.4391 | 0.3403 | 9.7966 | 19.9336 |
| Zn | 4.9024* | 17.0240 | 17.2697 | 24.2499 | 0.5072 | 5.2072 | 25.3354 |
| Mn | 1.4043 ns | 19.2627 | 23.1126 | 30.0873 | 0.5901 | 6.3100 | 36.5746 |
| Cu | 63.569*** | 20.6027 | 27.4066 | 34.2870 | 0.6389 | 2.9245 | 45.1274 |
| Ca | 171.2438*** | 30.1045 | 20.4785 | 36.4095 | 0.3163 | 103.4703 | 23.7273 |
| Mg | 0.003ns | 11.8705 | 16.7893 | 20.5619 | 0.6667 | 326.1609 | 28.2404 |
| S | 134.6894*** | 23.8748 | 9.83310 | 25.8204 | 0.1450 | 150.2765 | 7.7141 |
| P | 58.0573*** | 9.48750 | 14.4647 | 17.2886 | 0.7000 | 0.0912 | 24.9301 |
| DM | 1.296ns | 6.90660 | 11.9672 | 13.8171 | 0.7501 | 4.0391 | 21.3515 |
ECV, GCV and PCV environmental, genetic and phenotypic coefficient of variation as %; H2 broad-sense heritability; GA genetic Advance; GAM genetic advance over mean
ns, not significant; ***Significant at P < 0.001; **Sgnificant at P < 0.05; *Significant at P < 0.05
Estimation of genetic variability parameters
The ECV, GCV and PCV for the 10 nutrients and DM for tuber flesh ranged from 7.33 to 38.82%, 9.67 to 29.91%, and 13.84 to 43.32% respectively. Among all traits, Cu showed the highest GCV (29.91%), whereas Ca showed the highest PCV (43.32%) (Table 6). Among all parameters, H2 estimates ranged from 0.11 to 0.79. GAM ranged from 6.63 to 50.99% for S and Cu, respectively. In whole tuber samples, ECV, GCV and PCV ranged from 6.91 to 30.10%, 9.83 to 27.41%, and 13.82 to 36.41% respectively. Similar to tuber flesh samples, Cu showed the highest GCV (27.41%) and Ca showed the highest PCV (36.41%) in whole tubers, too (Table 7). The H2 estimates ranged from 0.15 to 0.75. The GAM ranged from 7.71 to 45.13% for S and Cu, respectively. However, among all the parameters highest H2 (0.90) and GAM (61.04%) were observed for tuber yield.
Correlation and cluster analysis
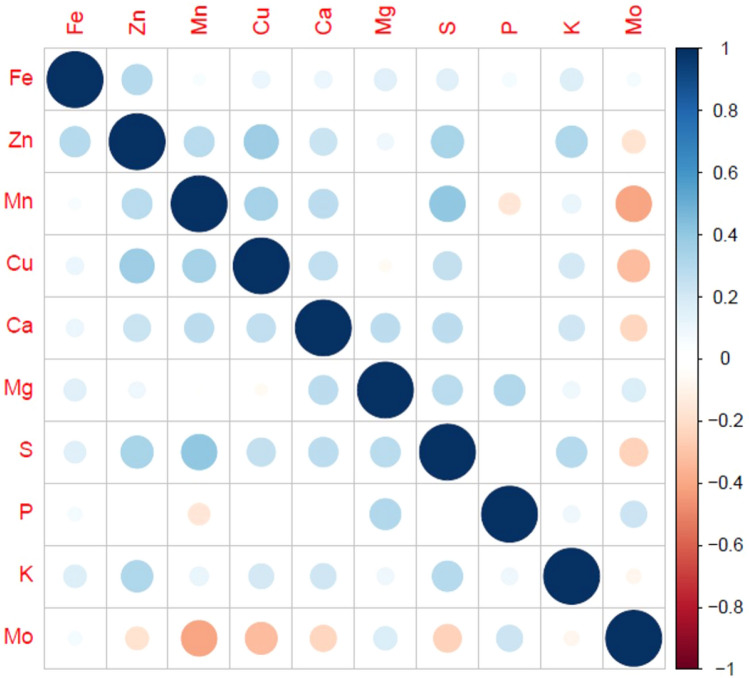
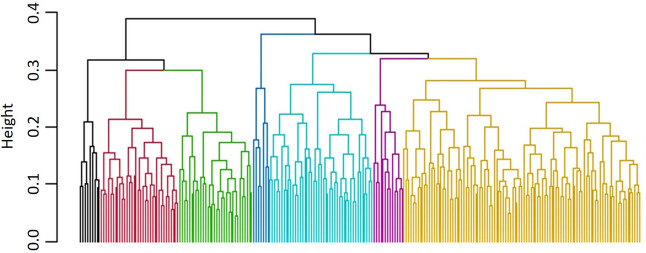
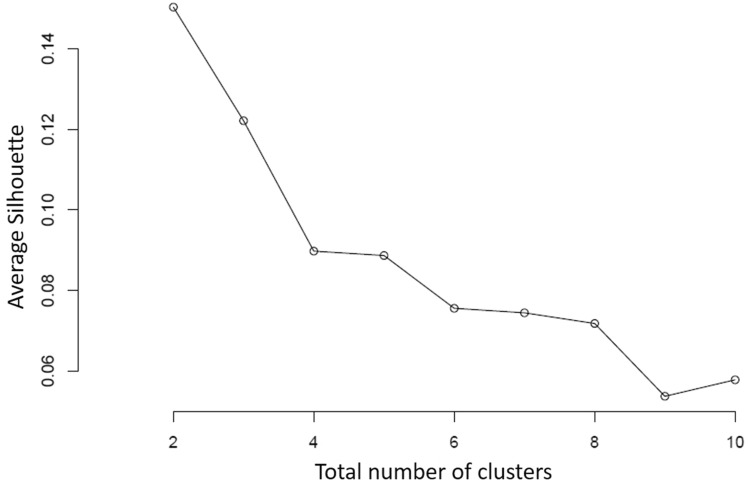
Correlation among the nutrients was estimated in both peeled and whole tubers. Among the micronutrients in tuber flesh Fe content was positively correlated with Zn (r2 = 0.30***), Zn was positively correlated with Mn (r2 = 0.29***) and Cu (r2 = 0.37***) and Mn were correlated with Cu (r2 = 0.35***). Earlier, Andre et al. (2007) and Dalamu et al. (2019) reported a positive correlation between Fe and Zn concentration. In the case of secondary nutrients and macronutrients, Ca was positively correlated to Mg (r2 = 0.27***), S (r2 = 0.28***) and K (r2 = 0.21***), but negatively correlated with Mo (r2 = -0.22***). Positive correlations were also found between Mg-S (r2 = 0.28***) and Mg-P (r2 = 0.31***). Mn was significantly associated with S (r2 = 0.40***). Abebe et al. (2012) reported significant correlations between P-Fe and P-Zn. In contrast, we do not found significant correlations between P-Fe and P-Zn. Dry matter was negatively correlated to all the nutrients except Mo. Other significant correlations were also found between micro, secondary and macronutrients (Fig. 5). The association among the selected traits and their contribution to diversity was validated by multivariate analysis. The k-medoids cluster analysis based upon Gower distance was performed to study associations among the parameters for appointing the potato accessions to different clusters (Fig. 6). To find out the Gower distance a dissimilarity matrix of 29,403 dissimilarities varied from 0.03906 to 0.39727 with a mean of 0.18127 has been generated. Majorly, accessions were grouped into seven clusters, which are again sub-grouped into different clusters (Table S6). However, based upon the average silhouette method they were divided into two major clusters, where clusters comprised 75 and 168 genotypes, respectively (Fig. 7). If these clusters were divided into three clusters, then 7 genotypes from the bigger cluster formed a separate cluster. The selection and crossing of these potato accessions from different clusters would be useful to bring together the desirable genes for nutritional breeding.
Fig. 5.
Correlation among the nutrients in the tuber flesh of 243 tetraploid potato accessions based on two years data. Correlations significant at p ≤ 0.01 are presented. Positive correlations are shaded with blue color and negative correlations are shaded with red color
Fig. 6.
Cluster analysis based on Gower distance dissimilarity matrix for tuber yield, dry matter content and nutrient concentrations in tuber flesh as well as in whole tubers in 243 tetraploid potato accession
Fig. 7.
Average silhouette width for clustering in 2–10 groups. The largest average (two groups) corresponds to the best clustering according to the silhouette criterion
Principal component analysis
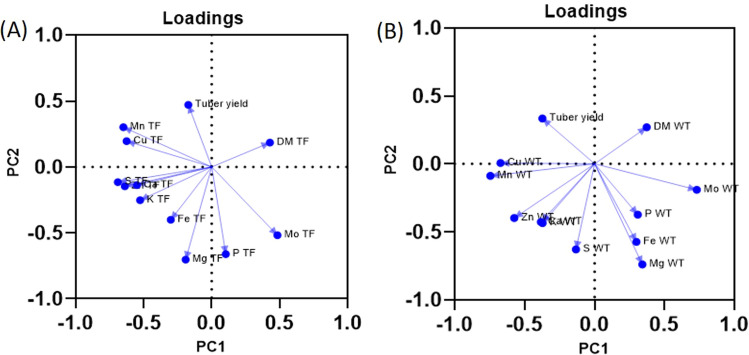
The principal component analysis was performed to achieve partial visualization of the data in a reduced dimension. The outcomes of the nutrients in tuber flesh in 243 potato accessions were estimated using PCA. PC1 explained 23.85% variation and was positively loaded with DM, P and Mo, and the rest of the elements were loaded negatively. PC2 explained 15.52% variation and was positively loaded with tuber yield, DM, Mn and Cu and negatively loaded with Fe, Zn, Ca, Mg, S, P, K and Mo. PC3 and PC4 explained 10.30% and 8.70% variations. On PC1, negatively loaded Zn, Mn, Cu, S and positively loaded Mo were dominant variables, whereas on PC2 negatively loaded Mg, P, Mo and Fe were dominant variables (Fig. 8). In the case of whole tuber samples PC1, PC2 and PC3 explained 22.97%, 18.16% and 10.33% variation, respectively. PC1 was positively loaded with DM, Fe, Mg, P, and Mo and negatively loaded with tuber yield, Zn, Mn, Cu, Ca, S and K. PC2 were positively loaded with all mineral nutrients except Cu. In PC2, tuber yield and DM were two positively loaded variables. Mg, S and Fe were negatively dominating variables on PC2 (Fig. 8). The details of loading of all the nutrients, DM and tuber yield on the first two principal components and the variances explained by every component are presented in the Table S7.
Fig. 8.
Principal component analysis loading plot based on 10 different nutrient concentrations, dry matter content and yield data of 243 tetraploid potato accessions based on two years data. a PCA of nutrient concentrations in tuber flesh (TF). In this, PC1 explains 23.85% variation while PC2 explains 15.52% variation. b PCA of nutrient concentrations in whole tubers (WT). In this, PC1 describes 22.97% variation and PC2 describes 18.16% variation
Conclusions
A huge portion of the global population is suffering from mineral deficiencies especially in the developing countries where people cannot consume a diversified diet or dietary supplements due to monetary issues. Potato is the world’s most consumed non-grain crop thus its biofortification can reduce the mineral deficiencies. The nutrient-rich potato varieties can be developed through traditional or modern breeding methods. However, the availability of potato lines with a better genetic architecture to accumulate the minerals from the soil to the tubers can speed up the potato breeding programs aimed to develop nutrient-rich potato varieties. In the present study, potato germplasm comprises 178 accession from Solanum tuberosum, 26 accessions from Solanum tuberosum ssp. andigena germplasm and 39 popular potato varieties have been studied for 10 minerals concentrations, DM content and yield. Tremendous variations for selected traits were found in this germplasm. The accessions with high levels of nutrients, DM and yield would lead to the addition of value to potato products and can also be used as parental lines to generate biofortified potatoes.
Electronic supplementary material
Below is the link to the electronic supplementary material.
Acknowledgements
This work was financed by the Department of Science and Technology-Science and Engineering Board (DST-SERB) in the form of an externally funded project to Indian Council of Agricultural Research - Central Potato Research Institute (ICAR-CPRI), Shimla, India.
Conflict of interest
The authors declare that they have no conflict of interest.
Footnotes
Publisher’s Note
Springer Nature remains neutral with regard to jurisdictional claims in published maps and institutional affiliations.
References
- Abebe T, Wongchaochant S, Taychasinpitak T, Leelapon O. Variation of mineral concentrations among different potato varieties grown at two distinct locations in Ethiopia. Kasetsart J (Nat Sci) 2012;46(6):837–850. [Google Scholar]
- Allen LH, de Benoist B, Omar D, Hurrell RF (2006) Guidelines on food fortification with micronutrients. 126
- Alsahlany M, Zarka D, Coombs J, Douches DS. Comparison of methods to distinguish diploid and tetraploid potato in applied diploid breeding. Am J Potato Res. 2019;96:244–254. doi: 10.1007/s12230-018-09710-7. [DOI] [Google Scholar]
- Bradshaw JE, Bryan GJ, Ramsay G. Genetic resources (including wild and cultivated Solanum species) and progress in their utilisation in potato breeding. Potato Res. 2006;49:49–65. doi: 10.1007/s11540-006-9002-5. [DOI] [Google Scholar]
- Brown CR, Haynes KG, Moore M, et al. Stability and broad-sense heritability of mineral content in potato: Zinc. Am J Potato Res. 2011;88:238–244. doi: 10.1007/s12230-011-9188-1. [DOI] [Google Scholar]
- Burgos G, Amoros W, Morote M, et al. Iron and zinc concentration of native Andean potato cultivars from a human nutrition perspective. J Sci Food Agric. 2007;87:668–675. doi: 10.1002/jsfa.2765. [DOI] [Google Scholar]
- Dalamu SJ, Sharma V, Dua VK, Kumar V, Singh B. Evaluation of Indian potato germplasm for iron and zinc content. Indian J Plant Genet Resour. 2017;30:232–236. doi: 10.5958/0976-1926.2017.00029.8. [DOI] [Google Scholar]
- Dalamu Sharma J, Kumar S, Luthra SK, Sharma AK, Sharma V, Dua VK. Mineral content of red skinned potatoes of Eastern India. J Hortic Sci. 2019;14:79–82. doi: 10.24154/JHS.2019.v14i01.014. [DOI] [Google Scholar]
- Dutt S, Manjul AS, Raigond P, et al. Key players associated with tuberization in potato: potential candidates for genetic engineering. Crit Rev Biotechnol. 2017;37:942–957. doi: 10.1080/07388551.2016.1274876. [DOI] [PubMed] [Google Scholar]
- FAO, IFAD, UNICEF (2017) WFP W The State of Food Security and Nutrition in the World 2017. Building resilience for peace and food security
- Food and Agriculture Organization of the United Nations (2009) Sustainable potato production- Guidelines for developing Countries
- Hefferon K. Biotechnological approaches for generating zinc-enriched crops to combat malnutrition. Nutrients. 2019;11:253. doi: 10.3390/nu11020253. [DOI] [PMC free article] [PubMed] [Google Scholar]
- IFPRI Hidden hunger: approaches to tackling micronutrient deficiencies. Nourishing millions Stories Chang Nutr. 2016 doi: 10.2499/9780896295889_04. [DOI] [Google Scholar]
- Jongstra R, Mwangi MN, Burgos G, et al. Iron absorption from iron-biofortified sweetpotato is higher than regular sweetpotato in Malawian women while iron absorption from regular and iron-biofortified potatoes is high in peruvian women. J Nutr. 2020 doi: 10.1093/jn/nxaa267. [DOI] [PMC free article] [PubMed] [Google Scholar]
- Kennedy G, Raneri JE, Stoian D et al (2019) Roots, tubers and bananas: contributions to food security. Encyclopedia of Food security and sustainability. Elsevier, pp 231–256. 10.1016/B978-0-08-100596-5.21537-0
- King JC, Brown KH, Gibson RS, et al. Biomarkers of Nutrition for Development (BOND)—Zinc Review. J Nutr. 2016;146:858S–885S. doi: 10.3945/jn.115.220079. [DOI] [PMC free article] [PubMed] [Google Scholar]
- McLean E, Cogswell M, Egli I, et al. Worldwide prevalence of anaemia, WHO Vitamin and Mineral Nutrition Information System, 1993–2005. Public Health Nutr. 2009;12:444–454. doi: 10.1017/S1368980008002401. [DOI] [PubMed] [Google Scholar]
- Mullins E, Milbourne D, Petti C, et al. Potato in the age of biotechnology. Trends Plant Sci. 2006;11:254–260. doi: 10.1016/j.tplants.2006.03.002. [DOI] [PubMed] [Google Scholar]
- Paget M, Amoros W, Salas E, et al. Genetic evaluation of micronutrient traits in diploid potato from a base population of Andean Landrace Cultivars. Crop Sci. 2014;54:1949–1959. doi: 10.2135/cropsci2013.12.0809. [DOI] [Google Scholar]
- Perez-Escamilla R, Bermudez O, Buccini GS, et al. Nutrition disparities and the global burden of malnutrition. BMJ. 2018 doi: 10.1136/bmj.k2252. [DOI] [PMC free article] [PubMed] [Google Scholar]
- Rivero RC, Hernández PS, Rodríguez EMR, et al. Mineral concentrations in cultivars of potatoes. Food Chem. 2003;83:247–253. doi: 10.1016/S0308-8146(03)00087-6. [DOI] [Google Scholar]
- Sharma J, Dalamu, Sharma V, et al. Variations in micronutrient content in tubers of Indian potato varieties. Potato J. 2017;44:101–109. [Google Scholar]
- Singh B, Bhardwaj V, Kaur K, et al. Potato Periderm is the First Layer of Defence against Biotic and Abiotic Stresses: a Review. Potato Res. 2020;64:131–146. doi: 10.1007/s11540-020-09468-8. [DOI] [Google Scholar]
- Singh B, Goutam U, Kukreja S, et al. Potato biofortification: an effective way to fight global hidden hunger. Physiol Mol Biol Plants. 2021;27(10):2297–2313. doi: 10.1007/S12298-021-01081-4. [DOI] [PMC free article] [PubMed] [Google Scholar]
- Singh B, Goutam U, Kukreja S, et al. Biofortification strategies to improve iron concentrations in potato tubers: lessons and future opportunities. Potato Res. 2021 doi: 10.1007/s11540-021-09508-x. [DOI] [Google Scholar]
- Singh B, Sharma J, Bhardwaj V, Sood S, Siddappa S, Goutam U, Dalamu, Kardile H, Dipta B, Pandey NK. Variations in the mineral concentration among different potato (Solanum tuberosum L.) accessions. Potato J. 2021;48(2):99–107. [Google Scholar]
- Singh B, Sharma J, Sood S, et al. Genetic variability for micronutrient content in Andigena potato genotypes. Plant Cell Biotechnol Mol Biol. 2020;21:1–10. [Google Scholar]
- Subramanian NK, White PJ, Broadley MR, Ramsay G. The three-dimensional distribution of minerals in potato tubers. Ann Bot. 2011;107:681–691. doi: 10.1093/aob/mcr009. [DOI] [PMC free article] [PubMed] [Google Scholar]
- Subramanian NK, White PJ, Broadley MR, Ramsay G. Variation in tuber mineral concentrations among accessions of Solanum species held in the Commonwealth Potato Collection. Genet Resour Crop Evol. 2017;64:1927–1935. doi: 10.1007/s10722-016-0483-z. [DOI] [Google Scholar]
- Trapero-Mozos A, Morris WL, Ducreux LJM, et al. Engineering heat tolerance in potato by temperature-dependent expression of a specific allele of HEAT-SHOCK COGNATE 70. Plant Biotechnol J. 2018;16:197–207. doi: 10.1111/pbi.12760. [DOI] [PMC free article] [PubMed] [Google Scholar]
- Vergara Carmona VM, Cecílio Filho AB, de Almeida HJ, Gratão PL. Fortification and bioavailability of zinc in potato. J Sci Food Agric. 2019;99:3525–3529. doi: 10.1002/jsfa.9572. [DOI] [PubMed] [Google Scholar]
- Wakeel A, Farooq M, Bashir K, Ozturk L(2018) Micronutrient malnutrition and biofortification: recent advances and future perspectives. In: Plant micronutrient use efficiency: molecular and genomic perspectives in crop plants. 225–243
- White PJ, Brown PH. Plant nutrition for sustainable development and global health. Ann Bot. 2010;105:1073–1080. doi: 10.1093/aob/mcq085. [DOI] [PMC free article] [PubMed] [Google Scholar]
- Wszelaki AL, Delwiche JF, Walker SD, et al. Sensory quality and mineral and glycoalkaloid concentrations in organically and conventionally grown redskin potatoes (Solanum tuberosum) J Sci Food Agric. 2005;85:720–726. doi: 10.1002/JSFA.2051. [DOI] [Google Scholar]
- USAID OMNI (2005) Micronutrient fact sheet, India. Available online at: http://www.cdc.gov/immpact/micronutrients/
Associated Data
This section collects any data citations, data availability statements, or supplementary materials included in this article.


