Abstract
Presently there is no method available that allows noninvasive and real-time monitoring of fungal susceptibility to antimicrobial compounds. The green fluorescent protein (GFP) of the jellyfish Aequoria victoria was tested as a potential reporter molecule for this purpose. Aureobasidium pullulans was transformed to express cytosolic GFP using the vector pTEFEGFP (A. J. Vanden Wymelenberg, D. Cullen, R. N. Spear, B. Schoenike, and J. H. Andrews, BioTechniques 23:686–690, 1997). The transformed strain Ap1 gfp showed bright fluorescence that was amenable to quantification using fluorescence spectrophotometry. Fluorescence levels in Ap1 gfp blastospore suspensions were directly proportional to the number of viable cells determined by CFU plate counts (r2 > 0.99). The relationship between cell viability and GFP fluorescence was investigated by adding a range of concentrations of each of the biocides sodium hypochlorite and 2-n-octylisothiozolin-3-one (OIT) to suspensions of Ap1 gfp blastospores (pH 5 buffer). These biocides each caused a rapid (<25-min) loss of fluorescence of greater than 90% when used at concentrations of 150 μg of available chlorine ml−1 and 500 μg ml−1, respectively. Further, loss of GFP fluorescence from A. pullulans cells was highly correlated with a decrease in the number of viable cells (r2 > 0.92). Losses of GFP fluorescence and cell viability were highly dependent on external pH; maximum losses of fluorescence and viability occurred at pH 4, while reduction of GFP fluorescence was absent at pH 8.0 and was associated with a lower reduction in viability. When A. pullulans was attached to the surface of plasticized poly(vinylchloride) containing 500 ppm of OIT, fluorescence decreased more slowly than in cell suspensions, with >95% loss of fluorescence after 27 h. This technique should have broad applications in testing the susceptibility of A. pullulans and other fungal species to antimicrobial compounds.
Since the cloning of wild-type green fluorescent protein (GFP) from the jellyfish Aequoria victoria (25), expression of GFP has been demonstrated in numerous organisms, including plants (31), animals (5), bacteria (3), yeasts (7), and filamentous fungi (13, 37). Most applications of GFP have been as a passive label of gene expression and protein localization (for a review, see reference 36). However, GFP and selected mutants are now increasingly used as active sensors of physiological events within cells. In this role, GFP fluorescence is influenced posttranslationally by its chemical environment. For example, the pH sensitivity of GFP has recently been exploited to measure intracellular (16, 18, 27) and organellar (20) pH, and GFP-based systems have been developed to monitor intracellular calcium (21), microviscosity (34), and protease activity (15).
One application of GFP that has not been explored with fungi is its use as an indicator of antimicrobial susceptibility. GFP has several properties that are desirable for this purpose, including simplicity and versatility for in vitro use (9). GFP is intrinsically fluorescent, requiring no cofactors or exogenous substrates. Problems related to cell permeabilization and uptake or retention of product are thus avoided (4, 9). GFP fluorescence also has the advantage that it can be quantitated in situ using a variety of techniques, including fluorescence microscopy, (37), flow cytometry (10), and fluorimetry (3).
The ability to rapidly assess viability is important in the evaluation of susceptibility to antimicrobial compounds. Plate count methods are often used for this purpose but are labor-intensive and require long incubation times. Fluorescence-based assays of cellular viability, such as those based on fluorescein (43) or tetrazolium salt derivatives (28), offer greater sensitivity and ease of use. However, most of these assays rely on the ability of cells to take up or metabolize extracellular fluorogenic compounds and therefore may be limited by permeability of the cell membrane. In bacteria, bioluminescence using luciferase reporter genes provides a sensitive, noninvasive marker of cell viability (33). Bioluminescence can be measured in situ, allowing measurement of cell viability for both planktonic (11) and surface-attached (17) bacteria.
For fungi there are no reports of the use of real-time, noninvasive reporters of cellular viability in the presence of antimicrobial compounds. Such a technique would have broad applications in environmental, industrial, and medical mycology. We are interested in monitoring cell viability in Aureobasidium pullulans because it is the predominant organism causing defacement and biodeterioration of plasticized polyvinylchloride (pPVC) (14, 40). The ability to rapidly assess viability of A. pullulans on pPVC is important in the evaluation of biocides that provide protection against biodeterioration of pPVC. The data presented here demonstrate a strong correlation between GFP fluorescence and cell viability in A. pullulans and suggest that this technique has considerable potential for the rapid and real-time evaluation of fungal susceptibility to antimicrobial compounds.
MATERIALS AND METHODS
A. pullulans (de Bary) Arnaud.
A. pullulans strain PRAFS8 was provided by Avecia Biocides, Manchester, United Kingdom, and was maintained on malt extract agar. To produce blastospores, cultures were grown to mid-log phase in 80 ml of malt extract broth by incubation at 25°C for 18 h with shaking at 200 rpm. A. pullulans blastospore suspensions were prepared in citric acid buffer (pH 5). This buffer was prepared by mixing separate solutions of citric acid (5.3 g liter of deionized water−1) and Na2HPO4 (7.1 g liter of deionized water−1) to the appropriate pH. Blastospores were washed three times by centrifugation at 36,000 × g for 5 min and resuspended in buffer to an optical density at 540 nm of 1.0. For long-term storage, blastospores were frozen at −80°C in a 20% (vol/vol) glycerol solution.
Transformation.
Expression vector pTEFEGFP (37), containing a red-shifted mutant GFP cDNA (pEGFP-1; Clontech) downstream of an A. pullulans translation elongation factor promoter, was introduced into A. pullulans by cotransformation with pAN7-1, a vector conferring hygromycin resistance (26). Protoplasts were prepared and transformed as previously described (39) with 10 μg of both pTEFEGFP and pAN7-1, and transformants were selected on potato dextrose agar (Oxoid) containing 1 M sorbitol and 100 μg of hygromycin B ml−1. Transformants were screened for GFP fluorescence using an Olympus BH-2 epifluorescence microscope equipped with an HBO 100-W mercury arc lamp and a fluorescein isothiocyanate filter set. All transformants exhibiting fluorescence were subcultured onto malt extract agar containing 100 μg of hygromycin B ml−1. Integration of plasmid DNA in transformants was confirmed by Southern analysis (32). To determine if integration of the vector affected the specific growth rate, the transformants and the parental strain were grown in batch culture in 80 ml of malt extract broth at 25°C with shaking at 200 rpm, and the optical density at 600 nm was determined periodically. The specific growth rates were determined during the log phase from the slope of a plot of the natural log of optical density versus time.
Measurement of GFP fluorescence of suspended blastospores.
Suspensions of transformed A. pullulans blastospores were prepared as described above. Aliquots (1 ml) of blastospores were transferred to cuvettes, and GFP fluorescence was quantified using a Hitachi F2000 fluorescence spectrophotometer with excitation at 485 nm and emission at 510 nm. Standard curves of optical density and viable cell number versus fluorescence were prepared by making serial dilutions of transformed blastospores in citrate-phosphate buffer (pH 5). Untransformed A. pullulans blastospores were used as a control. Viable cells were enumerated by plating serial dilutions onto malt extract agar and incubating at 25°C for 3 days. To investigate the reproducibility (interbatch variation) of GFP fluorescence levels, fluorescence measurements were made from blastospore suspensions prepared from five separate cultures and data were subjected to analysis of variance.
Influence of biocides on GFP fluorescence and cell viability of suspended blastospores.
The following biocides were obtained from Avecia Biocides: 2-n-octyl-4-isothiazolin-3-one (OIT), 2,3,5,6-tetrachloro-4-(methylsulfonyl)pyridine (TCMP), 10,10′-oxybisphenoxyarsine (OBPA), N-(trichloromethylthio)phthalimide (NCMP), and n-butyl-1,2-benzisothiazolin-3-one (BBIT). Stock solutions of these biocides were prepared in dimethyl sulfoxide (DMSO) so that the final concentration of DMSO added to blastospore suspensions was 2% (vol/vol). Sodium hypochlorite was obtained from BDH (Darmstadt, Germany) and was added directly to Ap1 gfp cells. Various concentrations of the biocides OIT and sodium hypochlorite were added to 30-ml aliquots of blastospores in 50-ml centrifuge tubes (Falcon). Fluorescence measurements from three replicate tubes were made at various intervals for each biocide concentration, and tubes were shaken throughout using a rotating mixer set at 30 rpm (model SB1; Stuart Scientific, Redhill, United Kingdom). To monitor viable cell numbers during biocide treatment, 10-ml aliquots of blastospore suspensions were treated with either 100 μg of OIT ml−1 or 75 μg of sodium hypocholorite ml−1 for different time periods. At specific time points, fluorescence measurements were made from each tube and cells were immediately washed three times in citrate-phosphate buffer (pH 5) by centrifugation at 3,600 × g prior to plating on malt extract agar for enumeration. With sodium hypochlorite, sodium thiosulfite neutralizer solution was added to suspensions to a final concentration of 1% (wt/vol) before washing. These experiments were replicated on at least two separate occasions. The influence of an additional range of industrial biocides on GFP fluorescence and cell viability was determined at the working concentration at which they are normally incorporated within pPVC. These concentrations were as follows (in micrograms milliliter−1): TCMP, 50; OIT, 500; BBIT, 750; OBPA, 50; and NCMP, 500. For each biocide, GFP fluorescence was monitored over a period of 4 h, after which time cells were washed three times as described above and plated on malt extract agar for enumeration.
Influence of external pH on GFP fluorescence and cell viability of suspended blastospores.
The biocide OIT was used to investigate the influence of external pH on loss of GFP fluorescence and viable cell numbers. Blastospore suspensions were prepared in citrate-phosphate buffer adjusted to pH values in the range of 4 to 8. Aliquots (10 ml) of cells were treated with 100 μg of OIT ml−1 (100 ppm) for 1 h. After this time, fluorescence measurements were made from each of three aliquots and cells were immediately washed three times in buffer at the appropriate pH by centrifugation at 3,600 × g for 5 min. Numbers of viable cells remaining at each pH value were then determined by plating on malt extract agar. GFP fluorescence and CFU counts were compared relative to those of controls without added OIT at each pH value.
Influence of OIT incorporated into pPVC on GFP fluorescence.
The pPVC was formulated as previously described (40) except that OIT was incorporated with the other components to give a final concentration of 500 ppm. Disks 4.5 mm in diameter were punched from the pPVC sheet, washed in 2% (vol/vol) Lipsol detergent, rinsed thoroughly in deionized water, and placed in the bottoms of wells of a 96-well flexible assay plate (Becton Dickinson). For determining loss of fluorescence of A. pullulans attached to pPVC containing OIT, blastospores were prepared as described above and resuspended in citrate-phosphate buffer (pH 5) to a concentration of 1.8 × 10⁶ blastospores ml−1, and 200 μl was placed on the surfaces of the disks. Disks were removed at various time intervals up to 27 h and examined with an Olympus BH-2 epifluorescence microscope equipped with an HBO 100-W mercury arc lamp and a fluorescein isothiocyanate filter set, and images were recorded with a Matrox Rainbow Runner pixel grabber. Images were thresholded to remove cells with a fluorescence intensity of less than 10% of the background, and the number of fluorescent cells was estimated as the percentage of the total area. Two separate fields of view were recorded per disk, and four disks per time point were chosen at random.
RESULTS
Transformation and colony screening.
After incubation for 5 days, five putative transformants growing on hygromycin B-supplemented medium were identified by epifluorescence microscopy. Southern analysis with genomic DNAs derived from two of the transformants (termed Ap1 gfp and Ap2 gfp) and the parental strain confirmed integration of pTEFEGFP (data not shown) at separate locations but at a single site. Both of these transformants showed very bright cytoplasmic fluorescence similar to that described by Vanden Wymelenberg et al. (37). No significant difference (P > 0.001) between the specific growth rates of the untransformed parent and those of AP1 gfp and AP2 gfp (results not shown) was found. Fluorescence spectrophotometry showed that transformant Ap1 gfp had the highest fluorescence levels, and this transformant was selected for biocide susceptibility studies).
GFP fluorescence of suspended blastospores.
GFP fluorescence in Ap1 gfp blastospores was linear with respect to both optical density and viable cell number (r2 > 0.99) (results not shown). Untransformed A. pullulans showed a slight background fluorescence at high cell densities, probably due to scattering of incident light. Significant interbatch variation (P < 0.001) occurred among mean fluorescence values from five separate cultures of blastospores. The individual mean and standard deviation for fluorescence values among the five cultures ranged between 127 ± 1 and 197 ± 5 relative fluorescence units. In order to eliminate this source of variation, each subsequent experiment was completed from a single batch of blastospores.
Influence of biocides on GFP fluorescence of suspended blastospores.
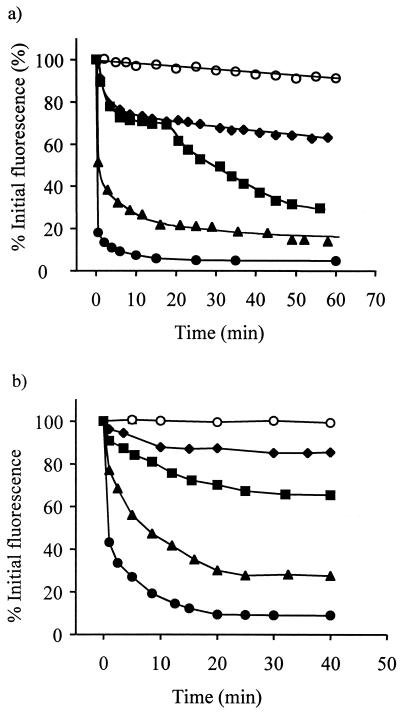
Both of the biocides OIT and sodium hypochlorite caused rapid losses of GFP fluorescence from Ap1 gfp cells in a concentration-dependent manner (Fig. 1). In the presence of 500 μg of OIT ml−1, fluorescence levels fell by 82% in 30 s and then decreased more slowly to reach a plateau at 95% loss of fluorescence by 25 min (Fig. 1a). Interestingly, the influence of 100 μg of OIT ml−1 on fluorescence appeared to be biphasic. During the first 17 min of incubation, fluorescence levels fell by 30% at a rate similar to that observed using 50 μg of OIT ml−1. However, fluorescence levels then fell by a further 40% at an increased rate between 17 min and 1 h of incubation. This biphasic reduction in fluorescence was consistently observed in over five independent experiments. In comparison with results with OIT, incubation with sodium hypochlorite caused similar reductions in fluorescence in the range of 15% (25 μg of available chlorine ml−1) to 90% (150 μg of available chlorine ml−1) after 35 min (Fig. 1b). Measurements of the effects of both biocides on GFP fluorescence were repeated on at least three separate occasions with similar results.
FIG. 1.
Influence of the biocides OIT and sodium hypochlorite on GFP fluorescence in Ap1 gfp blastospores. (a) OIT at concentrations of 0 (○), 50 (♦), 100 (▪), 350 (▴), and 500 (●) μg ml−1. (b) Sodium hypochlorite at concentrations of 0 (○), 25 (⧫), 50 (▪), 75(▴), and 125 (●) μg of available chlorine ml−1. Each point represents the mean of three replicate measurements ± standard error of the mean. (Errors were within the heights of the symbols.)
Correlation between GFP fluorescence and cell viability.
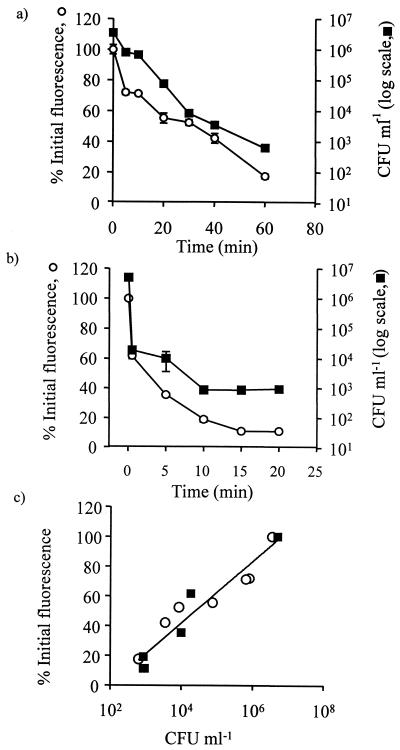
To determine whether loss of GFP fluorescence correlated with a reduction in the number of viable cells, fluorescence measurements and CFU counts were made at intervals after the addition of each of the biocides OIT and sodium hypochlorite at 100 μg of OIT ml−1 and 75 μg of available chlorine ml−1, respectively (Fig. 2). With OIT, logarithmic decreases in the number of viable cells paralleled the loss of GFP fluorescence, and CFU counts fell from 3.5 × 10⁶ to 6.3 × 10² CFU ml−1 in 1 h (Fig. 2a). Sodium hypochlorite caused a rapid decrease in viability from 5 × 10⁶ to 1.8 × 10⁴ CFU ml−1 by 30 s, and this mirrored the large reduction in GFP fluorescence of 38% that also occurred within 30 s (Fig. 2b). With sodium hypochlorite, decreasing CFU counts reached a plateau at 9.2 × 10² CFU ml−1 after 10 min, while GFP fluorescence continued to decrease slowly after this time and reached a plateau of 11% relative fluorescence after 20 min (Fig. 2b). The data for both biocides showed a strong linear correlation (r2 = 0.93) between loss of GFP fluorescence and logarithmic decreases in CFU viable counts (Fig. 2c). Measurements of GFP fluorescence loss and cell viability were made on two separate occasions for each biocide with similar results.
FIG. 2.
Influence of the biocides OIT and hypochlorite on loss of GFP fluorescence and cell viability in Ap1 gfp blastospores. (a) Influence of 100 μg of OIT ml−1. (b) Influence of 75 μg of hypochlorite ml−1. (c) Correlation between GFP fluorescence and numbers of viable cells during treatment with OIT (○) and sodium hypochlorite (▪). Each point represents the mean of three replicate measurements ± standard error of the mean. (Errors not shown were within the heights of the symbols.)
Influence of external pH on fluorescence and cell viability.
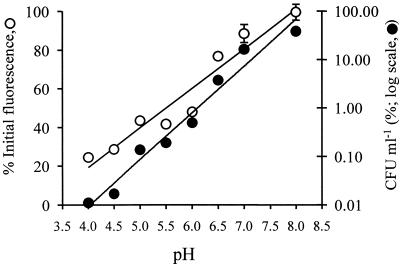
Losses of both fluorescence and cell viability in the presence of OIT were highly dependent on the pH of the suspension buffer (Fig. 3). Loss of GFP fluorescence was greatest under acidic conditions. The maximum reduction of 73% occurred at pH 4, while no significant loss of fluorescence (P > 0.001) occurred under alkaline conditions at pH 8. Fluorescence levels remaining after treatment with OIT for 1 h increased in a linear manner between pH 4 and 8. Loss of cell viability was also greatest at acidic pH values, with >99.98% loss of viability at pH 4, while 39% of cells remained viable at pH 8. There was a linear log-log relationship between external pH and viable cell numbers remaining after incubation with OIT for 1 h. In the absence of OIT, neither the intensity of GFP fluorescence nor cell viability was significantly affected between pH 4 and 8 (P > 0.001) (results not shown).
FIG. 3.
Influence of external pH on percent loss of GFP fluorescence and viability of Ap1 gfp cells after treatment with 100 μg of OIT ml−1 for 1 h. Each point represents the mean of three replicate measurements ± standard error of the mean. (Errors not shown were within the heights of the symbols.)
Comparison of a range of biocides at concentrations normally used.
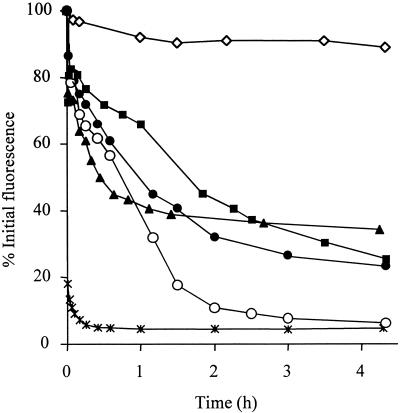
The kinetics of GFP fluorescence loss in the presence of five broad-spectrum biocides commonly incorporated within pPVC is shown in Fig. 4. All of the biocides caused greater than 60% loss of fluorescence after 4 h and caused 100% loss of viability within this period. OIT and BBIT caused a complete reduction of fluorescence to baseline levels. Fluorescence levels of cells incubated with DMSO without biocide fell to 90% after 4 h, and 90% of cells (5.4 × 10⁶ CFU ml−1) remained viable after this period.
FIG. 4.
Influence of a range of biocides on GFP fluorescence in Ap1 gfp blastospores. Blastospores were exposed to the concentrations of biocide normally incorporated within pPVC: NCMP, 500 μg ml−1 (▪); OBPA, 50 μg ml−1 (▴); TCMP, 50 μg ml−1 (●); BBIT, 750 μg ml−1 (○); OIT, 500 μg ml−1 (✳); no biocide, 2% DMSO (◊). Each point represents the mean of three replicate measurements ± standard error of the mean. (Errors were within the heights of the symbols.)
Influence of OIT incorporated into pPVC on GFP fluorescence.
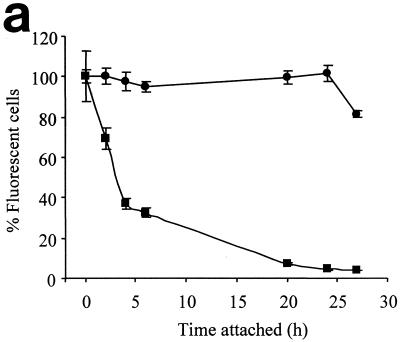
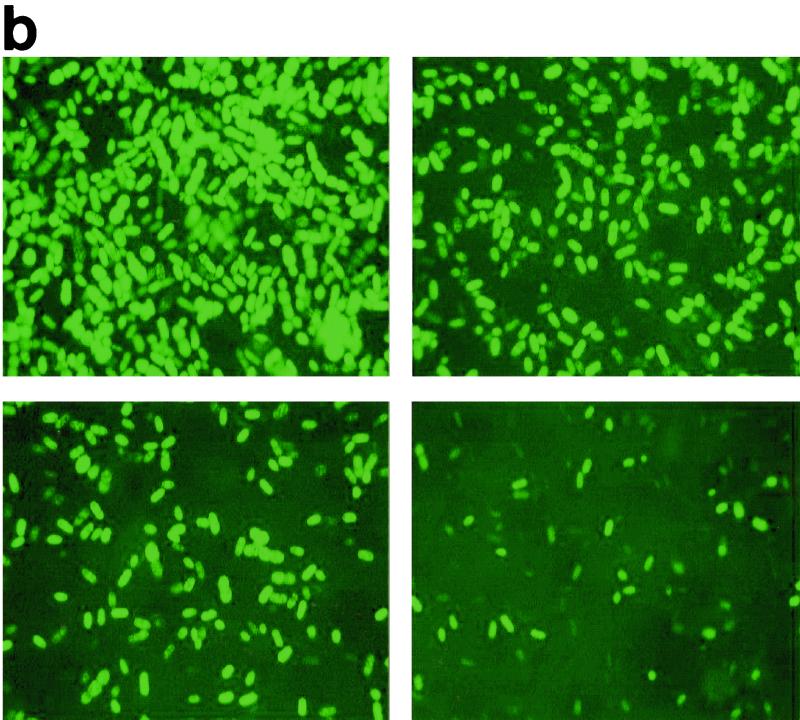
Loss of fluorescence from blastospores of AP1 gfp attached to the surface of pPVC containing 500 ppm of OIT was examined over a period of 27 h. The kinetics of loss of fluorescence by surface-attached cells was most rapid over the first 5 h, at which point ca. 70% of cells had lost fluorescence. The percentage of fluorescent cells continued to decline until >95% of cells had lost fluorescence after 27 h (Fig. 5).
FIG. 5.
Effect of incorporation of 500 ppm of OIT into pPVC on surface-attached AP1 gfp spores. (a) Percentages of fluorescent cells on pPVC (●) and pPVC with 500 ppm of OIT incorporated (▪). Each point represents the mean of five replicate measurements ± standard error of the mean. (b) Fluorescent images taken after 0 h (top left), 2 h (top right), 6 h (bottom left), and 27 h (bottom right).
DISCUSSION
This study is the first to demonstrate that GFP fluorescence may be used as a real-time, noninvasive indicator of fungal susceptibility to antimicrobial agents. In bacteria, GFP fluorescence has been shown to be rapidly reduced in the presence of a number of biocides (3, 19). Casey and Nguyen (3) observed a correlation between loss of GFP fluorescence and loss of cell viability in Escherichia coli, and they suggested that the technique was useful as a rapid screen for antimicrobial compounds. However, no detailed explanation for the loss of GFP fluorescence was provided. Further, because of the inherent stability of GFP, this approach was thought by Collins et al. (6) to risk falsely equating GFP fluorescence and viability, potentially leading to some active compounds being overlooked.
Recently, GFP has become established as a sensitive and accurate indicator of intracellular pH (18, 20, 27). Intracellular pH is considered to be one of the most important factors in fungal physiology. Intracellular pH regulates the key enzymes in glycolysis and gluconeogenesis (16, 23) and is thought to regulate other cell responses, including the induction of heat shock proteins (41). In Neurospora crassa, cytosolic acidification to pH 6.5 using propionic acid resulted in complete inhibition of growth (24), and several studies have correlated intracellular pH with fungal cell viability (16, 38). We propose that the observed correlation between GFP fluorescence and cell viability in this study results from the sensitivity of GFP to intracellular pH.
Intracellular pH is regulated by the essential fungal plasma membrane proton pump H+-ATPase (29, 30) and has itself been suggested to be a potential target for development of novel antifungal agents (22). Inhibition of H+-ATPase causes rapid depolarization of the plasma membrane, followed by intracellular acidification and cell death (2, 12). Biocide killing and loss of intracellular pH control will result from either a direct inhibition of H+-ATPase, indirect loss of H+-ATPase activity through inhibition of respiration or other essential cell processes, or damage to the cell membrane and modification of cell permeability. Fungistatic compounds that inhibit growth but do not interfere with intracellular pH regulation (1) would not be expected to cause fluorescence loss in this system, and the fungistatic triazole drug itraconazole caused only low levels of fluorescence loss (<20%) from Ap1 gfp cells (data not shown). Loss of GFP fluorescence due to leaking of GFP to the external medium resulting from loss of membrane integrity or cell lysis or due to protease degradation of the GFP chromophore is unlikely, since microscopic observation of Ap1 gfp cells showed that neither sodium hypochlorite nor OIT caused cell lysis. Moreover, loss of GFP fluorescence caused by OIT or sodium hypochlorite was almost completely reversible when cells were washed and resuspended in pH 7 buffer, although cell viability was not restored (data not shown), indicating that the chromophore remained intact in the cytosol. Loss of GFP fluorescence and cell viability was found to be highly dependent on the pH of the external medium. If intracellular pH regulation is inhibited, then it follows that lower external pH values will cause greater intracellular acidification and thus greater loss of fluorescence and viability. However, the activity of many biocides is also dependent on pH. For example, the active entity of sodium hypochlorite is undissociated hypochlorous acid, which is more abundant at low pH values (35). Therefore, we chose to use OIT to investigate the effect of external pH on loss of fluorescence and cell viability, as OIT does not possess ionizable groups that would be influenced by pH.
The measurement of GFP fluorescence described in this study proved to be a rapid and simple procedure for monitoring viability in Ap1 gfp cells in the presence of biocides. These data suggest that GFP fluorescence at low external pH will prove useful for screening potential fungicidal agents and compounds that inhibit intracellular pH regulation. This technique also has considerable potential as a simple and economic alternative to the use of fluorescent dyes for estimating cell viability. Another obvious advantage of using GFP is that it can be used to quantify biocide susceptibility in real time and with spatial resolution in situ using a fluorescence microscope. This allows studies of the efficacy of biocides incorporated within substrata to be studied directly without the necessity for the removal of attached microorganisms. In this study, the rate of cell death for 500 ppm of OIT was considerably lower when the OIT was incorporated into the pPVC than when cells where exposed in suspension. The time taken for a loss of 50% of fluorescence was <1 min for suspended cells but ca. 4 h for attached cells. This may indicate differences between the physiologies of cells in suspension and cells attached to a surface. Such a phenomenon has been widely reported for bacteria and is frequently associated with an increase in resistance to antibacterial agents (8, 42). Alternatively, the mobility and rate of leaching of the biocide may mean that a lower concentration of biocide is presented at the surface than when the biocide is in suspension. Nonetheless, the reduced rate of kill of the incorporated biocide emphasizes the importance of testing the efficacies of such biocides in situ.
ACKNOWLEDGMENTS
This work was supported by studentships supported by the BBSRC, the Central European University, and the Foreign Commonwealth Office in collaboration with Avecia Ltd., United Kingdom.
REFERENCES
- 1.Baldwin B C, Wiggins T E. Action of fungicidal triazoles of the dichlorobutrazol series on Ustilago maydis. Pesticide Sci. 1984;15:156–166. [Google Scholar]
- 2.Ben-Josef A M, Manavathu E K, Platt D, Sobel J D. Proton translocating ATPase mediated fungicidal activity of a novel complex carbohydrate: CAN-296. Int J Antimicrob Agents. 2000;13:287–295. doi: 10.1016/s0924-8579(99)00140-5. [DOI] [PubMed] [Google Scholar]
- 3.Casey W M, Nguyen N T. Use of the green fluorescent protein to rapidly assess viability of Escherichia coli in preserved solutions. PDA J Pharm Sci Technol. 1995;50:352–355. [PubMed] [Google Scholar]
- 4.Chalfie M, Tu Y, Euskirchen G, Ward W W, Prasher D C. Green fluorescent protein as a marker for gene expression. Science. 1994;263:802–805. doi: 10.1126/science.8303295. [DOI] [PubMed] [Google Scholar]
- 5.Cheng L, Fu J, Tsukamoto A, Hawley R G. Use of green fluorescent protein variants to monitor gene transfer and expression in mammalian cells. Nat Biotechnol. 1996;14:606–609. doi: 10.1038/nbt0596-606. [DOI] [PubMed] [Google Scholar]
- 6.Collins L A, Torrero M N, Franzblau S G. Green fluorescent protein reporter microplate assay for high-throughput screening of compounds against Mycobacterium tuberculosis. Antimicrob Agents Chemother. 1998;42:344–347. doi: 10.1128/aac.42.2.344. [DOI] [PMC free article] [PubMed] [Google Scholar]
- 7.Cormack B P, Bertram G, Egerton M, Gow N A R, Falkow S, Brown A J P. Yeast-enhanced green fluorescent protein (yEGFP): a reporter of gene expression in Candida albicans. Microbiology. 1997;143:303–311. doi: 10.1099/00221287-143-2-303. [DOI] [PubMed] [Google Scholar]
- 8.Costerton J W, Stewart P S, Greenberg E P. Bacterial biofilms: a common cause of persistent infections. Science. 1999;284:1318–1322. doi: 10.1126/science.284.5418.1318. [DOI] [PubMed] [Google Scholar]
- 9.Cubitt A B, Heim R, Adams S R, Boyd A E, Gross L A, Tsien R Y. Understanding, improving and using green fluorescent proteins. Trends Biochem Sci. 1995;20:448–455. doi: 10.1016/s0968-0004(00)89099-4. [DOI] [PubMed] [Google Scholar]
- 10.Dhandayuthapani S L, Via E, Thomas C A, Horowitz P M, Deretic D, Deretic V. Green fluorescent protein as a marker for gene expression and cell biology of mycobacterial interactions with macrophages. Mol Microbiol. 1995;17:901–912. doi: 10.1111/j.1365-2958.1995.mmi_17050901.x. [DOI] [PubMed] [Google Scholar]
- 11.Duncan S, Glover L A, Killham K, Prosser J I. Luminescence-based detection of activity of starved and viable but nonculturable bacteria. Appl Environ Microbiol. 1994;60:1308–1316. doi: 10.1128/aem.60.4.1308-1316.1994. [DOI] [PMC free article] [PubMed] [Google Scholar]
- 12.Ermolayeva E, Sanders D. Mechanism of pyrithione-induced membrane depolarization in Neurospora crassa. Appl Environ Microbiol. 1995;61:3385–3390. doi: 10.1128/aem.61.9.3385-3390.1995. [DOI] [PMC free article] [PubMed] [Google Scholar]
- 13.Gordon C L, Khalaj V, Ram A F J, Archer D B, Brookman J L, Trinci A P J, Jeenes D J, Doonan J H, Wells B, Punt P J, van den Hondel C A M J J, Robson G D. Glucoamylase::green fluorescent protein fusions to monitor protein secretion in Aspergillus niger. Microbiology. 2000;146:415–426. doi: 10.1099/00221287-146-2-415. [DOI] [PubMed] [Google Scholar]
- 14.Hamilton N F. Biodeterioration of flexible polyvinyl chloride films by fungal organisms. In: Oxley T A, Barry S, editors. Biodeterioration 5. Chichester, United Kingdom: John Wiley & Sons Ltd.; 1983. pp. 663–678. [Google Scholar]
- 15.Heim R, Tsien R Y. Engineering green fluorescent protein for improved brightness, longer wavelengths and fluorescence resonance energy transfer. Curr Biol. 1996;6:176–182. doi: 10.1016/s0960-9822(02)00450-5. [DOI] [PubMed] [Google Scholar]
- 16.Imai T, Ohno T. The relationship between viability and intracellular pH in the yeast Saccharomyces cerevisiae. Appl Environ Microbiol. 1995;42:344–347. doi: 10.1128/aem.61.10.3604-3608.1995. [DOI] [PMC free article] [PubMed] [Google Scholar]
- 17.Kerr C J, Jones C R, Hillier V F, Robson G D, Osborn K S, Handley P S. Statistical evaluation of a newly modified Robbins device using a bioluminescent pseudomonad to quantify adhesion to plastic. Biofouling. 1999;14:267–278. [Google Scholar]
- 18.Kneen M, Farinas J, Li Y, Verkman A S. Green fluorescent protein as a non-invasive intracellular pH indicator. Biophys J. 1998;74:1591–1599. doi: 10.1016/S0006-3495(98)77870-1. [DOI] [PMC free article] [PubMed] [Google Scholar]
- 19.Kremer L, Baulard A, Estaquier J, Poulain-Godefroy O, Locht C. Green fluorescent protein as a new expression marker in mycobacteria. Mol Microbiol. 1995;17:913–922. doi: 10.1111/j.1365-2958.1995.mmi_17050913.x. [DOI] [PubMed] [Google Scholar]
- 20.Llopis J, McCaffery J M, Miyawaki A, Farquhar M G, Tsien R Y. Measurement of cytosolic, mitochondrial and Golgi pH in single living cells with green fluorescent proteins. Proc Natl Acad Sci USA. 1998;95:6803–6808. doi: 10.1073/pnas.95.12.6803. [DOI] [PMC free article] [PubMed] [Google Scholar]
- 21.Miyawaki A, Lloopis J, Heim R, McCaffery J M, Adams J A, Ikura M, Tsien R Y. Fluorescent indicators for Ca2+ based on green fluorescent proteins and calmodulin. Nature. 1997;388:882–887. doi: 10.1038/42264. [DOI] [PubMed] [Google Scholar]
- 22.Monk B C, Perlin D S. Fungal plasma membrane proton pumps as promising new antifungal targets. Crit Rev Microbiol. 1994;20:209–223. doi: 10.3109/10408419409114555. [DOI] [PubMed] [Google Scholar]
- 23.Noshiro A, Purwin C, Laux M, Nicolay K, Scheffers W A, Holzer H. Mechanism of stimulation of endogenous fermentation in yeast by carbonyl cyanide m-chlorophenylhydrazone. J Biol Chem. 1987;262:14154–14157. [PubMed] [Google Scholar]
- 24.Parton R M, Fischer S, Malhó R, Papasouliotis O, Jelitto T C, Leonard T, Read N D. Pronounced cytoplasmic gradients are not required for tip growth in plant and fungal cells. J Cell Sci. 1997;110:1187–1198. doi: 10.1242/jcs.110.10.1187. [DOI] [PubMed] [Google Scholar]
- 25.Prasher D C, Eckenrode V K, Ward W W, Prendergast F G, Cormier M J. Primary structure of the Aequoria victoria green fluorescent protein. Gene. 1992;111:229–233. doi: 10.1016/0378-1119(92)90691-h. [DOI] [PubMed] [Google Scholar]
- 26.Punt P J, Oliver R P, Dingemanse M A, Pouwels P H, van den Hondel C A M J J. Transformation of Aspergillus based on the hygromycin B resistance marker from Escherichia coli. Gene. 1987;56:117–124. doi: 10.1016/0378-1119(87)90164-8. [DOI] [PubMed] [Google Scholar]
- 27.Robey R B, Ruiz O, Santos A V P, Ma J, Kear F, Wang L, Li C, Bernardo A A, Arruda J A L. pH-dependent fluorescence of a heterologously expressed Aequoria green fluorescent protein mutant: in situ spectral characteristics and applicability to intracellular pH estimation. Biochemistry. 1998;37:9894–9901. doi: 10.1021/bi980857x. [DOI] [PubMed] [Google Scholar]
- 28.Rodriguez G G, Phipps D, Ishiguro K, Ridgway H F. Use of a fluorescent redox probe for direct visualization of actively respiring bacteria. Appl Environ Microbiol. 1992;58:1801–1808. doi: 10.1128/aem.58.6.1801-1808.1992. [DOI] [PMC free article] [PubMed] [Google Scholar]
- 29.Serrano R M. Structure and function of a proton translocating ATPase in the plasma membranes of plants and fungi. Biochim Biophys Acta. 1988;947:1–28. doi: 10.1016/0304-4157(88)90017-2. [DOI] [PubMed] [Google Scholar]
- 30.Serrano R, Kielland-Brandt M C, Fink J R. Yeast plasma membrane ATPase is essential for growth and has homology with (Na+ + K+), K+- and Ca2+-ATPase. Nature. 1986;319:689–693. doi: 10.1038/319689a0. [DOI] [PubMed] [Google Scholar]
- 31.Sheen J, Hwang S, Niwa Y, Kobayaski H, Galbraith D W. Green-fluorescent protein as a new vital marker in plant cells. Plant J. 1995;8:777–784. doi: 10.1046/j.1365-313x.1995.08050777.x. [DOI] [PubMed] [Google Scholar]
- 32.Southern E M. Detection of specific sequences among DNA fragments separated by gel electrophoresis. J Mol Biol. 1975;98:503–517. doi: 10.1016/s0022-2836(75)80083-0. [DOI] [PubMed] [Google Scholar]
- 33.Stewart G S A B, Williams P. lux genes and the applications of bacterial bioluminescence. J Gen Microbiol. 1992;138:1289–1300. doi: 10.1099/00221287-138-7-1289. [DOI] [PubMed] [Google Scholar]
- 34.Swaminathan R, Hoang C P, Verkman A S. Photobleaching recovery and anisotropy decay of green fluorescent protein GFP-S65T in solution and in cells: cytoplasmic viscosity probed by green fluorescent protein translational and rotational diffusion. Biophys J. 1997;72:1900–1907. doi: 10.1016/S0006-3495(97)78835-0. [DOI] [PMC free article] [PubMed] [Google Scholar]
- 35.Trueman J R. The halogens. In: Hugo W B, editor. Inhibition and destruction of the microbial cell. London, England: Academic Press; 1971. pp. 138–183. [Google Scholar]
- 36.Tsien R Y. The green fluorescent protein. Annu Rev Biochem. 1998;67:509–544. doi: 10.1146/annurev.biochem.67.1.509. [DOI] [PubMed] [Google Scholar]
- 37.Vanden Wymelenberg A J, Cullen D, Spear R N, Schoenike B, Andrews J H. Expression of green fluorescent protein in Aureobasidium pullulans and quantification of the fungus on leaf surfaces. BioTechniques. 1997;23:686–690. doi: 10.2144/97234st01. [DOI] [PubMed] [Google Scholar]
- 38.Viegas C A, Almieda P F, Cavaco M, SaCorreia I. The H+-ATPase in the plasma membrane of Saccharomyces cerevisiae is activated during growth latency in octanoic acid-supplemented medium accompanying the decrease in intracellular pH and cell viability. Appl Environ Microbiol. 1998;64:779–783. doi: 10.1128/aem.64.2.779-783.1998. [DOI] [PMC free article] [PubMed] [Google Scholar]
- 39.Wang J, Holden D W, Leong S A. Gene transfer system for the phytopathogenic fungus Ustilago maydis. Proc Natl Acad Sci USA. 1988;85:865–869. doi: 10.1073/pnas.85.3.865. [DOI] [PMC free article] [PubMed] [Google Scholar]
- 40.Webb J S, Nixon M, Eastwood I M, Greenhalgh M, Robson G D, Handley P S. Fungal colonization and biodeterioration of plasticized polyvinyl chloride. Appl Environ Microbiol. 2001;66:3014–3200. doi: 10.1128/aem.66.8.3194-3200.2000. [DOI] [PMC free article] [PubMed] [Google Scholar]
- 41.Weitzel G, Pilatus U, Rensing L. The cytoplasmic pH, ATP content and total protein synthesis rate during heat-shock protein inducing treatments in yeast. Exp Cell Res. 1987;170:64–79. doi: 10.1016/0014-4827(87)90117-0. [DOI] [PubMed] [Google Scholar]
- 42.Xu K D, McFeters G A, Stewart P S. Biofilm resistance to antimicrobial agents. Microbiology. 2000;146:547–549. doi: 10.1099/00221287-146-3-547. [DOI] [PubMed] [Google Scholar]
- 43.Yang H, Nemoto Y, Homma T, Matsuoka H, Yamada S, Sumita O, Takatori K, Kurata H. Rapid viability assessment of spores of several fungi by an ionic intensified fluorescein diacetate method. Curr Microbiol. 1995;30:173–176. [Google Scholar]


