This cross-sectional study evaluates potential anomalies in semiautomated endothelial cell–density measurements in a cohort of corneal donor eyes.
Key Points
Question
Is there an anomaly in semiautomated endothelial cell–density measurements in a large cohort of corneal donor eyes?
Findings
In this cross-sectional study of 48 207 donated eyes, a discrepancy was demonstrated in endothelial cell density at 2500 cells/mm2 confirmed by bayesian change point analysis.
Meaning
The semiautomated cell counting technique in this cohort may have inherent bias warranting further study.
Abstract
Importance
Endothelial cell density in corneal donor eyes remains a critical component in selecting tissue suitable for corneal transplant.
Objective
To describe an anomaly in endothelial cell density discovered in a large cohort of corneal donor eyes.
Design, Setting, and Participants
Donor information for this cross-sectional study was obtained from the CorneaGen eye bank for donors from June 1, 2012, to June 30, 2016. Endothelial cell density was reported by eye bank technicians for each eye. The retrospective donor data set included donor demographics, endothelial cell count, time of death, medical and surgical history, and suitability for transplant. The donor data set contained information on donated eyes over the 4-year period.
Main Outcomes and Measures
Endothelial cell–density heat map, 2-dimensional binned plots, and bayesian change point analysis.
Results
A total of 48 207 donated eyes were evaluated. Mean (SD) cell count was 2717 (448) cells/mm2, and mean (SD) donor age was 58 (13) years. Heat maps using 2-dimensional binned plots demonstrated accentuated endothelial cell density results particularly at and immediately above 2500 cells/mm2 with a small gap right under this figure. A bayesian change point analysis revealed a change point at exactly this location as well.
Conclusions and Relevance
Data from this cross-sectional study suggest a discontinuity in endothelial cell–density measurements just below 2500 cells/mm2. This anomaly suggests that the semiautomated counting technique used in this cohort preferentially skipped over measurements just below this cutoff. Whether this represents an automation error, or more likely, a subjective human bias, requires further study.
Introduction
Endothelial cell density has long played a key role in determining corneal graft suitability for transplant. The mainstay for the measurement of endothelial cell density remains contact or noncontact specular microscopy. Leibowitz and colleagues demonstrated the in vivo use of the specular microscope in human eyes, leading to modern-day instruments with semiautomated image capture and morphological analysis.1,2
A variety of analysis methods can be used to determine the endothelial cell density from specular images, including frame methods, corner method, or center-to-center method. In each method, a subjective human component plays a critical role in defining characteristics such as cell borders, cell size, cell centers, and image magnification, thereby altering the resultant calculated cell density.2 The Cornea Donor Study (CDS) examined the accuracy of eye bank measurements in their data set and found most eye bank measurements fell within 10% of an established study reading center with image quality contributing to variability.3 The more recent Cornea Preservation Time Study (CPTS) also compared endothelial cell–density measurements between eye banks and a central reading center, finding measurements to be similar but with high variability between individual measurements.4
We recently examined a large cohort of corneal donor eyes, describing the association of various systemic and demographic characteristics with corneal transplant suitability and endothelial cell density.5,6,7 While examining this cohort, we discovered an apparent anomaly in the endothelial cell–density measurements suggestive of a systematic bias in the semiautomated method used. In this cross-sectional study, we examined the endothelial cell–density measurements in a large cohort of corneal donor eyes to evaluate and confirm this anomaly and propose possible sources of this discrepancy.
Methods
This cross-sectional study was exempted for nonhuman participant research by the institutional review board at the University of Maryland, Baltimore, and followed the Strengthening the Reporting of Observational Studies in Epidemiology (STROBE) reporting guidelines.8 A deidentified data set containing information on all donated eyes from June 1, 2012, to June 30, 2016, was provided by the CorneaGen eye bank in Seattle, Washington. Details regarding the identical data set have been reported previously.7 Briefly, variables included age, sex, and race (Asian, Black, Caucasian, Hispanic, Middle Eastern, Native American, and other) of the donor, date and time of death, date and time of body refrigeration, date and time of preservation, endothelial cell density (using the variable frame method), lens status, approved tissue outcome, reason tissue was not suitable for transplant (if applicable), and past medical and surgical history of the donor. As previously reported, to minimize variability among screening technicians, CorneaGen uses extensive training in which each technician reviews several hundred corneas with a trainer to ensure that they are making the correct grading standards as well as undergoing regular training competencies and using photograph and video standards.
Statistical Analysis
The statistical analysis packages RStudio, version 1.4.1106, and R, version 4.0.5 (R Foundation), were used for analysis. Donors missing endothelial cell density were excluded. To visually examine the endothelial cell–density data for any gaps and given that the large data set would result in a dense plot, we first developed a continuous decimal number variable to evenly spread out the data. We used time of death given as the percentage of minutes on the day of death (ie, [the hour of death × 60 + the minute of death] / 1440). We then generated a scatter plot of the endothelial cell density vs this variable.
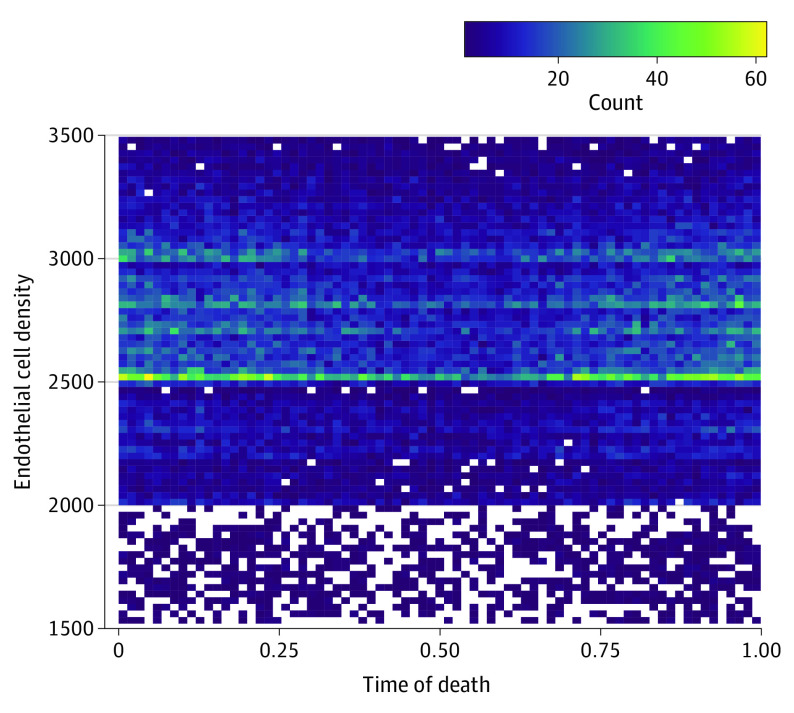
To further visualize data clumping, we used the geom_bind2d function to create a heat map by dividing the data into rectangles, with the color of each determined by the number of data points within that rectangle. We set the bins to 75 and limited the y-axis from 1500 to 3500 cells/mm2 to focus in on the relevant data area. Finally, to determine if and where a change point existed in the endothelial cell–density data and establish a discontinuity, we used the bayesian change point package to apply a Markov chain Monte Carlo (MCMC) sampling approach. The burn-in was set to 1000, p0 to 0.008, and the MCMC set to 10 000.
Results
The deidentified eye bank data set contained information on 48 207 donated eyes. After excluding eyes missing endothelial cell density, the data set contained data on 44 479 donated eyes. The mean (SD) donor age was 58 (13) years, and the mean (SD) endothelial cell density was 2717 (448) cells/mm2.
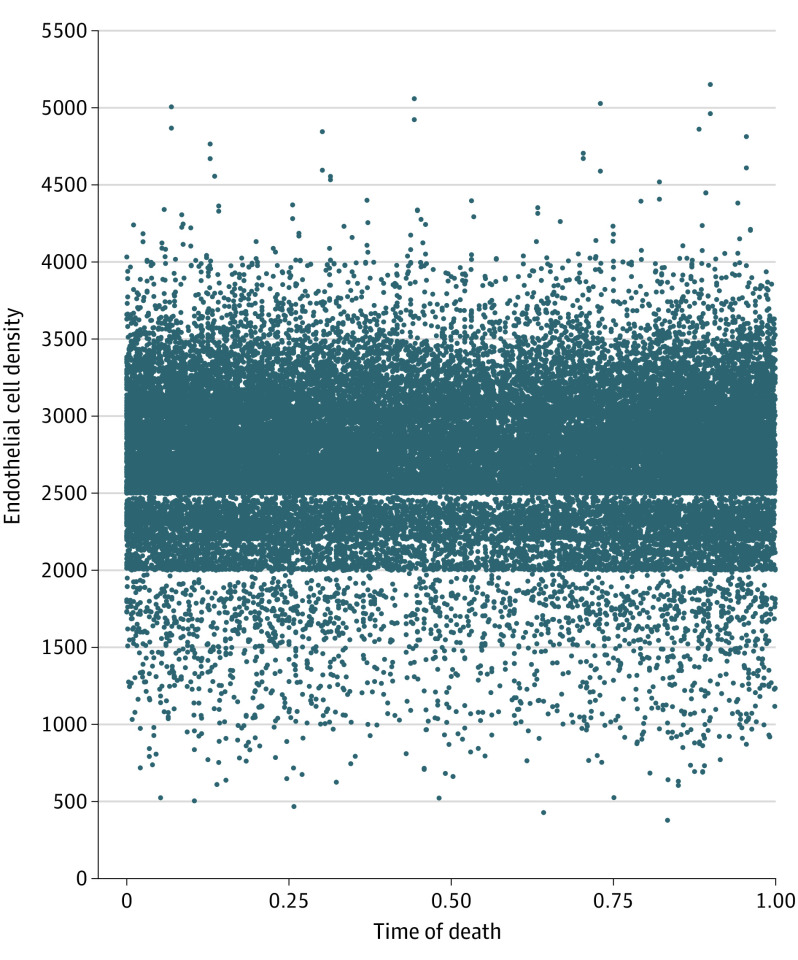
The initial plot of endothelial cell density vs time of death is demonstrated in Figure 1. A discontinuity is clearly distinguishable at 2500 cells/mm2, whereas a plateau appears at 2000 cells/mm2 as well. The resultant heat map (Figure 2) further highlights these areas, with brightening along the 2500-cells/mm2 line, and a drop-off below 2000 cells mm2.
Figure 1. Scatterplot of Endothelial Cell Density vs Time of Death .
Time of death is represented as a ratio of minute of the day of death over 1440 minutes for a full day. Anomalous missing data is demonstrated under 2500 cells/mm2.
Figure 2. Heat Map of Endothelial Cell Density vs Time of Death.
The heat map highlights significant clustering at 2500 cells/mm2, along with less prominent bands between 2500 and 3000 cells/mm2, with a drop-off under 2000 cells/mm2.
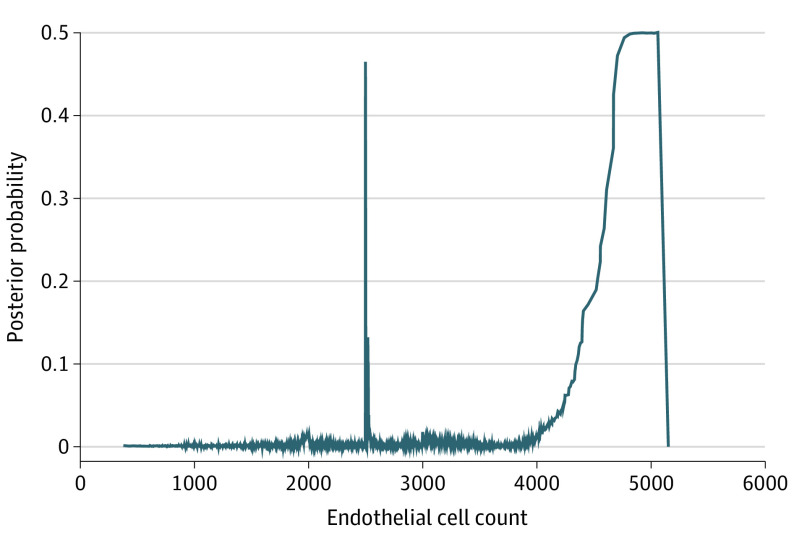
The bayesian change point analysis produced posterior probabilities of change for each endothelial cell count value (Figure 3). A sharp peak in posterior probability occurred at 2500 cells/ mm2.
Figure 3. Posterior Probabilities Determined by Bayesian Change Point Analysis.
A prominent spike is noted at 2500 cells/mm2. The spike after 4000 cells/mm2 represents sparse data.
Discussion
In this cross-sectional study, we demonstrated a discontinuity in endothelial cell–density measurement at 2500 cells/mm2 in a large cohort of corneal donor eyes. We demonstrated via 2-dimensional heat map a clustering of measurements at this point. Interestingly, the heat map also demonstrated bands between 2500 and 3000 cells/mm2 as well as a drop-off below 2000 cells/mm2. However, bayesian change point analysis confirmed with high probability only a true discontinuity at 2500 cells/mm2. We believe that the large cohort of corneal donor eyes enabled the unmasking of this anomaly, which otherwise would not have been perceptible.
The source of an anomaly in a semiautomated process can occur in 2 ways: (1) an algorithmic discrepancy on the automated side or (2) via systemic error or bias on the human side. In this case, we do not believe that the algorithms used in specular microscopy have a particular weakness at 2500 cells/mm2 as mathematically, this postulate does not have a clear basis. More likely, this represents a systematic bias by the observers to nudge measurements above the 2500-cells/mm2 cutoff by being overly permissive when counting cells or highlighting cell borders.
A number of theories could account for this bias. Endothelial abnormalities are one of the most common reasons for failed cornea-transplant screening following rigorous donor tissue analysis after corneal donor procurement. In 2021, a total of 46 982 of the 126 623 tissue recoveries in the US were not distributed for keratoplasty.9 However, as shown in the CDS, preoperative endothelial cell density alone is a poor predictor for endothelial graft failure.10 Further, both CDS and CPTS used lower cutoffs than 2500 cells/mm2; thus, avoidance of screening failure likely would not justify such a bias.
However, the CDS and CPTS studies themselves demonstrate that surgeon bias is a key factor in tissue acceptance. These studies set out to demonstrably show that donor age and preservation time were less important to corneal transplant success than cornea surgeons had historically thought. What is not clear, however, is how influential endothelial cell density remains in cornea surgeons’ minds when they accept tissue for corneal transplant.
Strengths and Limitations
We believe that without such a large cohort of corneal donor eyes, this subtle anomaly may be imperceptible. However, the data being sourced from only 1 eye bank may not make the findings generalizable without further investigation. This study was likewise limited by the lack of surgeon-preference criteria, which may have bolstered the conclusion that surgeon factors contributed heavily to this finding.
Conclusions
Data from this cross-sectional study suggest a discontinuity in endothelial cell density measurements just below 2500 cells/mm2. We postulate that there may be a subtle bias to nudge endothelial cell density above 2500 cells/ mm2—whether consciously or subconsciously—to influence cornea surgeon tissue acceptance rate, which may be responsible for the anomaly in this study. Although we show a clear discordance in endothelial cell density in this large cohort, the true source of this anomaly requires further investigation.
References
- 1.Laing RA, Sandstrom MM, Leibowitz HM. In vivo photomicrography of the corneal endothelium. Arch Ophthalmol. 1975;93(2):143-145. doi: 10.1001/archopht.1975.01010020149013 [DOI] [PubMed] [Google Scholar]
- 2.McCarey BE, Edelhauser HF, Lynn MJ. Review of corneal endothelial specular microscopy for FDA clinical trials of refractive procedures, surgical devices, and new intraocular drugs and solutions. Cornea. 2008;27(1):1-16. doi: 10.1097/ICO.0b013e31815892da [DOI] [PMC free article] [PubMed] [Google Scholar]
- 3.Lass JH, Gal RL, Ruedy KJ, et al. ; Cornea Donor Study Group . An evaluation of image quality and accuracy of eye bank measurement of donor cornea endothelial cell density in the Specular Microscopy Ancillary Study. Ophthalmology. 2005;112(3):431-440. doi: 10.1016/j.ophtha.2004.10.045 [DOI] [PubMed] [Google Scholar]
- 4.Benetz BA, Stoeger CG, Patel SV, et al. ; Cornea Preservation Time Study Group . Comparison of donor cornea endothelial cell density determined by eye banks and by a central reading center in the Cornea Preservation Time Study. Cornea. 2019;38(4):426-432. doi: 10.1097/ICO.0000000000001846 [DOI] [PMC free article] [PubMed] [Google Scholar]
- 5.Margo JA, Munir WM, Brown CH, Hoover CK. Association between endothelial cell density and transplant suitability of corneal tissue with type 1 and type 2 diabetes. JAMA Ophthalmol. 2017;135(2):124-130. doi: 10.1001/jamaophthalmol.2016.5095 [DOI] [PubMed] [Google Scholar]
- 6.McGlumphy EJ, Margo JA, Haidara M, Brown CH, Hoover CK, Munir WM. Predictive value of corneal donor demographics on endothelial cell density. Cornea. 2018;37(9):1159-1162. doi: 10.1097/ICO.0000000000001664 [DOI] [PubMed] [Google Scholar]
- 7.Munir WM, Brown CH, Munir SZ, Hoover CK. Effect of body refrigeration time on cornea donor tissue. Cornea. 2021;40(12):1590-1593. doi: 10.1097/ICO.0000000000002665 [DOI] [PubMed] [Google Scholar]
- 8.von Elm E, Altman DG, Egger M, Pocock SJ, Gøtzsche PC, Vandenbroucke JP; STROBE Initiative . The Strengthening the Reporting of Observational Studies in Epidemiology (STROBE) statement: guidelines for reporting observational studies. Ann Intern Med. 2007;147(8):573-577. doi: 10.7326/0003-4819-147-8-200710160-00010 [DOI] [PubMed] [Google Scholar]
- 9.Eye Bank Association of America . Statistical report. Accessed April 8, 2022. https://restoresight.org/statistical-report/
- 10.Lass JH, Sugar A, Benetz BA, et al. ; Cornea Donor Study Investigator Group . Endothelial cell density to predict endothelial graft failure after penetrating keratoplasty. Arch Ophthalmol. 2010;128(1):63-69. doi: 10.1001/archophthalmol.2010.128.63 [DOI] [PMC free article] [PubMed] [Google Scholar]


