

Abstract
Objective:
Cochlear implant (CI) candidacy and post-operative outcomes are assessed using sets of speech perception tests that vary from center to center, limiting comparisons across institutions and time periods. The objective of this study was to determine if scores on one speech perception test could be reliably predicted from scores on another test.
Study Design:
AzBio Sentence Test, Consonant-nucleus-consonant Word (CNCw), and Hearing in Noise Test (HINT) scores in quiet for the implanted ear, were collected for individuals who received a CI between 1985–2019. Scores collected during the same testing session were analyzed using Bland-Altman plots to assess agreement between testing methods. Simple linear regression with logit-transformation was used to generate predictive functions and 95% confidence intervals for expected mean and individual scores.
Setting:
Single academic medical center.
Patients:
1,437 individuals with a median age of 59.9 years (range 18–95 years) and 46% (654/1,437) male.
Interventions:
N.A.
Main Outcome Measures:
Agreement as a function of test score, mean, variance, and correlation coefficients.
Results:
2,052 AzBio/CNCw, 525 AzBio/HINT, and 7,187 CNCw/HINT same-session score pairings were identified. Pair-wise test comparisons demonstrated limited agreement between different tests performed in the same session and score correlation between different speech tests revealed large variances.
Conclusions:
Transformation functions between test batteries were predictive of mean scores but performed poorly for prediction of individual scores. Point-wise comparisons of scores across CI test batteries should be used with caution in clinical and research settings.
Keywords: cochlear implantation, speech discrimination, word recognition score, AzBio, CNC, HINT
Introduction
Cochlear implantation (CI) can restore hearing in individuals with moderate-to-profound sensorineural hearing loss (SNHL) who do not benefit from traditional amplification (1). Approximately 1.2 million adults in the United States (US) and 50 million worldwide meet candidacy criteria for cochlear implantation (2–4). CI candidacy and post-implantation performance can be determined through a number of audiological tests designed to measure speech comprehension (5). However, speech perception testing has been performed with many (>20) different tests, each used with varying frequency across time and institutions (5). In the US, the use of speech tests for the evaluation of CI candidacy has evolved from Hearing in Noise Test (HINT) to Consonant-Nucleus-Consonant word list (CNCw) and Arizona Biomedical sentences (AzBio) tests in the more recent era (6–8). This shift has occurred as FDA candidacy criteria have expanded and CI outcomes have improved, necessitating more difficult speech perception tests that avoid the ceiling effect that may occur with HINT (9–12).
The extent to which scores yielded from one test (e.g. HINT) are correlated or demonstrate agreement to those from a different test (e.g. AzBio or CNCw), on an individual patient basis, has not been well studied. Understanding the relationship between audiological outcomes on different test modalities is critical for effectively evaluating CI performance and pooling of data across time periods and institutions, with important implications for both the clinical care of CI patients and research related to CI outcomes. Although several previous studies have investigated methods of speech perception score conversion, those studies analyzed predicted group mean speech perception scores rather than the predictability of individual scores across test batteries (13,14). The expected variability or variance of individual test scores can have significant implications on the extent to which scores from one test protocol (e.g. AzBio, CNCw, HINT) can converted to expected scores on another test.
Using a large single institution cohort with >1400 patients and same-session pairs of speech performance tests, we sought to analyze the extent to which AzBio, CNCw, and HINT speech performance scores can be inter-converted on a per-patient basis.
Methods
Institutional review board approval (IRB00188251) was obtained for this study. A retrospective analysis was performed for all patients who were ≥18 years of age and received a CI at a single academic medical center (Johns Hopkins) between the years 1985–2019. Demographic and clinical characteristics, and speech testing scores during CI candidacy evaluation and post-implant testing were extracted and compiled in a database. Consistent with the evolution of CI testing practices, HINT and CNCw were the primary modalities used for pre- and post-implant testing between 1985–2012, and AzBio from 2012-present. Only testing sessions where at least two testing modalities were used (e.g. AzBio/CNCw, AzBio/HINT, or CNCw/HINT) during the same visit were included for study. Both pre-implant testing in the best aided condition for evaluation of CI candidacy and post-implant testing for evaluation of CI performance were included for study. In cases of bilateral implantation, only audiologic data for the first-implanted ear was analyzed. Patients who underwent revision CI were not excluded. All audiologic testing was performed by a CI audiologist as part of routine CI care and the specific speech performance test(s) were selected/used at the discretion of the testing audiologist. Different tests within each testing session were performed by the same audiologist. Testing stimuli were presented at 60–70 dB SPL in quiet to the implant ear. Scores obtained under binaural conditions were excluded.
Stata statistical software version 17 (College Station, TX) was used for data analysis. Bland-Altman plots (15,16) were used to investigate agreement between test modalities. To investigate whether specific variables impacted the observed variance between scores, subgroup analyses were performed based on age at implantation (<60 vs ≥60 years old), acoustic (pre-operative) versus CI hearing (post-operative) at time of testing, and time since implantation (<1 vs ≥1 year).
Simple linear regression was used to generate predictive functions between scores for each set of test modalities (AzBio vs CNCw, AzBio vs HINT, and CNCw vs HINT). The dependent variable of the regression model was first converted from percent correct score into proportion and logit-transformed before modeling. Because 0 (or 0%) and 1 (or 100%) are undefined for a logit-transformation, they were recoded as 0.0001 (or 0.01%) and 0.9999 (99.99%), respectively for the dependent variable. Inverse logit-transformation of the predicted mean from the regression model formed the predicted score in the scale of proportion, which was then converted back to the scale of percent correct. The 95% confidence intervals for both the predicted mean and overall range of scores (±2 SD) were derived according to the regression analysis results, and similarly converted back to the percent correct scale.
Results
1,437 individuals were identified who received a CI between 1985–2019 and had eligible audiologic data. Demographic and clinical characteristics of this patient cohort are shown in Table 1. Over the course of their care, the median number of speech performance tests per patient was 15 (range 2–30) and the median interval between surgery and post-operative testing was 2.3 years (range 0.1–27 years). Two individuals (0.01%) received a CI between the years 1985–1990, 38 (3%) between 1991–1995, 150 (10%) between 1996–2000, 307 (21%) between 2001–2005, 408 (28%) between 2006–2010, 356 (25%) between 2011–2015, and 176 (12%) between 2016–2019. Same-session AzBio/CNCw scores were available for 2,052 visits, AzBio/HINT for 525 visits, and CNCw/HINT for 7,187 visits.
Table 1.
Demographics of patient cohort.
| Variable | n (%) | |
|---|---|---|
| median (range) | ||
| Number of subjects | 1437 | |
| Male | 654 (46%) | |
| Age at implant | 59.9 years (18–95) | |
| Race | ||
| White | 1238 (86%) | |
| Black | 114 (8%) | |
| Asian | 30 (2%) | |
| Other | 55 (4%) | |
| Numbers of tests per patient | 15 (2–30) | |
| Interval between surgery and test for post-operative tests | 2.3 years (0.1–27) | |
| Year of implant | ||
| 1985–1990 | 2 (0.1%) | |
| 1991–1995 | 38 (3%) | |
| 1996–2000 | 150 (10%) | |
| 2001–2005 | 307 (21%) | |
| 2006–2010 | 408 (28%) | |
| 2011–2015 | 356 (25%) | |
| 2016–2019 | 176 (12%) |
To examine whether there were systematic differences between the pairs of scores across different audiometric performance ranges we assessed test-pairs using Bland-Altman plots (Figure 1). Bland-Altman plots are a visual tool to analyze the agreement between two measurements by using the mean and standard deviations between the measurements (15). The Bland-Altman plot is constructed as an XY scatter plot where the X axis represents the average of the two measures ((A+B)/2) and the Y axis shows the difference between the two measures (A-B). Horizontal lines are also plotted ±2 standard deviations from the mean difference between measurements, which indicates the limits of agreement as suggested by Bland and Altman(15) and also represents the 95% confidence interval. Using Bland-Altman plot analysis, systematic bias was found between scores on each test pair. CNCw was the most difficult test and AzBio scores were on average 13% higher than CNCw scores (Figure 1A). HINT scores were 14% higher than AzBio (Figure 1B) and 24% higher than CNCw scores (Figure 1C). Limits of agreement between test pairs, indicated by ± two standard deviations from the mean of the difference between scores, were found to be scores of 33, 34, and 37% for AzBio/CNCw, AzBio/HINT, and CNCw/HINT, respectively. That is, for a patient score of 50% on CNCw, the predicted “equivalent” AzBio score is likely to range from 17–83% (50±33%). For each pair of tests, agreement was best at either ends of the performance range and most variable at the mid-range.
Figure 1.
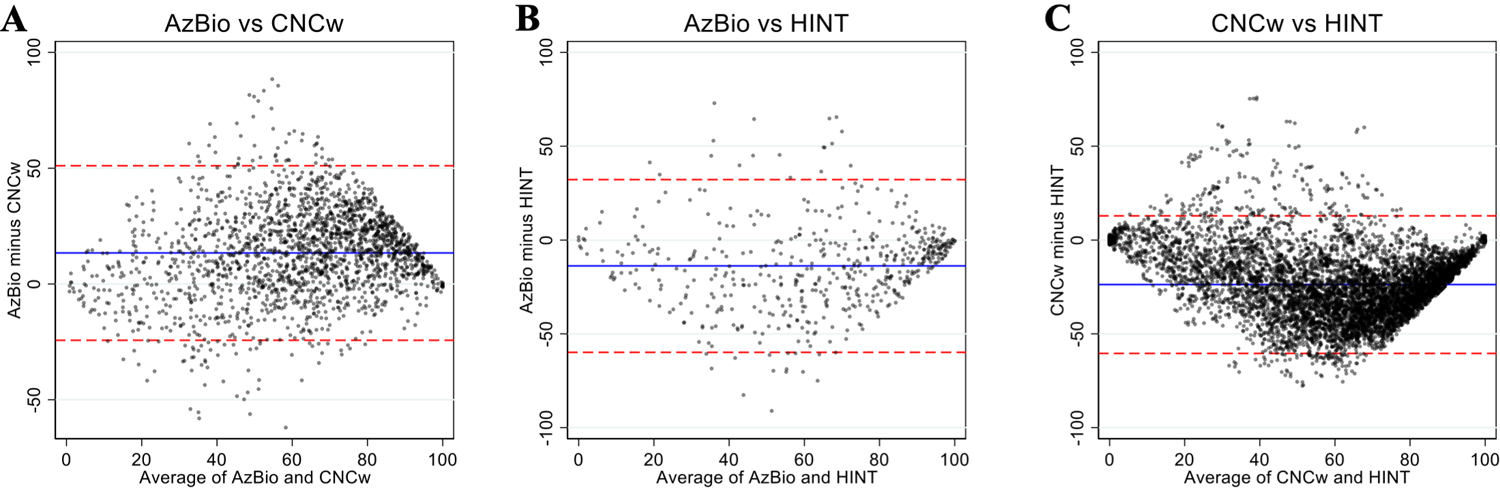
Bland-Altman plots for each pair of speech recognition scores (A: AzBio vs CNCw; B: AzBio vs HINT; C: CNCw vs HINT). Mean values are represented by the blue lines and limits of agreement for each test pair are represented by red dashed lines (95% confidence interval or ±2 SD). Dots are ‘jittered’ to make all observations visible.
Given the lack of score agreement between test modalities, we performed subgroup analysis to explore if any patient-specific variables impacted testing score correlation or agreement. Patient age at implantation (>60 vs ≥60 years old; Figure 2), acoustic (pre-operative) versus CI hearing (post-operative) at the time of testing (Figure 3), and time since implantation (<1 vs ≥1 year; Figure 4) did not substantially impact mean bias or the limits of agreement in each test pair. Since these sub-group variables did not influence score agreement, they were not used when analyzing score correlation and generating predictive functions.
Figure 2.
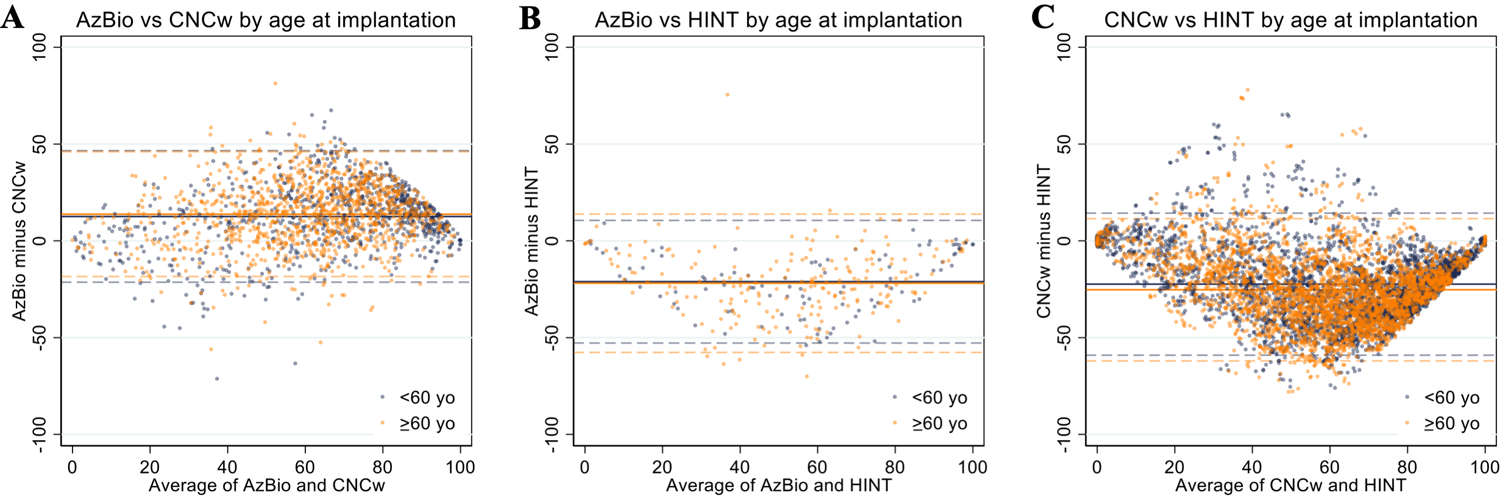
Bland-Altman plots of AzBio/CNCw (A), AzBio/HINT (B), and CNCw/HINT (C) scores stratified by age at implantation (<60 yo vs ≥60 yo). Mean values are represented by the solid lines and limits of agreement for each test pair are represented by dashed lines (95% confidence interval or ±2 SD).
Figure 3.
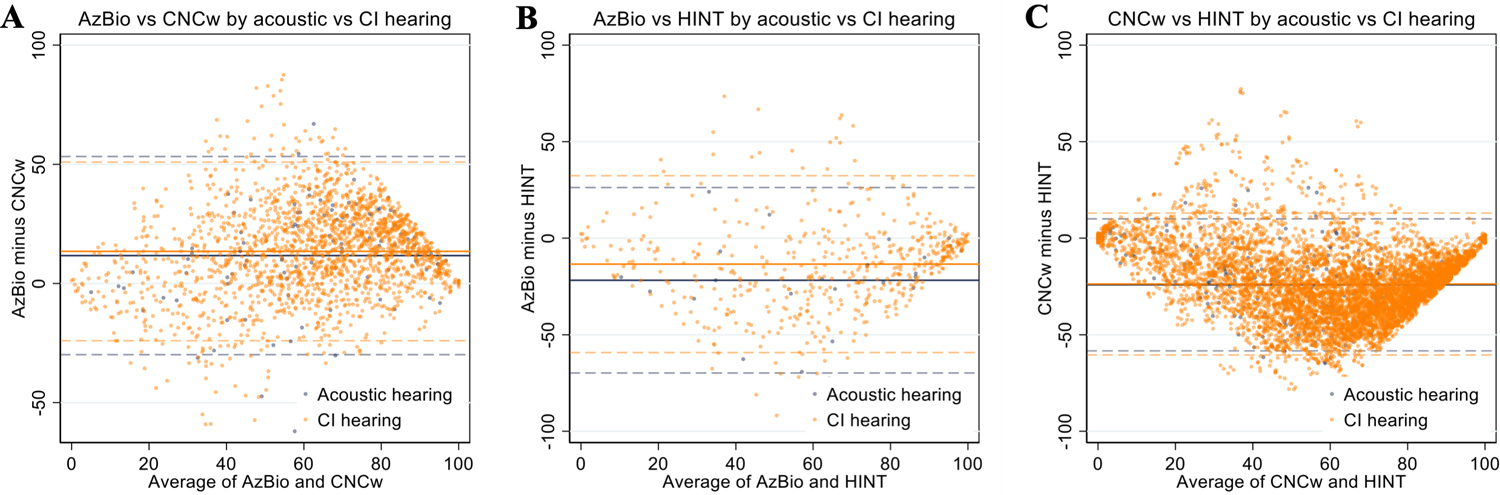
Bland-Altman plots of AzBio/CNCw (A), AzBio/HINT (B), and CNCw/HINT (C) scores stratified by acoustic (pre-operative) versus CI hearing (post-operative). Mean values are represented by the solid lines and limits of agreement for each test pair are represented by dashed lines (95% confidence interval or ±2 SD).
Figure 4.

Bland-Altman plots of post-operative AzBio/CNCw (A), AzBio/HINT (B), and CNCw/HINT (C) scores stratified by time since implantation (<1 year vs ≥1 year). Mean values are represented by the solid lines and limits of agreement for each test pair are represented by dashed lines (95% confidence interval or ±2 SD).
Figure 5 shows correlations between same-session scores obtained on different test modalities, yielding predictive functions as listed in Table 2, which describe the correlation between test pairs and allows the scores obtained on one test to be transformed to an expected score on another. To evaluate the uncertainty associated with these predictive functions, we quantified both the 95% confidence interval of the expected group mean (blue), and the individual expected scores (red) from conversion based upon the regression model. For an individual with CNCw scores of 10, 50, or 90%, the expected AzBio scores (95% confidence interval of expected scores) are 15% (0–88%), 72% (7–99%), or 97% (47–100%), respectively (Figure 5A). For HINT scores of 10, 50, or 90%, the expected AzBio scores are 5% (0–72%), 31% (1–94%), or 81% (8–100%)(Figure 5B) and the expected CNCw scores are 4% (0–40%), 22% (2–78%), or 65% (11–96%)(Figure 5C), respectively.
Figure 5.
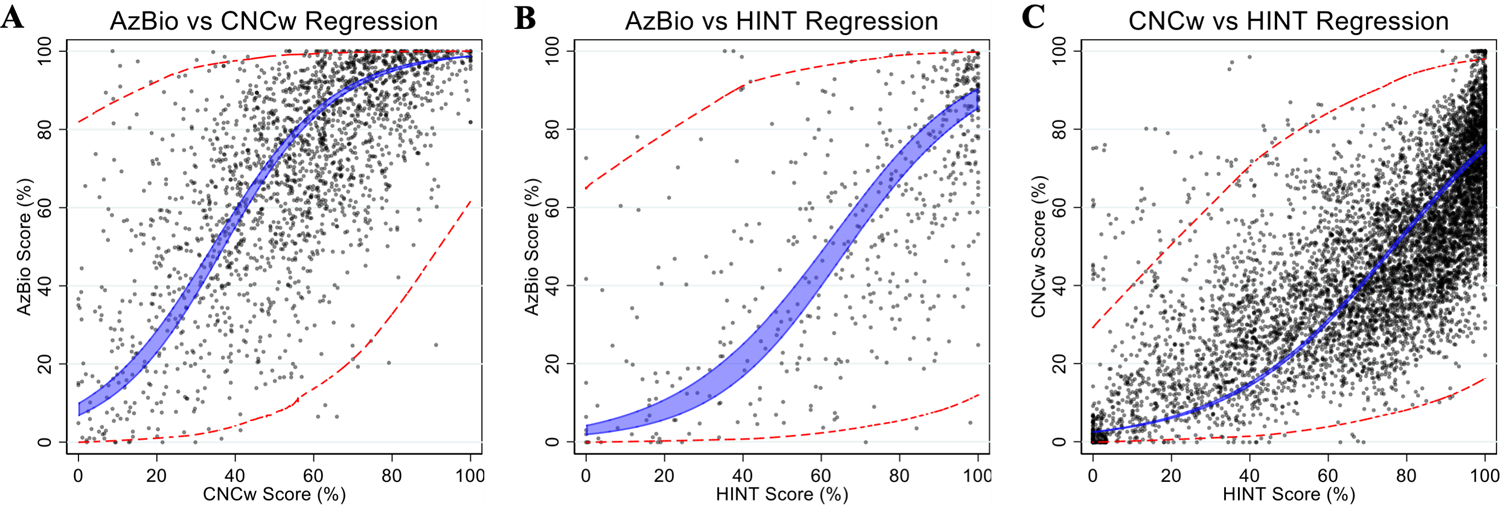
Pair-wise comparison of individual speech perception scores obtained on same-day testing between differential modalities of speech perception tests (A: AzBio vs CNCw; B: AzBio vs HINT; C: CNCw vs HINT). The blue shaded area represents the 95% confidence interval for the correlation of best fit for the group mean. The red dashed lines represent the expected ranges (95% confidence interval or ±2 SD) for the individual expected scores.
Table 2.
Predictive functions and coefficients of determination (R2) for score conversion between AzBio, CNCw, and HINT.
| Predictive Function | Coefficient of determination - R2 |
|---|---|
| 0.4 | |
| 0.4 | |
| 0.5 |
Discussion
Testing methodologies used to evaluate CI candidacy and performance have evolved over time, and institutional practices are not homogenous, so we sought to investigate whether individual test scores obtained on one CI speech perception test protocol may be predictably and accurately converted to expected scores on an alternative test. Direct comparability of scores between test modalities would facilitate both clinical care of CI patients and research related to CI outcomes by overcoming heterogeneity in test methods developed over time and across institutions. Using a large dataset that allowed direct comparison of speech scores generated using different test methods administered on the same day by the same audiologist, we derived inter-test predictive functions (Table 2) and found that while the tests correlated with each other, there was high variance in individual test scores and poor agreement across tests (Figure 1).
Relationships between different speech performance scores have been investigated by several previous authors. Vickers et al. (14) used arcsine transformation to convert Bamford, Kowal, and Bench (BKB) sentence test and Arthur Boothroyd (AB) word scores amongst a cohort of 71 patients. The authors found that BKB and AB scores correlated (R2=0.51) and the score variability between different testing methodologies were similar to our study. A more recent study by Sharma et al. (13) used linear regression to convert AzBio and CNCw scores amongst a cohort of 383 patients and found that linear regression offered good reliability for score conversion because the average absolute difference between observed and imputed individual scores was 10.5% (95% CI=9.8–11.2). However, our analysis suggests that this range is likely to be variable across the spectrum of audiologic performance.
The tendencies to rely on mean scores in inter-test conversion and to use correlation to indicate inter-test agreement likely underlie the divergent conclusions between previous studies and the present one. While positive correlations and narrow confidence intervals of the predicted group means were also found in the present study, the utility of these predictions is reduced by the wide confidence intervals for individual test scores. That is, although predictive functions may be effective at predicting mean population-level scores between test methods, they do not reliably make accurate predictions of scores on an individual patient basis due to large variances in individual patient scores when compared across different tests, even during the same testing session. Consistent with the large observed variance in score-pairs, when the agreement between different testing protocols is specifically examined, the limits of agreements between each test pair are so large (Figure 2) that score conversion could not be performed with an acceptable degree of precision for clinical or research purposes.
The analyses performed here also illustrate interesting features of various CI speech perception testing modalities. The narrower width of the confidence intervals near scores of 0 or 100 (Figure 5) demonstrate that inter-test score conversion is non-linear, reflecting ceiling and floor effects of each test. Bland-Altman plots (Figure 1) demonstrate that the lack of agreement between test pairs, evidenced by large limits of agreement for each test pair, are due to both test-dependent biases and large variances in individual scores. Consistent with test-dependent biases that are well-recognized in CI speech perception testing (10,18,19), our analyses show that patients systematically score the lowest on CNCw, then AzBio, and the highest on HINT.
Research on speech perception testing has also demonstrated that thresholds of clinical significance – the difference in speech perception scores that represents a difference considered clinically important – varies across the score scale, with the largest thresholds for clinical significance in the middle of the scale (20,21). This phenomenon concords with the larger variances similarly observed in the middle ranges of each scale and may suggest that significant difference levels underlie at least part of the observed variances in individual scores.
Parallel to the large body of existent literature on factors that may underlie large variance in speech perception and CI outcomes (22–27), we also sought to identify whether specific demographic or clinical variables may underlie the large variance in inter-test score differences. We hypothesized that patient age, testing in acoustic vs CI ears, and duration of implant use could affect score differences between test pairs (Figures 2–4). However, we found that stratifying by each of those variables did not significantly impact the observed variance in score difference between each test-pair.
Due to limitations of the retrospective database used in this study, other variables that may impact score differences on speech perception testing, such as duration of deafness, prelingual vs post-lingual onset of deafness, and etiology of deafness could not be reliably examined and therefore were not included in the analysis. Device specifics were also excluded from study. Further, although subgroup analyses did not demonstrate that stratification reduced observed variance, it is possible that a multivariable regression that accounts for further demographic variables may reduce this variability. As this study encompassed a large population of CI candidates and recipients over almost three decades, heterogeneity due to evolution of hardware, software, programming strategies, and surgical technique all may impact the observed variance in inter-test score differences (1,28). However, such heterogeneity is also reflective of real-world CI care and research where speech perception data may be pooled across time and location. Finally, this study investigated point-wise comparisons in scores between test-pairs. It is possible that patient-level score trajectories between test-pairs may demonstrate less variance and serve as a more precise basis for score mapping between speech perception tests.
Despite these limitations, this study adds to the current literature by describing relationships between three commonly used speech perception instruments in a large patient cohort and analyzing the variability in score difference between these tests. It extends previous studies by demonstrating that despite positive correlations between different testing methods, large variances exist in test scores when comparing across test protocols and that they pose serious challenges for directly converting scores obtained on one speech perception test to an expected score on another. While consistent differences in scores across different testing methods may be accounted for when converting scores, the large amount of variance in scores for same-session test-pairs renders the application of any derived correlation for predictive purposes problematic and difficult. Therefore, caution should be exercised when attempting to convert single-session speech perception scores in both preoperative CI candidacy evaluations and postoperative speech perception testing.
Funding Sources:
This study was supported in-part by funding from the National Institutes of Health (T32DC000027 to NSA).
Footnotes
Disclosure Statement: None.
References
- 1.Carlson ML. Cochlear Implantation in Adults. N Engl J Med 2020;382:1531–42. [DOI] [PubMed] [Google Scholar]
- 2.Sorkin DL, Buchman CA. Cochlear Implant Access in Six Developed Countries. Otol Neurotol 2016;37:e161–4. [DOI] [PubMed] [Google Scholar]
- 3.Goman AM, Lin FR. Prevalence of Hearing Loss by Severity in the United States. Am J Public Health 2016;106:1820–2. [DOI] [PMC free article] [PubMed] [Google Scholar]
- 4.WHO World Report on Hearing 2021. https://www.who.int/teams/noncommunicable-diseases/sensory-functions-disability-and-rehabilitation/highlighting-priorities-for-ear-and-hearing-care. Accessed October 10, 2021.
- 5.Vila PM, Hullar TE, Buchman CA et al. Analysis of Outcome Domains in Adult Cochlear Implantation: A Systematic Review. Otolaryngol Head Neck Surg 2016;155:238–45. [DOI] [PMC free article] [PubMed] [Google Scholar]
- 6.PETERSON GE, LEHISTE I. Revised CNC lists for auditory tests. J Speech Hear Disord 1962;27:62–70. [DOI] [PubMed] [Google Scholar]
- 7.Nilsson M, Soli SD, Sullivan JA. Development of the Hearing in Noise Test for the measurement of speech reception thresholds in quiet and in noise. J Acoust Soc Am 1994;95:1085–99. [DOI] [PubMed] [Google Scholar]
- 8.Spahr AJ, Dorman MF, Litvak LM et al. Development and validation of the AzBio sentence lists. Ear Hear 2012;33:112–7. [DOI] [PMC free article] [PubMed] [Google Scholar]
- 9.Available at: http://www.auditorypotential.com/MSTBfiles/MSTBManual2011-06-20%20.pdf. Accessed December 5, 2021.
- 10.Gifford RH, Shallop JK, Peterson AM. Speech recognition materials and ceiling effects: considerations for cochlear implant programs. Audiol Neurootol 2008;13:193–205. [DOI] [PubMed] [Google Scholar]
- 11.Gifford RH, Dorman MF, Shallop JK et al. Evidence for the expansion of adult cochlear implant candidacy. Ear Hear 2010;31:186–94. [DOI] [PMC free article] [PubMed] [Google Scholar]
- 12.Prentiss S, Snapp H, Zwolan T. Audiology Practices in the Preoperative Evaluation and Management of Adult Cochlear Implant Candidates. JAMA Otolaryngol Head Neck Surg 2020;146:136–42. [DOI] [PMC free article] [PubMed] [Google Scholar]
- 13.Sharma RK, Chen SY, Grisel J et al. Assessing Cochlear Implant Performance in Older Adults Using a Single, Universal Outcome Measure Created With Imputation in HERMES. Otol Neurotol 2018;39:987–94. [DOI] [PubMed] [Google Scholar]
- 14.Vickers D, Eyles J, Brinton J et al. Conversion of scores between Bamford, Kowal and Bench (BKB) sentences and Arthur Boothroyd (AB) words in quiet for cochlear implant patients. Cochlear Implants Int 2009;10:142–9. [DOI] [PubMed] [Google Scholar]
- 15.Bland JM, Altman DG. Statistical methods for assessing agreement between two methods of clinical measurement. Lancet 1986;1:307–10. [PubMed] [Google Scholar]
- 16.Altman D, Bland J. Measurement in Medicine: The Analysis of Method Comparison Studies. The Statistician 1983;32:307–17. [Google Scholar]
- 17.Giavarina D. Understanding Bland Altman analysis. Biochem Med (Zagreb) 2015;25:141–51. [DOI] [PMC free article] [PubMed] [Google Scholar]
- 18.Holder JT, Levin LM, Gifford RH. Speech Recognition in Noise for Adults With Normal Hearing: Age-Normative Performance for AzBio, BKB-SIN, and QuickSIN. Otol Neurotol 2018;39:e972–e8. [DOI] [PMC free article] [PubMed] [Google Scholar]
- 19.Massa ST, Ruckenstein MJ. Comparing the performance plateau in adult cochlear implant patients using HINT and AzBio. Otol Neurotol 2014;35:598–604. [DOI] [PubMed] [Google Scholar]
- 20.Thornton AR, Raffin MJ. Speech-discrimination scores modeled as a binomial variable. J Speech Hear Res 1978;21:507–18. [DOI] [PubMed] [Google Scholar]
- 21.LM T. Audiology: diagnostics. Audiology: diagnostics 2007. [Google Scholar]
- 22.Waltzman SB, Fisher SG, Niparko JK et al. Predictors of postoperative performance with cochlear implants. Ann Otol Rhinol Laryngol Suppl 1995;165:15–8. [PubMed] [Google Scholar]
- 23.Han JH, Lee HJ, Kang H et al. Brain Plasticity Can Predict the Cochlear Implant Outcome in Adult-Onset Deafness. Front Hum Neurosci 2019;13:38. [DOI] [PMC free article] [PubMed] [Google Scholar]
- 24.Holden LK, Finley CC, Firszt JB et al. Factors affecting open-set word recognition in adults with cochlear implants. Ear Hear 2013;34:342–60. [DOI] [PMC free article] [PubMed] [Google Scholar]
- 25.Blamey P, Artieres F, Başkent D et al. Factors affecting auditory performance of postlinguistically deaf adults using cochlear implants: an update with 2251 patients. Audiol Neurootol 2013;18:36–47. [DOI] [PubMed] [Google Scholar]
- 26.Zhao EE, Dornhoffer JR, Loftus C et al. Association of Patient-Related Factors With Adult Cochlear Implant Speech Recognition Outcomes: A Meta-analysis. JAMA Otolaryngol Head Neck Surg 2020;146:613–20. [DOI] [PMC free article] [PubMed] [Google Scholar]
- 27.Moberly AC, Bates C, Harris MS et al. The Enigma of Poor Performance by Adults With Cochlear Implants. Otol Neurotol 2016;37:1522–8. [DOI] [PMC free article] [PubMed] [Google Scholar]
- 28.Gudis DA, Montes M, Bigelow DC et al. The round window: is it the “cochleostomy” of choice? Experience in 130 consecutive cochlear implants. Otol Neurotol 2012;33:1497–501. [DOI] [PubMed] [Google Scholar]