

Abstract
Objective
The study aimed to identify periods of heightened susceptibility to the effects of pre‐ and postnatal secondhand tobacco smoke (SHS) exposure on body composition at age 12 years.
Methods
The study used data from 217 children from the Health Outcomes and Measures of the Environment (HOME) Study, a prospective cohort in Cincinnati, Ohio. Using multiple informant models, the study estimated associations of maternal serum cotinine (16 and 26 weeks of pregnancy) and child serum cotinine concentrations (at age 12, 24, 36, and 48 months) with measures of body composition obtained with anthropometry and dual‐energy x‐ray absorptiometry at 12 years. We examined whether there were differences between these associations for pre‐ and postnatal exposure periods and potential effect measure modification by sex.
Results
Postnatal cotinine concentrations were associated with higher weight, BMI, body fat and lean mass, waist circumference, and visceral, android, and gynoid fat. Each 10‐fold increase in postnatal cotinine was associated with 76% increased risk of overweight or obesity (95% CI: 1.13‐2.75). Associations between prenatal concentrations and measures of body composition at 12 years were generally null.
Conclusions
Postnatal exposure to SHS may increase adolescent adiposity and lean mass. Future studies should determine whether early‐life exposures to SHS are associated with other cardiometabolic risk markers.
Study Importance.
What is already known?
Secondhand smoke (SHS) exposure during pregnancy or childhood has been associated with an increased risk of sudden infant death syndrome, acute respiratory symptoms, ear infections, and cardiovascular disease.
The prenatal period, early childhood, and adolescence have been proposed as critical periods for the development of obesity and related cardiometabolic disorders.
What does this study add?
Our results suggest that postnatal exposure to SHS could have a greater influence on adolescent body composition than prenatal exposure.
Postnatal cotinine concentrations were associated with higher weight, BMI, body fat, lean mass, waist circumference, and visceral, android, and gynoid fat.
How might these results change the direction of research or the focus of clinical practice?
This study reinforces the need for ongoing public health interventions to discourage parents and caretakers from smoking and minimize their children's exposure to SHS.
Future cohorts should determine whether early‐life exposures to SHS are associated with other cardiometabolic risk markers and risk of cardiovascular disease later in life.
INTRODUCTION
Involuntary smoking, or secondhand tobacco smoke (SHS) exposure, is a public health concern with no apparent safe threshold [1]. Children are especially vulnerable to SHS because of their narrower bronchi, faster respiratory rate, and immature detoxification systems [2, 3]. Cotinine, the major metabolite of nicotine, is one of the most commonly used biomarkers for assessing recent SHS exposure because of its high specificity and sensitivity [4]. In the past decade, more than 40% of US children aged 3 to 11 years had serum cotinine levels consistent with exposure to SHS [5]; we previously showed a similar SHS exposure prevalence among children aged 1 to 4 years from the Health Outcomes and Measures of the Environment (HOME) Study cohort [6].
SHS exposure during pregnancy or childhood is associated with an increased risk of sudden infant death syndrome, acute respiratory symptoms, ear infections, and cardiovascular disease [1, 5]. Maternal smoking during pregnancy is associated with an elevated risk for intrauterine growth retardation, rapid postnatal compensatory growth, and obesity during childhood and adolescence [5, 7, 8, 9]. Obesity, which increases the risk of several chronic diseases, is the second leading cause of preventable disease and death in the US, surpassed only by smoking [10]. The prenatal period, early childhood, and adolescence have been proposed as critical periods for the development of obesity and related cardiometabolic disorders [11]. Prior studies assessing the association between pre‐ or postnatal exposure to SHS and the risk of overweight or obesity later in life (childhood to adolescence) have relied on maternal self‐report to define SHS exposure and have all been based on body mass index (BMI) [7, 8, 9, 12], an indirect measurement of adiposity that does not accurately distinguish between body fat mass and lean mass [13].
We are unaware of any studies that have identified periods of heightened susceptibility during pregnancy and childhood to the effects of SHS exposure on adolescent body composition. This is critical, as the prevalence of childhood obesity is increasing in the US and worldwide [14], and it has lifelong health consequences in terms of increased risk of premature morbidity and mortality [9]. The objective of this study was to estimate the potential effect of pre‐ and postnatal exposure to SHS on body composition in adolescents to identify periods of heightened susceptibility to the obesogenic effects of SHS exposure.
METHODS
Study participants
We used data from a longitudinal pregnancy and birth cohort, the HOME Study. The HOME Study recruited pregnant women between 2003 and 2006 and conducted follow‐up visits with the mothers and their children through age 12 years [15]. The principal objective of the HOME Study was to evaluate the association of pre‐ and postnatal exposure to environmental toxicants with health and neurobehavioral outcomes in infants and children. The inclusion criteria were the following: ≥18 years old, between 13 and 19 weeks of gestation, residing in a house built before 1978 within the study area, HIV‐negative, not taking thyroid or epilepsy medication, and not undergoing chemotherapy or radiation therapy. From March 2003 to January 2006, we recruited 468 pregnant women living in a five‐county region of the Cincinnati, Ohio, metropolitan area and Northern Kentucky. A total of 67 women dropped out in pregnancy during the run‐in phase of a randomized controlled trial of residential lead and injury hazard nested within the cohort [16].
We conducted follow‐up visits at the delivery hospital, the study clinic, or participants' homes when infants/children were approximately age 1 day, 4 weeks, and 1, 2, 3, 4, 5, 8, and 12 years. A detailed description of participants' characteristics, follow‐up, and study measures at the age 12 visit has been described elsewhere [17]. Among the 441 children who were eligible for the age 12 visit, 256 children completed the visit; singleton children who had at least one serum cotinine concentration measurement during pregnancy or childhood, anthropometry or dual‐energy x‐ray absorptiometry (DXA) assessment, and complete covariate information were included in the final analytics sample (N = 217).
The institutional review boards (IRBs) at Cincinnati Children's Hospital Medical Center and participating delivery hospitals approved the HOME Study protocols. Brown University and the Centers for Disease Control and Prevention (CDC) IRBs deferred to the Cincinnati Children's Hospital Medical Center IRB. All mothers provided informed consent for themselves and their children at all visits; children provided informed assent at the age 12 visit.
Prenatal and postnatal SHS exposure assessment
Trained phlebotomists collected maternal venous blood samples at 16 and 26 weeks of pregnancy to assess prenatal SHS exposure. They also collected children's venous blood samples at age 12, 24, 36, and 48 months via venipuncture to assess postnatal SHS exposure. The samples were stored at or below −80°C until analysis. Serum cotinine concentrations were quantified by trained technicians at the CDC using high‐performance liquid chromatography (HPLC) atmospheric pressure tandem mass spectrometry [18]. The assay limit of detection threshold for cotinine was 0.015 ng/mL [19].
Adolescent anthropometry and DXA measures
When adolescents were on average 12.4 years old (range: 11‐14 years), trained staff measured weight, height, and waist circumference to the nearest 0.01 kg or 0.1 cm in triplicate, following standardized protocols [17]. Children wore hospital scrubs and removed their shoes and head coverings during anthropometric assessments. We calculated BMI in kilograms per square meter from weight and height and obtained age‐ and sex‐specific BMI z scores based on CDC growth curves. Childhood overweight and obesity were defined as BMI z scores > 1 and >2, respectively, based on World Health Organization (WHO) growth reference data for ages 5 to 19 years [20].
At the same visit, trained technicians measured children's total body and regional fat mass and lean mass by DXA (Horizon densitometer, Hologic, Inc.). Percentage regional fat measures were calculated for the android and gynoid subregions as the regional fat mass divided by the total mass of the region × 100. The whole‐body DXA scan also yielded a measure of visceral fat area (centimeters squared), which is highly correlated with visceral fat area estimated by computed tomography [21]. A spine phantom was scanned daily to ensure optimal machine performance and calibration as recommended by the manufacturer. Age‐ and sex‐specific fat mass index (fat mass per height squared, kilograms per square meter) z scores were calculated based on the reference values generated using the National Health and Nutrition Examination Survey (NHANES) 1999 to 2004.
Covariates
We relied on previous literature and directed acyclic graphs to identify potential confounders that may be associated with both serum cotinine concentrations and adolescent body composition (Supporting Information Figures [Link], [Link]). Trained research staff collected sociodemographic covariates using standardized computer‐assisted interviews, including maternal age, race/ethnicity, marital status, and education in the second or third trimester of pregnancy. We abstracted prepregnancy weight and height from medical records. We used standardized interviewer‐administered surveys to assess breastfeeding duration. Pubertal status was self‐evaluated using Tanner stage (I‐V) based on pubic hair development in both sexes at the age 12 study visit and was positively correlated with serum concentrations of gonadal hormones from this visit [22].
Trained research staff at the NIH‐funded Clinical Translational Research Center Bionutrition Core collected 24‐hour food recalls from adolescents (two weekdays and one weekend day). We analyzed food recalls using the Nutrition Data Systems for Research software and foods database (University of Minnesota) and calculated the Healthy Eating Index (HEI) score (2010), a measure of diet quality that assesses conformance with US federal dietary guidance [23]. We assessed adolescent physical activity level by administering the validated Physical Activity Questionnaire for Older Children and by calculating the activity summary score [24].
Statistical analysis
Using exploratory data analysis techniques, we ascertained mothers' and children's characteristics, the distribution of adolescents anthropometry and DXA measures stratified by sex, the distribution of maternal serum cotinine concentrations at 16 and 26 weeks of pregnancy (including active smoking and nonsmoking mothers who could be exposed to SHS), and children's serum cotinine concentrations at age 12, 24, 36, and 48 months.
A total of 251 and 232 mothers had at least one serum cotinine measurement at 16 and 26 weeks of pregnancy, and 186, 149, 157, and 127 children had measurements at age 12, 24, 36, and 48 months, respectively. Anthropometry and DXA measures were obtained from 255 and 237 adolescents. We restricted the final analysis (multiple informant models) to 217 adolescents with complete information on covariates, at least one anthropometry or DXA measure at age 12 years, and at least one serum cotinine measurement from 16 weeks of gestation to age 48 months.
We log10‐transformed cotinine concentrations prior to analysis to reduce the potential influence of outliers. We calculated intraclass correlation coefficients (ICC) with 95% CI between log10‐transformed pre‐ or postnatal cotinine concentrations at each time point. The ICC between repeated maternal cotinine concentrations (N = 220 mothers) was 0.96 (95% CI: 0.94‐0.97); the ICC between the four childhood cotinine concentrations (N = 65 children) was 0.95 (95% CI: 0.93‐0.97). Given the excellent agreement, we averaged available maternal serum cotinine concentrations (range = one to two measures) and children's serum cotinine concentrations (range = one to four measures) to assess pre‐ and postnatal exposure, respectively, in further analysis.
Using multiple informant models, we estimated covariate‐adjusted differences in each anthropometry or DXA measure associated with a 1‐unit increase in prenatal and postnatal average log10‐transformed serum cotinine concentrations (β and 95% CI). Details on the multiple informant method have been previously described [25, 26]. Briefly, the multiple informant method can be used when there are repeated and sparsely sampled environmental exposure measures at different time points [26]. The multiple informant model uses generalized estimating equations to jointly estimate the exposure‐outcome association for each defined exposure period and tests whether the estimates for exposure‐outcome association are equal across different time points [25, 26]. We created two separate joint estimates, one for prenatal exposure period (average maternal serum cotinine concentrations at 16 and 26 weeks of pregnancy) and another for postnatal exposure period (average children's serum cotinine concentrations at age 12, 24, 36, and 48 months). The multiple informant model included exposure period, serum cotinine, serum cotinine × exposure period, and covariates, allowing us to test whether cotinine‐outcome associations differed between prenatal and postnatal exposure periods. The null hypothesis is that the associations are the same across the two time periods, and we considered those with heterogeneity p < 0.05 as evidence that at least one of the cotinine‐outcome associations differed from the rest.
We also examined the potential modifying effects of child sex using a three‐way interaction term of exposure period × serum cotinine × child sex. All multiple informant models were adjusted for maternal age, race/ethnicity, marital status, education, prepregnancy BMI, and breastfeeding duration. For outcome variables that were not z scores, models were additionally adjusted for child sex, pubertal stage, and age.
Furthermore, we conducted sensitivity analyses by further adjusting for child HEI 2010 total scores and physical activity summary scores.
Finally, we estimated the risk of overweight/obesity at age 12 years with increasing pre‐ and postnatal cotinine concentrations using modified Poisson regression with robust standard errors. We defined overweight/obesity as having an age‐ and sex‐standardized BMI z score > 1.
We performed all analyses using R statistical software, version 4.0.5 (R Core Team).
RESULTS
The characteristics of the final sample (N = 217) did not differ from those of the total HOME Study participants at the 12 year visit (N = 256; Table 1). The mean age of the 217 children was 12.3 years (SD: 0.7, range: 11‐14); among them, 53.9% were girls, and 88.9% were stage ≥ 2 for pubic hair development (Table 1). On average, mothers were age 29.5 years (95% CI: 28.7‐30.3) at delivery, 60.8% were non‐Hispanic White, 79.7% had greater than high school education, 57.1% had overweight or obesity before pregnancy, and 42.4% breastfed their children for at least 6 months (Table 1).
TABLE 1.
Characteristics of HOME Study participants attending the age 12 study visit (N = 256) and those who were included in the final analysis (N = 217)
| HOME Study participants N (%) | Final analysis participants N (%) | |
|---|---|---|
| Maternal characteristics | ||
| Age | ||
| 18‐25 | 58 (25.1) | 51 (23.5) |
| >25‐30 | 60 (26.0) | 58 (26.7) |
| >30‐35 | 79 (34.2) | 75 (34.6) |
| >35 | 34 (14.7) | 33 (15.2) |
| Race/ethnicity | ||
| White, non‐Hispanic | 155 (60.5) | 132 (60.8) |
| Black, non‐Hispanic | 88 (34.4) | 73 (33.6) |
| All others | 13 (5.1) | 12 (5.5) |
| Education | ||
| High school or less | 52 (21.1) | 44 (20.3) |
| Tech school/some college | 52 (21.1) | 44 (20.3) |
| College | 69 (27.9) | 62 (28.6) |
| Bachelor's or more | 74 (30.0) | 67 (30.9) |
| Prepregnancy BMI (kg/m2) | ||
| Underweight/normal (<24.9) | 98 (41.9) | 93 (42.9) |
| Overweight (25.0‐29.9) | 76 (32.5) | 69 (31.8) |
| Obesity (≥30) | 60 (25.6) | 55 (25.3) |
| Marital status | ||
| Married | 146 (63.20) | 141 (65.0) |
| Not married, living with someone | 28 (12.12) | 23 (10.6) |
| Not married, living alone | 57 (24.68) | 53 (24.4) |
| Breastfeeding duration (month) | ||
| <6 | 143 (59.8) | 125 (57.6) |
| ≥6 | 96 (40.2) | 92 (42.4) |
| Child characteristics | ||
| Sex | ||
| Girls | 143 (55.9) | 117 (53.9) |
| Boys | 113 (44.1) | 100 (46.1) |
| Pubic hair | ||
| Stage 1 | 26 (10.3) | 24 (11.1) |
| Stage 2 | 64 (25.4) | 55 (25.3) |
| Stage 3 | 72 (28.6) | 66 (30.4) |
| Stage 4 | 55 (21.8) | 43 (19.8) |
| Stage 5 | 35 (13.9) | 29 (13.4) |
Abbreviation: HOME, Health Outcomes and Measures of the Environment.
Thirty‐four percent of children had overweight or obesity at age 12 years. Boys and girls had similar mean height‐for‐age z scores, but the mean BMI z score was higher in girls than in boys (0.55 and 0.18, respectively). With the exception of visceral fat area, body composition measures were higher among girls (Table 2). Anthropometry or DXA measures at age 12 years were weakly to strongly correlated with each other, with correlation coefficients ranging from 0.01 (gynoid fat percentage, height‐for‐age z score) to 0.96 (gynoid fat percentage, body fat mass percentage; Figure 1).
TABLE 2.
Distribution of adolescent anthropometry and DXA measures at age 12 years
| Overall | Boys | Girls | ||||
|---|---|---|---|---|---|---|
| N | Mean (SD) or N (%) | N | Mean (SD) or N (%) | N | Mean (SD) or N (%) | |
| Anthropometry measures | ||||||
| Height‐for‐age z score | 255 | 0.47 (1.13) | 113 | 0.47 (1.18) | 142 | 0.47 (1.09) |
| Weight‐for‐age z score | 255 | 0.52 (1.25) | 113 | 0.33 (1.22) | 142 | 0.67 (1.25) |
| Normal/underweight | 255 | 169 (66.27) | 113 | 85 (75.22) | 142 | 84 (59.15) |
| Overweight (>1 SD)a | 255 | 69 (27.06) | 113 | 24 (21.24) | 142 | 45 (31.69) |
| Obesity (>2 SD)a | 255 | 17 (6.67) | 113 | 4 (3.54) | 142 | 13 (9.16) |
| BMI z score | 255 | 0.38 (1.20) | 113 | 0.18 (1.16) | 142 | 0.55 (1.20) |
| Waist circumference (cm) | 237 | 78.12 (13.88) | 105 | 75.71 (11.54) | 132 | 80.04 (15.26) |
| DXA measures | ||||||
| Body fat mass index z score | 237 | 0.23 (0.86) | 105 | 0.24 (0.74) | 132 | 0.22 (0.95) |
| Body fat mass percentage | 237 | 32.36 (7.07) | 105 | 29.70 (6.6) | 132 | 34.48 (6.71) |
| Body lean mass index z score | 237 | −0.32 (1.22) | 105 | −0.46 (1.15) | 132 | −0.21 (1.27) |
| Android fat percentage (%) | 237 | 29.79 (8.64) | 105 | 26.79 (7.52) | 132 | 32.17 (8.76) |
| Gynoid fat percentage (%) | 237 | 36.32 (6.58) | 105 | 33.34 (6.53) | 132 | 38.69 (5.60) |
| Android/gynoid fat percentage ratio | 237 | 0.81 (0.12) | 105 | 0.80 (0.11) | 132 | 0.82 (0.13) |
Abbreviation: DXA, dual‐energy x‐ray absorptiometry.
aOverweight and obesity are defined as having an age‐ and sex‐specific BMI z score >1 and >2 standard deviation scores, respectively, based on CDC Growth Charts [20].
FIGURE 1.
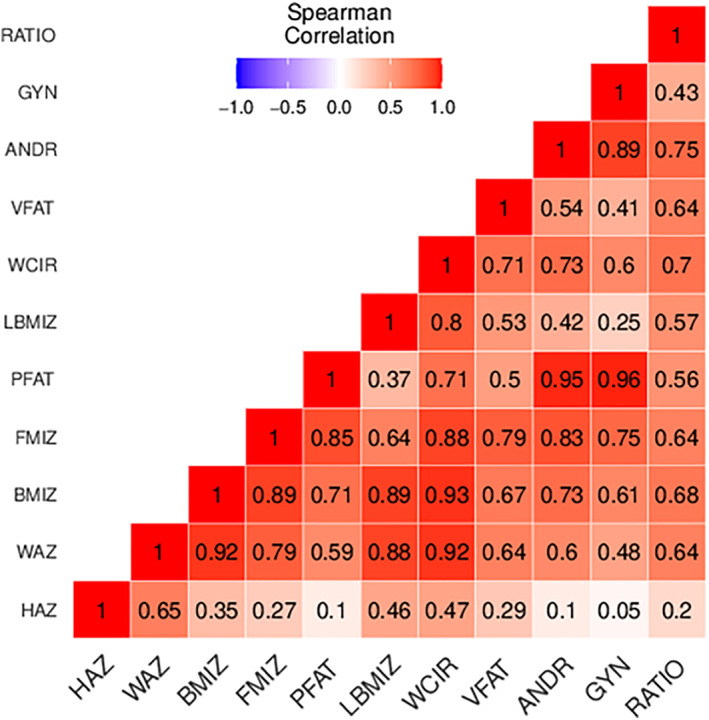
Spearman correlation coefficients between anthropometry and DXA measures at age 12 years. ANDR, android fat percentage; BMIZ, BMI z score; FMIZ, body fat mass index z score; GYN, gynoid fat percentage; HAZ, height‐for‐age z score; LBMIZ, body lean mass index z score; PFAT, body fat mass percentage; RATIO, android/gynoid fat percentage ratio; VFAT, visceral fat area; WAZ, weight‐for‐age z score; WCIR, waist circumference [Color figure can be viewed at wileyonlinelibrary.com]
Approximately 14.8% of mothers (N = 32) had average serum cotinine concentrations indicative of active smoking (≥3 ng/mL). Median maternal prenatal serum cotinine concentrations were lower than children's postnatal median concentrations (0.04 vs. 0.05 ng/mL, respectively; p < 0.001; Supporting Information Table S1). Postnatal cotinine concentrations were higher among girls than boys (medians: 0.06 vs. 0.04 ng/mL; p = 0.149; Supporting Information Table S1; Figure 2). Serum cotinine concentrations were moderately correlated with each other during the prenatal period and postnatal period (ρ = 0.76); the ICC between pre‐ and postnatal concentrations was 0.84 (95% CI: 0.81‐0.88), indicating excellent correlation.
FIGURE 2.

Violin plots of log10‐transformed maternal prenatal and child postnatal serum cotinine concentrations (nanograms/milliliter). The horizontal lines represent the 25, 50, and 75 percentile. Prenatal period includes maternal serum cotinine concentrations at 16 and 26 weeks of pregnancy. Postnatal period includes children's serum cotinine concentrations at ages 12, 24, 36, and 48 months. [Color figure can be viewed at wileyonlinelibrary.com]
After adjusting for covariates, associations of serum cotinine concentrations with most anthropometry or DXA measures at age 12 years differed by exposure period (prenatal vs. postnatal; Table 3; cotinine × exposure period interaction terms < 0.05). Specifically, prenatal serum cotinine concentrations and anthropometry or DXA measures were null (Table 3). In contrast, postnatal serum cotinine concentrations were associated with greater weight‐for‐age z score, BMI z score, body fat mass index z score, body fat mass percentage, body lean mass index z score, waist circumference, visceral fat area, and android and gynoid fat percentages (Table 3). The 95% CI of the point estimates included the null value, except for BMI z score (β = 0.27; 95% CI: 0.05‐0.49) and body lean mass index z score (β = 0.27; 95% CI: 0.04‐0.50; Table 3).
TABLE 3.
Adjusted associations (β [95% CI]) log10‐transformed serum cotinine concentrations (nanograms per milliliter) with anthropometry and DXA measures at age 12 years a
| N | Coefficients (95% CI) | Heterogeneity p value | ||
|---|---|---|---|---|
| Prenatal | Postnatal | |||
| Height‐for‐age z score | 217 | 0.01 (−0.15 to 0.17) | −0.03 (−0.34 to 0.28) | 0.90 |
| Weight‐for‐age z score | 217 | −0.01 (−0.17 to 0.15) | 0.20 (−0.04 to 0.45) | 0.02 |
| BMI z score | 217 | −0.02 (−0.18 to 0.14) | 0.27 (0.05 to 0.49) | <0.01 |
| Body fat mass index z score | 205 | −0.07 (−0.19 to 0.05) | 0.18 (−0.01 to 0.37) | <0.01 |
| Body fat mass percentage | 205 | −0.59 (−1.59 to 0.42) | 1.15 (−0.50 to 2.79) | 0.02 |
| Body lean mass index z score | 205 | −0.02 (−0.15 to 0.12) | 0.27 (0.04 to 0.50) | <0.01 |
| Waist circumference (cm) | 205 | −0.82 (−2.63 to 0.98) | 2.58 (−1.16 to 6.33) | 0.02 |
| Visceral fat area (cm2) | 205 | −0.05 (−0.14 to 0.04) | 0.11 (−0.04 to 0.27) | 0.04 |
| Android fat percentage (%) | 205 | −0.04 (−0.10 to 0.02) | 0.04 (−0.06 to 0.13) | 0.03 |
| Gynoid fat percentage (%) | 205 | −0.56 (−1.46 to 0.34) | 0.79 (−0.70 to 2.28) | 0.06 |
| Android/gynoid fat percentage ratio | 205 | −0.02 (−0.06 to 0.01) | 0.00 (−0.05 to 0.06) | 0.04 |
Abbreviation: DXA, dual‐energy x‐ray absorptiometry.
Adjusted for maternal age, race/ethnicity, marital status, education, prepregnancy BMI, and breastfeeding duration, as well as child sex, puberty, and age for all variables that are not z scores. Visceral fat area, android fat percentage, and android/gynoid fat percentage ratio were not normally distributed and therefore were log2‐transformed in the model. The period‐specific cotinine effect estimates were generated from a model with an interaction term between exposure period and serum cotinine. Heterogeneity p value is for the two‐way interaction term between exposure period and serum cotinine. Heterogeneity p values < 0.05 (in bold) were considered as evidence that at least one of the cotinine‐outcome associations differed between prenatal and postnatal exposure periods.
When considering the three‐way interaction term for exposure period × serum cotifnine × child sex from the multiple informant model, we observed suggestive evidence that the associations of postnatal cotinine with weight‐for‐age z score, body fat mass index z score, waist circumference, and visceral fat area at age 12 years were greater in girls than in boys (interaction p < 0.05; Table 4). For instance, each increase in log10‐transformed postnatal cotinine was associated with higher body fat mass index z score and visceral fat area in girls compared with boys (0.26 [95% CI: 0.06 to 0.47] vs. 0.09 [95% CI: −0.12 to 0.29] and 0.27 [95% CI: 0.10 to 0.45] vs. −0.09 [95% CI: −0.25 to 0.07], respectively; Table 4).
TABLE 4.
Adjusted associations (β [95% CI]) of increase in measures of log10‐transformed serum cotinine concentrations (nanograms per milliliter) with anthropometry and DXA measures at age 12 years by child sex a
| Coefficients (95% CI) | ||
|---|---|---|
| Boys | Girls | |
| Height‐for‐age z score | ||
| Prenatal | −0.10 (−0.28 to 0.09) | 0.07 (−0.09 to 0.23) |
| Postnatal | −0.18 (−0.51 to 0.14) | 0.10 (−0.21 to 0.41) |
| Interaction p value | 0.05 | |
| Weight‐for‐age z score | ||
| Prenatal | −0.03 (−0.22 to 0.17) | 0.01 (−0.16 to 0.18) |
| Postnatal | 0.14 (−0.13 to 0.41) | 0.27 (0.00 to 0.53) |
| Interaction p value | 0.03 | |
| BMI z score | ||
| Prenatal | −0.01 (−0.20 to 0.19) | −0.02 (−0.20 to 0.16) |
| Postnatal | 0.25 (0.00 to 0.49) | 0.30 (0.05 to 0.54) |
| Interaction p value | 0.09 | |
| Body fat mass index z score | ||
| Prenatal | −0.12 (−0.26 to 0.03) | −0.05 (−0.18 to 0.09) |
| Postnatal | 0.09 (−0.12 to 0.29) | 0.26 (0.06 to 0.47) |
| Interaction p value | 0.03 | |
| Body fat mass percentage | ||
| Prenatal | 0.79 (−0.46 to 2.03) | −1.24 (−2.38 to −0.10) |
| Postnatal | 2.40 (0.47 to 4.32) | 0.25 (−1.61 to 2.10) |
| Interaction p value | 0.09 | |
| Body lean mass index z score | ||
| Prenatal | −0.06 (−0.24 to 0.13) | 0.01 (−0.14 to 0.15) |
| Postnatal | 0.18 (−0.07 to 0.44) | 0.34 (0.09 to 0.59) |
| Interaction p value | 0.06 | |
| Waist circumference (cm) | ||
| Prenatal | −0.49 (−2.71 to 1.73) | −0.89 (−2.88 to 1.11) |
| Postnatal | 2.35 (−1.49 to 6.19) | 2.96 (−1.08 to 7.00) |
| Interaction p value | 0.01 | |
| Visceral fat area (cm2) | ||
| Prenatal | −0.20 (−0.33 to −0.08) | 0.03 (−0.09 to 0.15) |
| Postnatal | −0.09 (−0.25 to 0.07) | 0.27 (0.10 to 0.45) |
| Interaction p value | 0.01 | |
| Android fat percentage (%) | ||
| Prenatal | 0.04 (−0.04 to 0.11) | −0.08 (−0.14 to −0.01) |
| Postnatal | 0.11 (0.00 to 0.22) | −0.02 (−0.13 to 0.08) |
| Interaction p value | 0.28 | |
| Gynoid fat percentage (%) | ||
| Prenatal | 0.99 (−0.28 to 2.26) | −1.30 (−2.36 to −0.24) |
| Postnatal | 2.32 (0.48 to 4.16) | −0.33 (−2.04 to 1.38) |
| Interaction p value | 0.19 | |
| Android/gynoid fat percentage ratio | ||
| Prenatal | −0.01 (−0.05 to 0.03) | −0.03 (−0.06 to 0.01) |
| Postnatal | 0.01 (−0.05 to 0.07) | −0.00 (−0.06 to 0.06) |
| Interaction p value | 0.42 | |
Abbreviation: DXA, dual‐energy x‐ray absorptiometry.
Adjusted for maternal age, race/ethnicity, marital status, education, prepregnancy BMI, and breastfeeding duration, as well as child sex, puberty, and age for all variables that are not z scores. Cross‐sectional area of fat inside abdominal cavity, android fat percentage, and android/gynoid fat percentage ratio were not normally distributed and therefore were log2‐transformed in the model. The period‐specific cotinine effect estimates were generated from a model with an interaction term between exposure period, serum cotinine, and child sex. P value is for the three‐way interaction term of exposure period × serum cotinine × child sex. Interaction p values < 0.05 (in bold) were considered as evidence that at least one of the cotinine‐outcome associations differed between prenatal and postnatal exposure periods and by child sex.
In sensitivity analyses, our results did not meaningfully change after further adjusting for HEI scores and physical activity level scores (Supporting Information Table S2).
After adjusting for covariates, the risk of overweight/obesity increased by 1.76 (95% CI: 1.13‐2.75) per each 1‐unit increase in postnatal average log10‐transformed serum cotinine concentrations (Table 5). Prenatal serum cotinine concentrations were not associated with risk of overweight/obesity. Our results did not meaningfully change after further adjusting for HEI scores and physical activity levels scores.
TABLE 5.
Adjusted RR of overweight/obesity (N = 86) per each 1‐unit increase in pre‐ and postnatal average log10‐transformed serum cotinine concentrations
| Crude RR (95% CI) | Adjusted RR (95% CI) a | Adjusted RR (95% CI) b | |
|---|---|---|---|
| SHS exposure | |||
| Prenatal serum cotinine | 0.94 (0.75 to 1.19) | 0.93 (0.73 to 1.18) | 1.02 (0.79 to 1.33) |
| Postnatal serum cotinine | 1.53 (0.97 to 2.42) | 1.76 (1.13 to 2.75) | 1.75 (1.12 to 2.73) |
Abbreviations: RR, relative risk; SHS, secondhand smoke.
Adjusted for maternal age, race/ethnicity, marital status, education, prepregnancy BMI, and breastfeeding duration, as well as child sex, age, and puberty.
Adjusted for maternal age, race/ethnicity, marital status, education, prepregnancy BMI, and breastfeeding duration, as well as child sex, age, puberty, Healthy Eating Index scores, and physical activity level scores.
DISCUSSION
In the HOME Study, we examined the associations of repeated measures of serum cotinine concentrations from pregnancy to age 4 years with anthropometry or DXA measures at age 12 years. We found that the cotinine‐outcome associations differed by exposure period and in a sex‐specific manner. In general, prenatal cotinine concentrations were not associated with body composition, whereas postnatal concentrations were associated with higher BMI z score and lean mass index z score in early adolescence. When stratifying by children's sex, we observed no clear pattern for prenatal cotinine concentrations; however, there was evidence to suggest that postnatal concentrations were more strongly associated with some adiposity measures among girls compared with boys.
Tobacco consists of 5,000 chemical compounds; some of these chemicals, such as polycyclic aromatic hydrocarbons and nitrosamine 4 (methylnitrosamino)‐1‐(3‐pyridyl)‐1‐butanone, can cross the placenta and directly impact the hypothalamus [27, 28], a key regulator of food intake, energy expenditure, and body fat stores [29]. Interestingly, we found strong postnatal cotinine‐outcome associations with lean mass index z score, which is not a measure of adiposity, and BMI z score, which does not distinguish between body fat mass and lean mass. In our study, the correlation between fat mass index z score and lean mass index z score was moderate (ρ = 0.64) and, in turn, these two components were highly correlated with BMI (ρ = 0.89). This is consistent with the observation that BMI measures both lean and fat mass, and fat mass is less correlated with BMI at lower levels of fat mass [30].
Although previous studies have relied just on BMI to infer obesogenicity from postnatal SHS exposure in children and adolescents [12, 31], our results suggest that postnatal exposure to SHS may be related to both increased body lean mass and body fat mass during early adolescence. This could be explained by changes that occur in the growth pattern, fat distribution [32], or possibly by confounding related to differences in cotinine metabolism and excretion during the first years of life among children who are at risk of overweight/obesity during adolescence compared with those who are not [33]. Although it is possible that postnatal exposure to SHS increases lean mass during adolescence, association could be merely a reflection of its correlation with BMI z score (ρ = 0.89). Future studies should verify these hypotheses using DXA measures when examining the obesogenic effects of SHS exposure.
Although it remains unclear how growth patterns early in life affect body composition programming during adolescence, a previous study concluded that adolescent height was primarily determined by fetal and infant growth, whereas weight, body fat mass, and lean mass were influenced by later growth from 4 years onward [32]. In 2020, a systematic review emphasized that growth in children might be affected by pre‐ or postnatal SHS exposure [29]. With the exception of the height and gynoid fat percentage, we observed statistically discernible periods of heightened susceptibility when assessing associations between serum cotinine and body composition, suggesting that postnatal exposure to SHS has a greater influence on body composition than prenatal exposure.
Prior work including HOME Study children showed that prenatal SHS exposure was associated with higher BMI at age 3 years [34]. However, our findings from the main analysis suggested a null relationship between prenatal exposure and adiposity or body lean mass during adolescence; interestingly, the association between prenatal cotinine concentrations and body lean mass index z score became positive when assessing children's SHS exposure exclusively from nonsmoking mothers in sensitivity analysis, although the 95% CI included the null value. Previous studies have found an inverse relationship between prenatal SHS exposure, measured by self‐report, and overall adiposity in infants, but not in adolescents [35, 36]. An English cohort study observed a positive association between maternal self‐reported smoking in pregnancy and offspring's BMI, body fat mass, and lean mass measured with DXA at age 9 years [37]. Prenatal smoking is an established risk factor for intrauterine growth restriction. Biological predisposition to catchup growth conferred by this restraint may result in an acceleration of postnatal growth that overshoots the level of obesity that would be observed otherwise [38]. The increased risk of obesity in adolescents exposed to prenatal smoking may result from endocrine disruption or from extrinsic factors such as maternal socioeconomic characteristics, method of feeding during the first year, and unhealthy lifestyle habits frequently observed among children of smoking mothers [39, 40].
Inconsistencies in the anthropometry or DXA results across studies may relate to differences in the study designs, the method or reference values used when assessing adiposity measures, and to the method and timing of the SHS exposure assessment [41]. Importantly, most prior studies of prenatal smoking exposure have compared active smoking mothers with nonsmoking mothers based on maternal self‐report [7, 8, 9]; however, we assessed prenatal smoking exposure with maternal cotinine measurements during pregnancy.
In our study, serum cotinine concentrations were similar to those of other pregnant women and children in the US during 2003 to 2010 [42, 43]. Prenatal cotinine concentrations were moderately correlated with postnatal concentrations. Children's cotinine concentrations peaked at age 12 months and were lower at age 48 months (0.06 and 0.03 ng/mL, respectively); our results are consistent with previous studies that have found higher cotinine concentrations among the youngest children, and this could possibly reflect inhalation of larger quantities of SHS contaminants due to a faster respiratory rate, greater exposure to SHS at home (inability to distract themselves), thirdhand tobacco smoke, breastfeeding by smoking mothers, or slower cotinine metabolism and clearance [33, 44]. Moreover, in line with previous studies, girls had higher cotinine concentrations compared with boys, and this could be due to sex differences in cotinine metabolism and clearance or an increased level of SHS exposure as a result of the longer period of time that girls often spend indoors [44, 45].
When stratifying by children's sex, the percentage of overweight or obesity was higher among girls in comparison with boys (40.9% vs. 24.8%), as observed by prior investigators [11]. Our results reflect the expected sexual dimorphism in adipose tissue mass that emerges during adolescence, with girls having greater adiposity than boys. Of note, although there is no consensus regarding the association between child sex and accelerated growth or fat distribution when considering SHS exposure [37], our findings show some evidence of sex‐specific associations of postnatal cotinine with adiposity. The modification of the exposure‐outcome associations by child sex could be explained by differences in the way tobacco smoke constituents affect the endocrine system (gonadal, thyroid, and leptin hormones), metabolism, growth, and fat distribution/deposition in girls versus boys [11, 13, 40].
This study has some limitations and strengths. First, we had a modest sample size. Still, to our knowledge, no studies have assessed the effects of SHS (measured with serum cotinine across pregnancy and early childhood) on adolescents' body composition with both anthropometry and DXA measures. Of note, the use of multiple informant models enables us to identify potential periods of heightened susceptibility and reduce the number of fitted regression models, but it does not adjust for SHS exposure at other times; considering the high correlation found between pre‐ and postnatal cotinine concentrations (ICC = 0.85; IC 95%: 0.81‐0.88), significant findings for postnatal cotinine could be a reflection of the longer and consistent exposure to SHS after birth. Another limitation is the attrition of study participants (attrition rate of 42% at age 12 study visit); however, loss to follow‐up was not associated with any measured sociodemographic characteristic [17]. Although there might be residual confounding from maternal behavioral or lifestyle factors, we adjusted for an extensive set of covariates, identified based on the previous literature, which included breastfeeding duration, children's diet quality, and physical activity. We did not adjust for potential causal intermediates (e.g., birth weight), as this could result in us underestimating the total effect of prenatal tobacco smoke exposure on adolescents' body composition. Unfortunately, we did not have detailed diet information during pregnancy, but even if children were exposed to SHS from nicotine‐containing foodstuffs, consumption levels would be insignificant compared with moderate SHS exposure [4]. Fifth, we did not include questions to evaluate thirdhand smoke exposure, such as involuntary inhalation, oral consumption, or cutaneous absorption of nicotine particles deposited on clothing and furniture, or dietary intake. Furthermore, we are unable to replicate prior studies of prenatal smoking versus nonsmoking mothers because of the limited number of smokers in our cohort (N = 32). Our main aim was to analyze the potential impact of SHS exposure on children's body composition, independent of maternal smoking, and, unlike other studies, we included both maternal active smoking exposure and maternal passive smoking exposure. Finally, our findings may not be generalizable to other populations. Reassuringly, median serum cotinine concentrations among HOME Study participants were very similar to that of pregnant women and children aged 3 to 11 years from the NHANES during the time of enrollment and follow‐up [42, 43].
CONCLUSION
Our results suggest that postnatal exposure to SHS could have a greater influence on adolescents' body composition than prenatal exposure. Postnatal exposure to SHS may alter adolescents' body composition, possibly in a sex‐specific manner. Future cohorts should determine whether early‐life exposures to SHS are associated with other cardiometabolic risk markers and risk of cardiovascular disease later in life. This study reinforces the need for ongoing public health interventions to discourage parents and caretakers from smoking and minimize their children's exposure to SHS.
AUTHOR CONTRIBUTIONS
Mónica Pérez‐Ríos and Joseph M. Braun planned the study and supervised it, with contribution from all the other authors. Mónica Pérez‐Ríos and Nerea Mourino performed the analysis with substantive contribution from all the other authors, Mónica Pérez‐Ríos and Nerea Mourino wrote the first draft of the manuscript, and Kimberly Yolton, Bruce P. Lanphear, Aimin Chen, Jessie P. Buckley, Heidi J. Kalkwarf, Kim M. Cecil, and Joseph M. Braun provided critical comments and contributed to successive versions of the manuscript. All the authors approved the final version of the paper.
FUNDING INFORMATION
The HOME Study was funded by National Institute of Environmental Health Sciences grants P01 ES011261, R01 ES014575, and R01 ES015517. The US NIH (National Institute of Environmental Health Sciences), Environmental Protection Agency, Department of Housing and Urban Development, and Flight Attendant Medical Research Institute provided funding for the presented results in the HOME Study.
CONFLICT OF INTEREST
Joseph M. Braun's institution was financially compensated for his services as an expert witness for plaintiffs in litigation related to perfluoroalkyl substances (PFAS)‐contaminated drinking water; these funds were not paid to Joseph M. Braun directly. The other authors declared no conflict of interest.
Supporting information
Figure S1 Directed acyclic graph of potential confounders of the association between prenatal serum cotinine concentrations and adolescent's body composition.
Figure S2 Directed acyclic graph of potential confounders of the association between postnatal serum cotinine concentrations and adolescent's body composition.
Table S1 Distribution of serum cotinine concentrations (nanograms per milliliter) from 16 weeks of pregnancy to age 48 monthsa.
Table S2. Associations (β [95% CI]) of increase in log10‐transformed pre‐ and postnatal serum cotinine concentrations with body lean mass and adiposity measures at age 12 years, adjusted for additional covariates, and heterogeneity p values (cotinine × exposure period interaction terms).
ACKNOWLEDGMENTS
We thank the HOME Study staff, patient advisers, and participants for their years of dedication to the study.
Mourino N, Pérez‐Ríos M, Yolton K, et al. Pre‐ and postnatal exposure to secondhand tobacco smoke and body composition at 12 years: periods of susceptibility. Obesity (Silver Spring). 2022;30(8):1659‐1669. doi: 10.1002/oby.23480
This paper is part of the PhD work of Nerea Mourino.
Funding information National Institute of Environmental Health Sciences, Grant/Award Numbers: P01 ES011261, R01 ES014575, R01 ES015517
REFERENCES
- 1. Office on Smoking and Health . The Health Consequences of Involuntary Exposure to Tobacco Smoke: A Report of the Surgeon General. US Centers for Disease Control and Prevention; 2006. [PubMed] [Google Scholar]
- 2. Hang B, Wang P, Zhao Y, et al. Adverse health effects of thirdhand smoke: from cell to animal models. Int J Mol Sci. 2017;18:932. doi: 10.3390/ijms18050932 [DOI] [PMC free article] [PubMed] [Google Scholar]
- 3. Cresteil T. Onset of xenobiotic metabolism in children: toxicological implications. Food Addit Contam. 1998;15(suppl):45‐51. [DOI] [PubMed] [Google Scholar]
- 4. Benowitz NL. Cotinine as a biomarker of environmental tobacco smoke exposure. Epidemiol Rev. 1996;18:188‐204. [DOI] [PubMed] [Google Scholar]
- 5. Raghuveer G, White DA, Hayman LL, et al. Cardiovascular consequences of childhood secondhand tobacco smoke exposure: prevailing evidence, burden, and racial and socioeconomic disparities: a scientific statement from the American Heart Association. Circulation. 2016;134:e336‐e359. [DOI] [PMC free article] [PubMed] [Google Scholar]
- 6. Mourino N, Pérez‐Ríos M, Santiago‐Pérez MI, Lanphear B, Yolton K, Braun JM. Secondhand tobacco smoke exposure among children under 5 years old: questionnaires versus cotinine biomarkers: a cohort study. BMJ Open. 2021;11:e044829. doi: 10.1136/bmjopen-2020-044829 [DOI] [PMC free article] [PubMed] [Google Scholar]
- 7. Oken E, Levitan EB, Gillman MW. Maternal smoking during pregnancy and child overweight: systematic review and meta‐analysis. Int J Obes (Lond). 2008;32:201‐210. [DOI] [PMC free article] [PubMed] [Google Scholar]
- 8. Rayfield S, Plugge E. Systematic review and meta‐analysis of the association between maternal smoking in pregnancy and childhood overweight and obesity. J Epidemiol Community Health. 2017;71:162‐173. [DOI] [PubMed] [Google Scholar]
- 9. Huang JS, Lee TA, Lu MC. Prenatal programming of childhood overweight and obesity. Matern Child Health J. 2007;11:461‐473. [DOI] [PubMed] [Google Scholar]
- 10. Mokdad AH, Ballestros K, Echko M, et al. The state of US health, 1990‐2016: burden of diseases, injuries, and risk factors among US states. JAMA. 2018;319:1444‐1472. [DOI] [PMC free article] [PubMed] [Google Scholar]
- 11. Dietz WH. Critical periods in childhood for the development of obesity. Am J Clin Nutr. 1994;59:955‐959. [DOI] [PubMed] [Google Scholar]
- 12. Raum E, Küpper‐Nybelen J, Lamerz A, Hebebrand J, Herpertz‐Dahlmann B, Brenner H. Tobacco smoke exposure before, during, and after pregnancy and risk of overweight at age 6. Obesity (Silver Spring). 2011;19:2411‐2417. [DOI] [PubMed] [Google Scholar]
- 13. Wells JC. A critique of the expression of paediatric body composition data. Arch Dis Child. 2001;85:67‐72. [DOI] [PMC free article] [PubMed] [Google Scholar]
- 14. Tiwari A, Balasundaram P. Public Health Considerations Regarding Obesity. StatPearls Publishing LLC.; 2022. [PubMed] [Google Scholar]
- 15. Braun JM, Kalloo G, Chen A, et al. Cohort profile: the health outcomes and measures of the environment (HOME) study. Int J Epidemiol. 2017;46:24. doi: 10.1093/ije/dyw006 [DOI] [PMC free article] [PubMed] [Google Scholar]
- 16. Braun JM, Hornung R, Chen A, et al. Effect of residential Lead‐Hazard interventions on childhood blood Lead concentrations and neurobehavioral outcomes: a randomized clinical trial. JAMA Pediatr. 2018;172:934‐942. [DOI] [PMC free article] [PubMed] [Google Scholar]
- 17. Braun JM, Buckley JP, Cecil KM, et al. Adolescent follow‐up in the health outcomes and measures of the environment (HOME) study: cohort profile. BMJ Open. 2020;10:e034838. doi: 10.1136/bmjopen-2019-034838 [DOI] [PMC free article] [PubMed] [Google Scholar]
- 18. Bernert JT, Jacob P, Holiday DB, et al. Interlaboratory comparability of serum cotinine measurements at smoker and nonsmoker concentration levels: a round‐robin study. Nicotine Tob Res. 2009;11:1458‐1466. [DOI] [PMC free article] [PubMed] [Google Scholar]
- 19. Benowitz NL, Bernert JT, Caraballo RS, Holiday DB, Wang J. Optimal serum cotinine levels for distinguishing cigarette smokers and nonsmokers within different racial/ethnic groups in the United States between 1999 and 2004. Am J Epidemiol. 2009;169:236‐248. [DOI] [PubMed] [Google Scholar]
- 20. World Health Organization . Growth reference data for 5‐19 years. Accessed February 4, 2022. https://www.who.int/tools/growth-reference-data-for-5to19-years
- 21. Micklesfield LK, Goedecke JH, Punyanitya M, Wilson KE, Kelly TL. Dual‐energy X‐ray performs as well as clinical computed tomography for the measurement of visceral fat. Obesity (Silver Spring). 2012;20:1109‐1114. [DOI] [PMC free article] [PubMed] [Google Scholar]
- 22. Yayah Jones NH, Khoury JC, Xu Y, et al. Comparing adolescent self staging of pubertal development with hormone biomarkers. J Pediatr Endocrinol Metab. 2021;34:1531‐1541. [DOI] [PMC free article] [PubMed] [Google Scholar]
- 23. Guenther PM, Casavale KO, Reedy J, et al. Update of the healthy eating index: HEI‐2010. J Acad Nutr Diet. 2013;113:569‐580. [DOI] [PMC free article] [PubMed] [Google Scholar]
- 24. Kowalski KC, Crocker PRE, Faulkner RA. Validation of the physical activity questionnaire for older children. Pediatr Exerc Sci. 1997;9:174‐186. [Google Scholar]
- 25. Buckley JP, Hamra GB, Braun JM. Statistical approaches for investigating periods of susceptibility in Children's environmental Health Research. Curr Environ Health Rep. 2019;6:1‐7. [DOI] [PMC free article] [PubMed] [Google Scholar]
- 26. Sánchez BN, Hu H, Litman HJ, Téllez‐Rojo MM. Statistical methods to study timing of vulnerability with sparsely sampled data on environmental toxicants. Environ Health Perspect. 2011;119:409‐415. [DOI] [PMC free article] [PubMed] [Google Scholar]
- 27. IARC Working Group on the Evaluation of Carcinogenic Risks to Humans . Personal habits and indoor combustions. Volume 100E. International Agency for Research on Cancer; 2012. [PMC free article] [PubMed]
- 28. Braimoh TS, Kobayashi S, Sata F, et al. Association of prenatal passive smoking and metabolic gene polymorphisms with child growth from birth to 3years of age in the Hokkaido birth cohort study on environment and Children's health. Sci Total Environ. 2017;605‐606:995‐1002. [DOI] [PubMed] [Google Scholar]
- 29. Nadhiroh SR, Djokosujono K, Utari DM. The association between secondhand smoke exposure and growth outcomes of children: a systematic literature review. Tob Induc Dis. 2020;18:12. doi: 10.18332/tid/117958 [DOI] [PMC free article] [PubMed] [Google Scholar]
- 30. Boeke CE, Oken E, Kleinman KP, Rifas‐Shiman SL, Taveras EM, Gillman MW. Correlations among adiposity measures in school‐aged children. BMC Pediatr. 2013;13:99. doi:10.1186/1471‐2431‐13‐99 [DOI] [PMC free article] [PubMed] [Google Scholar]
- 31. Braithwaite I, Stewart AW, Hancox RJ, Beasley R, Murphy R, Mitchell EA. Maternal post‐natal tobacco use and current parental tobacco use is associated with higher body mass index in children and adolescents: an international cross‐sectional study. BMC Pediatr. 2015;15:220. doi: 10.1186/s12887-015-0538-x [DOI] [PMC free article] [PubMed] [Google Scholar]
- 32. Victora CG, Sibbritt D, Horta BL, Lima RC, Cole T, Wells J. Weight gain in childhood and body composition at 18 years of age in Brazilian males. Acta Paediatr. 2007;96:296‐300. [DOI] [PMC free article] [PubMed] [Google Scholar]
- 33. Benowitz NL, Hukkanen J, Jacob P 3rd. Nicotine chemistry, metabolism, kinetics and biomarkers. Handb Exp Pharmacol. 2009;192:29‐60. [DOI] [PMC free article] [PubMed] [Google Scholar]
- 34. Braun JM, Daniels JL, Poole C, et al. Prenatal environmental tobacco smoke exposure and early childhood body mass index. Paediatr Perinat Epidemiol. 2010;24:524‐534. [DOI] [PMC free article] [PubMed] [Google Scholar]
- 35. Harrod CS, Reynolds RM, Chasan‐Taber L, et al. Quantity and timing of maternal prenatal smoking on neonatal body composition: the healthy start study. J Pediatr. 2014;165:707‐712. [DOI] [PMC free article] [PubMed] [Google Scholar]
- 36. Lindsay CA, Thomas AJ, Catalano PM. The effect of smoking tobacco on neonatal body composition. Am J Obstet Gynecol. 1997;177:1124‐1128. [DOI] [PubMed] [Google Scholar]
- 37. Leary SD, Smith GD, Rogers IS, Reilly JJ, Wells JC, Ness AR. Smoking during pregnancy and offspring fat and lean mass in childhood. Obesity (Silver Spring). 2006;14:2284‐2293. [DOI] [PMC free article] [PubMed] [Google Scholar]
- 38. Salmasi G, Grady R, Jones J, McDonald SD. Environmental tobacco smoke exposure and perinatal outcomes: a systematic review and meta‐analyses. Acta Obstet Gynecol Scand. 2010;89:423‐441. [DOI] [PubMed] [Google Scholar]
- 39. Vik T, Jacobsen G, Vatten L, Bakketeig LS. Pre‐ and post‐natal growth in children of women who smoked in pregnancy. Early Hum Dev. 1996;45:245‐255. [DOI] [PubMed] [Google Scholar]
- 40. Braun M, Klingelhöfer D, Oremek GM, Quarcoo D, Groneberg DA. Influence of second‐hand smoke and prenatal tobacco smoke exposure on biomarkers, genetics and physiological processes in children‐an overview in research insights of the last few years. Int J Environ Res Public Health. 2020;17:3212. doi: 10.3390/ijerph17093212 [DOI] [PMC free article] [PubMed] [Google Scholar]
- 41. Liu Y, Li N, Papandonatos GD, et al. Exposure to per‐ and Polyfluoroalkyl substances and adiposity at age 12 years: evaluating periods of susceptibility. Environ Sci Technol. 2020;54:16039‐16049. [DOI] [PMC free article] [PubMed] [Google Scholar]
- 42. Woodruff TJ, Zota AR, Schwartz JM. Environmental chemicals in pregnant women in the United States: NHANES 2003‐2004. Environ Health Perspect. 2011;119:878‐885. [DOI] [PMC free article] [PubMed] [Google Scholar]
- 43. US Centers for Disease Control and Prevention. Fourth National Report on Human Exposure to Environmental Chemicals, Updated Tables, (March 2021). US Department of Health and Human Services, Centers for Disease Control and Prevention; 2021. [Google Scholar]
- 44. Pirkle JL, Bernert JT, Caudill SP, Sosnoff CS, Pechacek TF. Trends in the exposure of nonsmokers in the U.S. population to secondhand smoke: 1988‐2002. Environ Health Perspect. 2006;114:853‐858. [DOI] [PMC free article] [PubMed] [Google Scholar]
- 45. Larson LR, Green GT, Hk C. Children's time outdoors: results and implications of the National Kids Survey. J Park Recreat Admi. 2011;29:20. https://js.sagamorepub.com/jpra/article/view/1089 [Google Scholar]
Associated Data
This section collects any data citations, data availability statements, or supplementary materials included in this article.
Supplementary Materials
Figure S1 Directed acyclic graph of potential confounders of the association between prenatal serum cotinine concentrations and adolescent's body composition.
Figure S2 Directed acyclic graph of potential confounders of the association between postnatal serum cotinine concentrations and adolescent's body composition.
Table S1 Distribution of serum cotinine concentrations (nanograms per milliliter) from 16 weeks of pregnancy to age 48 monthsa.
Table S2. Associations (β [95% CI]) of increase in log10‐transformed pre‐ and postnatal serum cotinine concentrations with body lean mass and adiposity measures at age 12 years, adjusted for additional covariates, and heterogeneity p values (cotinine × exposure period interaction terms).