

Abstract

Phenotypic targeting requires the ability of the drug delivery system to discriminate over cell populations expressing a particular receptor combination. Such selectivity control can be achieved using multiplexed-multivalent carriers often decorated with multiple ligands. Here, we demonstrate that the promiscuity of a single ligand can be leveraged to create multiplexed-multivalent carriers achieving phenotypic targeting. We show how the cellular uptake of poly(2-(methacryloyloxy)ethyl phosphorylcholine)-poly(2-(diisopropylamino)ethyl methacry-late) (PMPC-PDPA) polymersomes varies depending on the receptor expression among different cells. We investigate the PMPC–PDPA polymersome insertion at the single chain/receptor level using all-atom molecular modeling. We propose a theoretical statistical mechanics-based model for polymersome–cell association that explicitly considers the interaction of the polymersome with the cell glycocalyx shedding light on its effect on the polymersome binding. We validate our model experimentally and show that the binding energy is a nonlinear function, allowing us to tune the interaction by varying the radius and degree of polymerization. Finally, we show that PMPC–PDPA polymersomes can be used to target monocytes in vivo due to their promiscuous interaction with SRB1, CD36, and CD81.
Short abstract
A multiscale study is reported showing how to leverage a promiscuous ligand to achieve phenotypic targeting in vivo and the importance of explicitly taking into account the cell glycocalyx in nanomedicines design.
Introduction
Selectivity and specificity are among the most desirable qualities for a drug. The former defines the ability of a drug to target only a particular cell population, and the latter ensures that it has an impact on that cell population. Though small molecules account for most therapeutics in use, their poor solubility in water, inability to cross cellular membranes, and promiscuous interactions (leading to adverse side effects) have placed the focus in recent years on drug delivery systems.1 Fuelled by many advances in nanotechnology and biotechnology, the past decades have witnessed rapid growth in the research and development of drug delivery devices in the form of polymeric nano- and/or microparticles, liposomes, and micelles, among others.2−4 The physicochemical properties of nanocarriers are easy to tune, and a high degree of selectivity can be achieved by decorating their surface with ligands. Nanocarriers’ high selectivity increases their ability to cross biological barriers that small molecules cannot overcome, opening the door to target biological macromolecules inside the cells,5 including cells within the central nervous system.6
The higher the ligand affinity, the lower the ligand concentration required to saturate its receptor. We can enhance affinity by creating a carrier containing multiple ligands targeting the same receptor in the surface (multivalent scaffolds),7 therefore increasing the drug carrier affinity or, in this case, its avidity.8 Nature exploits the collective binding effect of multivalent objects and avidity in most biological processes.9 Multivalent interactions in biological systems enhance weak individual interactions and change the proximity of the proteins in the cell (clustering), inducing signal transduction.
Although high affinity is a desirable quality, the targeted receptors are expressed in both tumor and healthy cells in diseases such as cancer. Therefore, high-affinity ligands will bind to any cell that expresses the targeted receptors, thus leading to unwanted interactions that, in some cases, outweigh the clinical benefits. However, in 2007, Carlson et al. showed that multivalent targeting was more selective when multivalent low-affinity ligands were used,10 a concept that was later mathematized by Martinez-Veracoechea and Frenkel, in what they called superselectivity theory (SST).11 SST shows that the combination of multiple low-affinity ligands creates on–off association profiles, where the multivalent scaffold saturates the receptors only above a given cutoff receptor density, and it does not bind below that density. However, multivalent systems are strongly affected by nonspecific binding of the ligands to untargeted receptors12 due to the weak affinity of the single ligands. Moreover, using a multiplexed-multivalent strategy, e.g., including multiple ligands that target different receptors, we can target a specific cell phenotype and increase the selectivity of the carrier toward a particular cell population. Our group has recently shown that we can still use high-affinity ligands and engineer the drug carrier surface, lowering the overall affinity of the carrier by including a repulsive element that shields the ligands.13
The scavenger receptor class B member 1 (SRB1) and scavenger receptor class B member 3 (CD36) can be targeted using PMPC-decorated polymersomes (PMPC Psomes). The high-affinity interactions of PMPC Psomes to SRB1 and CD36 are due to the phosphorylcholine groups (PC) present in the PMPC chains, which induces their internalization via endocytosis in cells.14 Moreover, we have shown that the affinity of PMPC for SRB1 allows Psomes to target M. tuberculosis and S. aureus infected macrophages15 as well cancer cells.16 SRB1 has been associated with CD81, a four-pass transmembrane protein belonging to the tetraspanin family, in the entry mechanism of Plasmodium sporozoites into hepatocytes.17 Tetraspanins play diverse roles in the immune systems and cancer, and they have been described as a receptor for cholesterol.18 Still, there is a need to understand exactly the role of these receptors and how they interact with PMPC Psomes.
Rational drug design relies on single-ligand affinities to describe the interaction of a drug with the cell receptor or target, but in the case of big objects like viruses, small proteins, or nanoparticles, one must consider the repulsive effect and steric hindrance of the cell glycocalyx in the molecular recognition process of the receptors expressed in the cell membrane. Most cells are covered by a complex polysaccharide matrix comprising proteins and complex sugar chains (glycosaminoglycans and glycans), forming the glycocalyx. Post-translation modifications can occur at specific sites on protein backbones at N-linked or O-linked residues by the addition of glycans, altering the physical environment of the cell-surface receptors and modifying nanocarrier affinities.19
This work shows that by taking advantage of very promiscuous binding motifs or ligands, we can selectively target precise cell populations in vivo. We use a multiscale approach, starting from the all-atom molecular modeling of the ligand/receptors (including the receptor glycosylation) involved in the uptake affinity. We then build up a statistical model based on the description of the interactions between the nanocarrier and the targeted cell phenotype (receptor density and glycocalyx). Our model describes the in vitro and in vivo superselective targeting of monocytes using phosphorylcholine-based polymersomes.
Results and Discussion
Receptors Involved in the PMPC Psomes Uptake, In Vitro
We investigated the role of SRB1, CD36, and CD81 on the cellular uptake of PMPC Psomes (PMPC25-PDPA70). We considered three cell types: human primary dermal fibroblasts (HDF), oral carcinoma FaDu cell line, and the human monocytic cell line THP-1. First, we confirmed that all the cell types express the receptors of interest by Western blot. All three cell types highly express CD81 and CD36, while SRB1 expression fluctuates among the cell lines, being less expressed in HDF than in FaDu and THP-1 cells (Figure 1a). The cellular distribution of the receptors is represented in immunofluorescence micrographs (Figure 1b).
Figure 1.

Cellular uptake of PMPC polymersomes. Expression levels of CD36, SRB1, and CD81 in FaDu, HDF, and THP-1 cells were assessed by Western blot relative to GAPDH used as a loading control (a). Immunofluorescence micrographs of all three cell lines with CD36, SRB1, and CD81 labeled (b). Fluorescent-labeled PMPC Psome uptake in FaDu, HDF, and THP-1 cells as a function of time measured by flow cytometry (c). Cytofluorimetry-based quantification of PMPC25–PDPA70 Psome uptake in FaDu, HDF, and THP-1 cells upon treatment with the specific blocking antibodies against SRBI, CD36, and CD81. Experimental error is represented as shaded error bands. (d). PLA quantification was relative to untreated FaDu cells showing the clustering of SRB1, CD36, and CD81 receptors following 1 h incubation with 0.1 mg/mL PMPC25–PDPA70 Psomes (**** P < 0.0001, N = 3) (e).
The uptake kinetics of the PMPC Psomes in all cells is shown in Figure 1c. The cellular uptake
of PMPC Psomes was measured by flow cytometry and fitted as  , where A(t), with a single exponential association model, is the relaxation
time and A(∞) the uptake
at equilibrium. Although PMPC Psome uptake plateaus within 2 h in
all three cell lines, it indicates a strong interaction of the Psomes
with the receptors, higher expression of SRB1 correlates with faster
uptake (Figure 1c).
Our simple association model shows different relaxation times for
the PMPC Psome cellular uptake: τTHP–1 = 7.9
± 2.6 min (THP-1 cells), τFaDu = 19.2 ±
2.3 min (FaDu cells), and τHDF = 54.4 ± 4.1
min (HDF cells). We also determined the role of these receptors in
the cellular uptake of PMPC Psomes using specific antibodies to selectively
block each receptor following 1 h incubation with fluorescent-labeled
PMPC Psomes (Figure 1d). As expected, the Psome uptake was significantly impaired by blocking
CD81 in all cell types, while SRB1 blocking inhibited the Psome uptake
in THP-1 and FaDu but not in HDF cells. On the other hand, CD36 blocking
did not affect any of the three cell types, and only when both CD36
and SRB1 were blocked, we observed an uptake inhibition in all cell
types including the HDF (Figure 1d). This reduction in Psome uptake in HDF resulted
from the synergistic effect of blocking CD36 and SRB1. With the levels
of the receptors in HDF compared to other cell lines kept in mind,
this result suggests that the cellular uptake in HDF is preferentially
through CD36 and CD81. In contrast, carcinoma cells prefer the Psome
cellular uptake through SRB1 and CD81 receptors. Moreover, the multiple
receptor binding is associated with the clustering of receptors and
the hijacking of the endocytic machinery.20,21 To understand the interaction between the three receptors during
PMPC Psome cellular uptake, we performed a proximity ligation assay
(PLA) on FaDu cells.22 After 1 h of incubation
with Psomes, we observed an increase of the PLA signal in all combinations
of receptors (Figure 1e). In physiological conditions, the three receptors are widely distributed
on the surface of the cells and modestly associated with one another.
However, we observed a striking increase in the clustering of SRB1
with both CD36 and CD81 after incubation with PMPC Psomes. This observation
was confirmed using an ad hoc pro algorithm or PLA
image analysis,23 highlighting the significant
clustering of SRB1 with both CD36 and CD81 receptors (Figure 1e).
, where A(t), with a single exponential association model, is the relaxation
time and A(∞) the uptake
at equilibrium. Although PMPC Psome uptake plateaus within 2 h in
all three cell lines, it indicates a strong interaction of the Psomes
with the receptors, higher expression of SRB1 correlates with faster
uptake (Figure 1c).
Our simple association model shows different relaxation times for
the PMPC Psome cellular uptake: τTHP–1 = 7.9
± 2.6 min (THP-1 cells), τFaDu = 19.2 ±
2.3 min (FaDu cells), and τHDF = 54.4 ± 4.1
min (HDF cells). We also determined the role of these receptors in
the cellular uptake of PMPC Psomes using specific antibodies to selectively
block each receptor following 1 h incubation with fluorescent-labeled
PMPC Psomes (Figure 1d). As expected, the Psome uptake was significantly impaired by blocking
CD81 in all cell types, while SRB1 blocking inhibited the Psome uptake
in THP-1 and FaDu but not in HDF cells. On the other hand, CD36 blocking
did not affect any of the three cell types, and only when both CD36
and SRB1 were blocked, we observed an uptake inhibition in all cell
types including the HDF (Figure 1d). This reduction in Psome uptake in HDF resulted
from the synergistic effect of blocking CD36 and SRB1. With the levels
of the receptors in HDF compared to other cell lines kept in mind,
this result suggests that the cellular uptake in HDF is preferentially
through CD36 and CD81. In contrast, carcinoma cells prefer the Psome
cellular uptake through SRB1 and CD81 receptors. Moreover, the multiple
receptor binding is associated with the clustering of receptors and
the hijacking of the endocytic machinery.20,21 To understand the interaction between the three receptors during
PMPC Psome cellular uptake, we performed a proximity ligation assay
(PLA) on FaDu cells.22 After 1 h of incubation
with Psomes, we observed an increase of the PLA signal in all combinations
of receptors (Figure 1e). In physiological conditions, the three receptors are widely distributed
on the surface of the cells and modestly associated with one another.
However, we observed a striking increase in the clustering of SRB1
with both CD36 and CD81 after incubation with PMPC Psomes. This observation
was confirmed using an ad hoc pro algorithm or PLA
image analysis,23 highlighting the significant
clustering of SRB1 with both CD36 and CD81 receptors (Figure 1e).
Thus, the data in Figure 1 demonstrate the role of the SRB1, CD36, and CD81 for PMPC Psome uptake. Moreover, the Psome uptake appears to depend on receptor expression in cells. Indeed, the low levels of SRB1 in HDFs are very likely balanced through the CD36 receptor, which shares several ligands with SRB1.24,25 The uptake kinetics suggests a critical role of SRB1 with a correlation between the uptake rate and the cellular expression in FaDu and THP-1. Finally, the PLA data shows that SRB1 clusters with CD36 and CD81 during the uptake process, suggesting a possible role for the latter.
Modeling the PMPC Binding to SRB1, CD36, and CD81 In Silico
We performed an in silico characterization of the PMPC interaction with the three receptors involved in the PMPC Psome cellular uptake in vitro shown in Figure 1. For each receptor, we built an all-atom model (Figure S1), including all the predicted glycosylations (see Methods) for CD36 and SRB1 (Figure S1, Figure 2c). We assessed the relative interaction affinity of different free PMPC chains (with varying degrees of polymerization, NPC) with the three receptors using docking techniques (see Methods). We computed 3000 binding models, 100 models per receptor at an increasing number of PC units. We report in a swarm plot the relative binding affinity as a function of NPC for SRB1, CD36, and CD81 (Figure 2a). As expected, the binding affinity of PMPC in SRB1 and CD36 is higher than in CD81. Although the predicted overall architecture for CD36 and SRB126 is identical, their amino acid nature composition (Figure S2a) and glycosylation pattern (Figure 2b, Figure S2) differ between the two, influencing their interaction with the PMPC free chain. The oxidized phosphatidylcholine (PC) binding site is well-known in both SRB1 and CD36.27−29 The affinity of PMPC toward both receptors follows the same trend, but chains with a low polymerization degree (NPC = 1 to NPC = 5) occupy different regions in CD36 and SRB1 (Figure S3). In CD36, PMPC (NPC = 1) binds in a deep pocket with the PC motif forming hydrogen bonds with an arginine (R62) and the side chain of a tyrosine (Y78) (Figure S3), while in SRB1, both amino acids are replaced by a phenylalanine (Figure S2), and the interaction is not favorable. Hence, PMPC (NPC = 1) binds in the upper part of the receptor (Figure S3), where its PC motif forms a hydrogen bond with an arginine (R296) (Figure S3). With increasing NPC, the PMPC chain binding site migrates toward the PC binding region described in the literature.30,31 In the maximum affinity configuration in both receptors (Figure 2b), PMPC occupies the maximum volume inside the receptor (Figures 2b and S3). In CD81, the PMPC free chain reaches the maximum number of possible interactions with the surface of the receptor at NPC = 4, and it plateaus at NPC = 8. As shown in Figure 2b, only the top surface of CD81 is exposed to the solvent and available for interaction. We confirmed the stability of the maximum affinity pose for all three receptors using molecular dynamics (see Experimental Methods: Molecular Modeling section). The docking pose (Figure 2b,c) is stable for both CD36 and SRB1 during the microsecond long run (Figure S4). The PC units in SRB1 form only 3 to 4 hydrogen bonds with the receptor during MD (Figure S4b,c), while in the docking pose it exhibits 6 contacts (Figure 2c). The full PMPC (NPC = 5) chain is very stable inside CD36, forming, on average, 1 to 7 hydrogen bonds with the residues in the binding pocket (Figure 2c, Figure S4b,c). Only one PC unit remains fixed (RMSD < 4 Å, Figure S4a,b) inside CD36/SRB1 during the simulation, while the rest of the PC units are exposed to the solvent and have higher mobility. In CD36, the binding pocket is positively charged with several lysines and arginines available for interaction (Figure 2c), while in SRB1, the interactions with positively charged residues are replaced by residues with polar chains like serine or asparagine (Figure S2). In CD81, the docking pose in which PMPC binds to helix A is not stable, and the PMPC chain leaves the binding site (Figure 2d) within 10 ns. The PMPC chain binds and unbinds multiple times throughout the simulation. Nonetheless, the site highlighted in Figure 2d, where PMPC binds to helices C and D, remains stable during more than 400 ns.
Figure 2.

PMPC free chain binding to SRB1, CD36, and CD81 receptors. Autodock vina estimated relative binding affinities are shown as swarm plots at increasing number of PMPC chains (NPC) for SRB1, CD36, and CD81 (a). All-atom depiction of the PMPC free chain (for NPC with highest affinity) binding site, shown as VDW surface in magenta. For CD36 and SRB1, glycans are shown as licorice and their VDW surface is also overlay. The secondary structure of the three receptors is shown as a cartoon in silver. Cellular membrane is indicated in gray. In the CD81 case, two binding modes are depicted (b). PMPC free chain binding site inside CD36 and SRB1 (c). PMPC free chain docking pose versus MD stable pose onto CD81 (d).
We computed the free energy landscape from the 1.5 μs trajectory (Figure 3a); the barrier for binding/unbinding is very low, ∼4 kcal/mol. Interestingly, the unbinding of PMPC from the EC2 induces an allosteric movement of the transmembrane helix 4 (TM4) (Figure 3d), which has only been described recently32 in the absence of cholesterol in the binding site. The observed opening reported enabling the export of cholesterol18 involves the detachment of helix B and involves the recruitment of a partner, CD19.18,33 In our case, the rebinding of the PMPC chain to the EC1 loop induces the opening of the EC2 that displaces helices C and D, increasing the TM4-EC2 angle (Figure 3d), but the receptor is still closed. Rebinding into helices C and D induces a kink in TM4 (Figure 3d,e) that has not been previously described in the literature. This rearrangement or kink of TM4, which resembles the TM6 kink in G protein receptor activation,34 induces a negative curvature in the lipid membrane (Figure 3e) as opposed to the initial flat configuration (Figure 3c), which is compatible with the hypothesis of the CD81 acting as a membrane reshaper, as previously hypothesized for tetraspanin CD9.35 To confirm that the free PMPC chain induces the allosteric movement described in Figure 3, we ran a simulation without PMPC and analyzed the conformational plasticity of the receptor (Figure S5). Both the TM4-EC2 angle and the TM4 kink remain stable during the simulation (Figure S5a). Despite the interaction of the intramembrane helices with the lipids, the extensive allosteric rearrangements observed in the presence of PMPC are not present. The TM4-EC2 angle explores two conformations, 130° and 145°, though the second has a lower population (Figure S5b), which is compatible with the previously investigated closed structured,18,32 while in the presence of PMPC, the observed values for this angle are above 155°. Interestingly, the simulation without PMPC revealed an alternative kink in TM4 (Figure S5c) that induces a positive curvature in the membrane due to the interaction with the lipids, as already hypothesized for tetraspanins.33
Figure 3.

PMPC binding induces CD81 opening and membrane curvature. Conformational landscape explored by the PMPC free chain (NPC = 4) on the surface of CD81. The free-energy landscape is projected onto the distance of the center of mass of the PMPC free chain and the surface of CD81 and the polar angle (described in Figure 2d) (a). Time evolution of the angles describing the allosteric movement induced by PMPC onto the helix TM4 of CD81, colored according to simulation time. The TM4-EC2 angle is highlighted in red and the TM4 kink in lavender (b). Initial membrane curvature represented by the phosphorus atoms of the lipid heads (c). All-atom depiction of CD81 (as white cartoon) and the PMPC chain (magenta surface) along the MD simulation. The TM4 is colored according to simulation time. The angles describing the allosteric movement are indicated in snapshot 1 (TM4-EC2) and 7 (TM4-kink) (d). Final membrane curvature (e).
Partition Function of the Binding of the Single PMPC Chain
Despite the particularities of the interaction pattern for each PMPC chain, we observed that the binding affinity changes non-monotonically with NPC for all three receptors. As one PC unit is bound to its natural site, the other units are forced to interact with the juxtaposing residues giving rise to a cooperative effect, where the number of binding sites, λ, increases with the NPC. We can write, in a first approximation, that λζ ≃ 1 + bζ(NPC – 1) with bζ being an arbitrary constant. Hence as the single PMPC chain binds to SRB1, CD36, or CD81, each interaction of all λ binding sites are within reach of each PC unit, giving rise effectively to a radial topology. If we assume that NPC ≫ λζ and write the partition function between the free PMPC chain and the ζ receptor as
| 1 |
where k is the Boltzmann constant, T is the absolute temperature, EB is the binding energy between the PC unit and its relative site on the receptor surface, and UP/ζ is an energy term that takes into account any steric effects emerging from the chain binding at NPC > 1 and can be approximated as UP/ζ ≃ uζ(NPC – 1) with uζ being the steric repulsion between the nonbound PC units chain and the receptor. From eq 1 we can thus derive the binding energy of the single free PMPC brush to the receptor as
| 2 |
We used eq 2 to fit the average binding affinities for each value calculated via docking, as shown in Figure 2a. Our analytical model describes the binding behavior of PMPC in CD36 and SRB1. The fitting parameters are similar for both CD36 and SRB1, and we observe how for a single chain above NPC = 15 the configurations are no longer attractive; the steric contribution takes over, and the overall affinities are positive. In Figure S3, we illustrate this behavior by superimposing a PMPC25 brush onto the PMPC15 binding mode with the highest affinity for both receptors.
Multivalent and Multiplexed Binding
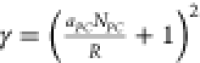
The data above show a good agreement between the estimated avidity and a multivalent binding with linear topology, i.e., a single chain binding to the receptor. However, when assembled into Psomes, the PMPC chains are generally packed to the vesicle surface, each occupying an area per molecule σ0, forming an archetypal Alexander De Gennes polymer brush.36 Each PMPC polymer can be schematized as a multivalent chain comprising NPC units of PC (Figure 4a) and thus with end-to-end to distance H ≃ aPCNPC with aPC being the PMPC monomer length. When the PMPC Psomes approach the cell surface, the chains binding to SRB1, CD36, and CD81 receptors generate steric repulsion (Figure 4a). Indeed, the binding of the first PC unit is very different from the binding of the PC units buried within the polymer brush. Each ζ receptor must insert into the PMPC brush, displacing the chains and giving rise to a steric repulsive potential US/ζ(z) that increases with the insertion distance along the PMPC chain and normal to the Psome surface, and we define it as z. We can approximate the insertion distance as an integer z ∈ [1, ···, NPC], with z = 1 corresponding to the outer layer of the brush, and z = NPC being the inner layer of the brush at the hydrophilic/hydrophobic Psome interface. We can use eq 2 to derive the binding energy for the chain and within the brush as
 |
3 |
Figure 4.

Polymersomes superselectivity. Schematics of the binding between Psomes of radius and SRB1, CD36, and CD81 receptors (a). The fraction of bound Psomes (blue) and the binding energy to FaDu cells per Psome (orange) as a function of the PMPC degree of polymerization, NPC. Note the experimental values were measured from the cellular uptake at 2 h (b).
The new steric potential US/ζ(z) is the consequence of the receptor inserting
into the brush and can be derived by adapting the Halperin model37 as we have previously shown for Psomes.13,38Vζ is the receptor volume, R is the Psome radius, σ0 the area per
chain, and γ is a geometrical parameter that represents the
packing of the chains on a curved surface. For  ,
,  unless γ = 3. Finally, to
account
for the cases when US(z) overcomes the attraction forces we define the binding energy ϵPC/ζ per single PMPC chain to the receptor as
unless γ = 3. Finally, to
account
for the cases when US(z) overcomes the attraction forces we define the binding energy ϵPC/ζ per single PMPC chain to the receptor as
| 4 |
From eq 4, we can now write the partition function for the Psome binding to the receptor ζ as
| 5 |
where  is
the number of PMPC chains per Psome
surface and Nζ is the number of
ζ receptors expressed on the given cell. Even small Psomes comprise
thousands of PMPC chains, and we can always assume NPMPC ≫ Nζ simplifying eq 4 as
is
the number of PMPC chains per Psome
surface and Nζ is the number of
ζ receptors expressed on the given cell. Even small Psomes comprise
thousands of PMPC chains, and we can always assume NPMPC ≫ Nζ simplifying eq 4 as
| 6 |
Finally, most cells have their surface coated with a complex mixture of glycan chains expressed by proteoglycans and glycoproteins, forming the so-called glycocalyx.19 Such a barrier can be as thick as tens of nanometers, and it creates a steric protection that nanoparticles need to overcome before they reach the membrane and infect the cell. The basic proteoglycan unit consists of a “core protein” with one or more covalently attached glycosaminoglycan (GAG) chains. The resulting polymer brush formed by the many GAG chains will repel the polymersomes approaching the cell surface via a steric potential:
| 7 |
The
three receptors here considered are considerably smaller than
the GAG chains; hence  and eq 7 becomes
| 8 |
We can write the total partition function as
| 9 |
and from eq 7 we derive the total energy of binding of single PMPC Psomes to a given cell expressing SRB1, CD36, and CD81 as
| 10 |
We can approximate the Psomes binding to cells as a Langmuir-Hill isotherm13,38,39 and derive the fraction of bound particle, θ, as
| 11 |
where a ≃ π/3 NA[P][3(R + aPCNPC)3 – R3] is the Psome activity within the binding volume with [P] being the Psome bulk concentration and NA the Avogadro number. Note that the angle brackets ⟨...⟩ designate an average over all the possible receptor number Nζ distributions weighted by their Poisson probability.
We exposed FaDu cells to PMPC Psomes formed with PMPC–PDPA copolymers with different polymerization degrees to explore the effect of NPC on cell binding. The uptake kinetics, reported in Figure S6a, show almost no differences for NPC = 12, 19, and 25, and a considerably decreased uptake occurs for NPC = 6. We estimated the corresponding Langmuir-Hill isotherm fraction of bound Psomes39 from the ratio between the four kinetics and the NPC = 25 reported in Figure S6b. We normalized the fluorescence per cell and represent the experimental fraction of bound Psomes, θ, in Figure 4b. For each receptor, we define its relative expression measured by Western blot (Figure 1a) as ϕζ = ϕNζ, with the parameter ϕ being a constant with dimensions [μm–2] and dependent on the cell type alone. The Psomes were produced with average radius, R = 40 nm, and the uptake experiments were performed with bulk concentration [P] = 3.5 × 10⁻¹⁰ M. The area per chain, σ0 = 6.17 nm2 and PC monomer unit length a0 = 0.257 nm, while the receptor volumes can be estimated from the structural data shown in Figures 2 and S2. Finally, the binding energy of the single PC unit, EB, as well as the two semiempirical parameters, uζ and bζ, were calculated from fitting of the docking data (Figure 2a). We can thus fit eq 9 for the experimental fraction of bound Psomes, θ, using the corresponding ϕ. In Figure 4b, we report the fitted experimental fraction of bound Psomes (and experimental data points) and the total binding energy calculated using eq 8 which shows a clear minimum at NPC ∼ 40. This indicates that by increasing the number of PC units we can increase the total avidity up to a certain limit. For NPC > 40, the steric repulsive potential dominates the overall interaction limiting the binding to the first PC unit on the Psome surface.
Influence of the Receptor Glycosylation on the Psome Binding
The PC units that cannot bind any more once the receptor binding site is filled are not the only source of steric repulsion: steric repulsion due to the cell glycocalyx must also be taken into account. We characterize the differences in cell glycocalyx through lectin-binding assay (Figure 5a). Lectin has a high binding affinity for glycoprotein N-acetylglucosamines and has been used to identify the glycocalyx composition.59 We show that the HDF cell line saturates at lower lectin concentrations than FaDu and THP-1, indicating the presence of more sugars in the glycocalyx. In Figure 5b we use the experimental values from Figure 1a to fix the NCD81, NCD36, and NSRB1 for the three different cell lines, to estimate the effect of the Psome radius and the degree of polymerization NPC on the binding energy. Moreover, in Figures 2b and 5c, we can see that both CD36 and SRB1 are highly glycosylated, with 10 glycosylation sites predicted for CD36 and 9 for SRB1, but only N102 is conserved among the two (Figures S1,S2c).
Figure 5.

Influence of glycans on Psome binding. Lectin binding assay to assess the amount of glycans on FaDu, HDF, and THP-1 cells (a). 3D heat maps showing the Psome surface coverage in the three cell lines analyzed, FaDu, HDF, and THP1, as a function of the Psome radius, R, and the PMPC degree of polymerization, NPC. The different panels correspond to different glycan compositions: from top to bottom, the polymerization degree of the branches is increased (b). 100 snapshots taken at 10 ns intervals for glycans depicted as sticks are superimposed onto the van der Waals surface representation of the receptor. The volume occupied by the glycans is highlighted as a semitransparent surface. 100 snapshots of the bound PMPC free chain (NPC = 4) are also depicted as magenta sticks in the binding site. Front and top views of the receptor-free chain complex are provided for SRB1 and CD36. In the bottom panel, a schematic representation of the DNeup5Aca2–6DGalpb1–4DGlcpNAcb1–2DManpa1–6[DNeup5Aca2–6DGalpb1–4DGlcpNAcb1–2DManpa1–3]DManpb1–4DGlcpNAcb1–4DGlcpNAcb1 complex glycans used in the MD simulations together with its all-atom representation and VDW surface (c). Scattered plot of the percentage of the receptor solvent accessible surface area (SASA) hidden by glycans as a function of the glycan radius of gyration for CD36 (blue) and SRB1 (orange). In the mirror axis, the receptor SASA is reported as a solid line (left). The probability density function (PDF) of the receptor volume and the receptor plus glycans extracted from a 1 μs molecular dynamics simulation is reported for CD36 (blue) and SRB1 (orange) (right) (d).
As shown in Figure 5c, the pattern and regions hidden by the glycans are vast and different between the two receptors. The complexity of the glycans present on the surface of the receptor influences both the solvent-accessible surface area (SASA) of the receptor and its volume. In Figure 5d (left), we calculated the percentage of the receptor SASA hidden by glycans as a function of the glycan radius of gyration which dramatically decreases with increasing glycan complexity until the point in which if all glycosylation sites have been modified with very complex long and branched glycans, the surface of the receptor is completely hidden. Interestingly, and due to the position of the glycans, this effect is bigger in CD36 than in SRB1. In Figure 5d (right), we show the probability density function of the receptor and the total system (receptor + glycans) volume during 1 μs of molecular dynamics. Glycans introduce an effective volume Vζ* on the receptor that varies with glycan complexity. The variations of Vζ* significantly affect the binding energy of the Psome to the cell. Especially, the number of branches or antenna of the glycans can completely switch off the interaction with the receptors by hiding it. The degree of polymerization of the glycan affects the morphology of the Psomes that can effectively target the cells, both particle radius and the number of PC units. Glycosylation is one of the most important post-translational modifications of proteins, and it varies during the cell cycle and with the onset of disease. Recently, it has been shown how glycosylation affects viral virulence, not only due to the shedding of the virus and hence helping it to escape the recognition by antibodies but also due to its influence in the binding of the cell receptors.40
The heat maps in Figure 5b show the Psome surface coverage for different N-glycan degrees of polymerization. In HDF cells, only small Psomes (R < 20 nm) are predicted to bind, while bigger Psomes up to ∼60 nm can bind to FaDu and THP-1 cells. By increasing the degree of polymerization of the glycans, Psomes with longer chains are preferred. The binding energy peaks above with NPC = 15–20 for most Psome sizes.
Superselective Targeting of Monocytes, In Vivo
To validate our model prediction in vivo, we injected PMPC Psomes with a degree of polymerization NPC = 25 and radius R = 30 nm (Figure S7). We injected intravenously (i.v.) the PMPC Psomes in mice and observed the cellular uptake in different cells present in the bloodstream by flow cytometry. Even though SRB1 and CD36 are mainly expressed in monocytes (Ly6C+ cells), they can also be found in lymphocytes and granulocytes,15,41 while CD81 is not commonly expressed on red blood cells, granulocytes, or platelets, unlike monocytes and lymphocytes.42 We observed a remarkable selectivity of PMPC Psomes toward monocytes (Ly6C+ cells) after 5 min of i.v. injection, while in lymphocytes, granulocytes, and erythrocytes, less than 10% of Psomes were taken up (Figure 6a,b). There are a few hundred monocytes per μL, 5 orders of magnitude lower than erythrocytes (Figure 6c), showing that PMPC Psomes selectively target monocytes.
Figure 6.

Superselective targeting of monocytes. Blood cells uptake of PMPC–PDPA Psomes measured by flow cytometry (a). Percentage of cells with Psomes (b) and number of cells by type per microliter (c). Violin-plots showing the geometric mean of fluorescence for each receptor in the different blood cell types before i.v. administration of rhodamine-PMPC Psomes or after 1 or 24 h as measured by flow cytometry (N = 5 mice) (d).
Moreover, CD36, SRB1, and CD81 levels were downregulated after 1 h of i.v. injection of PMPC Psomes due to the quick uptake in classical monocytes (Ly6C high). After 24 h, the receptor levels were restored to the same levels as the untreated cells (Figure 6d), while in nonclassical monocytes (Ly6C low), only the SRB1 expression was reduced after 1 h in nonclassical monocytes, and after 24 h, the levels went back to basal levels.
PMPC Psomes enter the cells through the scavenger and tetraspanin receptors especially in monocytes, confirming the selectivity of PMPC Psomes to target monocytes. Moreover, the expression of the receptor after the PMPC Psomes uptake varies at different time points, suggesting a balance between endocytic uptake and recycling of receptors at the cell membrane by restoring their levels ready to participate in a new round of PMPC Psomes endocytosis.
Conclusions
We have shown how one can leverage the promiscuity of a single ligand to target three different receptors in the surface of the cell, designing highly selective multivalent particles (PMPC Psomes) able to target monocytes in vivo. We unveiled in vitro and in silico how PMPC Psomes enter the cells through scavenger (CD36, SRB1) and tetraspanin receptors, with the latter being required for endocytosis. Moreover, we have presented a statistical model describing the particle–cell interaction, leveraging all-atom simulations, and including a key component of the cell: the glycocalyx. Differences in cell-glycocalyx translate into differences in the particle design features, such as particle radius and single-chain polymerization degree, leading to successful binding to the cell. We showed that we can leverage our model to optimize Psomes and selectively target a cell population in the bloodstream: monocytes, which account for 2–8% of the blood cells. Thus, the intrinsic avidity of PMPC Psomes toward immune cells, especially monocytes, can be a helpful therapeutic approach in cancer immunotherapy.
Experimental Methods
Polymersomes Assembly and Characterization
PMPC–PDPA copolymer was synthesized either by atom transfer radical polymerization (ATRP) or by reversible addition–fragmentation chain transfer polymerization according to a previously published protocol,43−45 whereas rhodamine 6G-, Cyanine 3-, and Cy-5 labeled PMPC–PDPA copolymers were always synthesized by ATRP. PMPC–PDPA and rhodamine-labeled PMPC–PDPA assembly was carried out under sterile conditions using the pH-switch method as previously described.46 Briefly, 20 mg of copolymer was dissolved in a 2:1 mixture of chloroform:methanol (Fisher Scientific), followed by its evaporation in a vacuum oven at 60 °C. This results in the deposition of a thin polymeric film on the walls of the vial that was then dissolved with PBS (100 nM) at pH 2.0 for a final 10 mg/mL solution. Self-assembled structures were formed by dropwise addition of 1 M NaOH to the polymer solution, hence increasing the pH over the PDPA pKa (∼6.2) to a final pH of 7.4. This dispersion was then sonicated for 30 min (Sonicor Instrument Corporation) and kept under continuous stirring (200 rpm) for 2 days at room temperature. In order to isolate the vesicular structures from micelles, the dispersion was injected through a hollow fiber with 50 nm pores, using a KrosFlo Research IIi Tangential Flow Filtration System (Spectrum Laboratories, Inc.). Additional Rho-, Cy3-, and Cy5-labeled PMPC–PDPA Psomes used for imaging purposes were produced by the film rehydration method as previously described.47 Here, 10% (w/w) of either Rho- or Cy3- or Cy5-labeled PMPC–PDPA was dissolved together with 25 mg of copolymer in a 2:1 mixture of chloroform/methanol. The solvent is then evaporated in a vacuum oven, and the resulting polymeric thin film was rehydrated with PBS (100 nM) at pH 7.4 to a final concentration of 5 mg/mL. Psomes were formed after this solution was kept under continuous shear stress using magnetic stirring (200 rpm, RT15 power, IKA-Werke GmbH & Co.) for 16 weeks. Finally, Psome dispersions were purified via gel permeation chromatography using a size-exclusion column containing Sepharose 4B and PBS at pH 7.4. Afterward, Psome dispersions were characterized in terms of polymer concentration by HPLC, vesicle size, and morphology by DLS and TEM, respectively (details in Supporting Information). Until further in vitro and in vivo experiments, all the Psome dispersions were stored at 4 °C.
Cells
Squamous carcinoma cell line (FaDu) was cultured in complete Eagle’s minimum essential medium (Sigma) supplemented with 10% (v/v) heat-inactivated fetal bovine serum (Sigma-Aldrich) and 1% (v/v) penicillin–streptomycin (Sigma-Aldrich). Human leukemia monocytes (THP-1) were cultured and maintained in RPM1-1640 supplemented with 10% (v/v) heat-inactivated fetal bovine serum (Sigma-Aldrich) and 1% (v/v) penicillin–steptomycin (Sigma-Aldrich). These two cell lines were obtained from American Type culture collection (ATCC). Human dermal fibroblast (HDF) cell line was purchased by Sigma and cultured in complete Fibroblast Basal Medium (Lonza) with 1% (v/v) penicillin–streptomycin.
Western Blot Analysis
Cell lysates were prepared using lysis buffer (RIPA buffer, Sigma) with protease inhibitors (Sigma) and collected using a cell scraper and kept on ice for 30 min. Then, the lysates were centrifuged at 13 000 rpm for 15 min, and supernatants were collected. Bradford assay (BioRad) was performed to assess the protein concentrations, and 4× laemmli sample buffer was added to the cell lysates and boiled for 5 min at 95 °C. 30 μg of protein was loaded per lane in a polyacrylamide gel and run for 120 min at 120 V. The PVDF membranes (BioRad) were used to transfer the proteins from the gel for 90 min at 4 °C and 100 V. The membranes were previously stained with ponceau S and then blocked with 5% nonfat milk in TBST for 1 h and incubated with anti-SRB1 (#ab6942), anti-CD36 and anti-CD81 (Abcam), and GAPDH (Cell signaling) overnight at 4 °C. For detection on the LI-COR Odyssey (LI-COR, Germany), a goat anti-rabbit IgG, Dylight 800 4xPEG, and goat anti-mouse IgG, Dylight 7004xPEG (Invitrogen) were used. All densitometry analyses were performed by using ImageJ.
Immunofluorescence
Cells were seeded in IBIDI chamber at a cell density of 5 × 10⁴ for 24 h. Then, cells were washed with PBS, fixed in 4% (w/v) PFA for 10 min, permeabilized with 0.1% (w/v) Triton X-100 in PBS for 5 min, and block with 5% (w/v) BSA in PBS for 1 h at RT. Cells were then incubated with primary antibodies for SRB1 (1:1000, #NB400-104, Novus), CD36 (1:1000, #NB400-145, Novus), and CD81 (1:100, #sc-166029, Santa Cruz) diluted in 1% (w/v) BSA in PBS overnight at 4 °C in a humidity chamber. Thereafter, cells were washed four times with PBS and incubated with the corresponding secondary antibody for 1 h at RT (Dylight donkey anti-mouse 647 #406629, Dylight donkey anti-rabbit 647#406410). Nuclei were counterstained by Hoechst 33342 (Tocris #5117) for 10 min. Cells were imaged at 63× using Leica TCS SP8 confocal microscope (Leica Microsystems) and analyzed with imageJ software (ver. 2.0).
FACs Analysis
Polymersome uptake was analyzed by flow cytometry in different cell lines. In brief, cells were plated at 2.5 × 10⁵ in a 6 well plate for 24 h and then incubated with Rho-PMPC-PDPA polymersomes for different incubation periods (10 min to 2 h). After PBS washing and centrifugation, cell pellets were resuspended in 2% (v/v) PFA in PBS and analyzed by FACs Fortessa (BD). Acquired data were analyzed using flowJo software.
Proximity Ligation Assay
PLA assay uses specific antibodies for two proteins of interest that are recognized by secondary antibodies conjugated with DNA primers. Upon proximity-mediated hybridization, these secondary antibodies produce a fluorescent signal that can be imaged and quantified.22 However, hybridization can only happen if the proteins of interest are ∼20 nm; hence any fluorescence signal is the result of a close proximity of the two proteins of interest. FaDu cells were plated in IBIDI u-slide (#80826, IBIDI) and incubated for 1 h with Cy5-PMPC-PDPA Psomes. After that, cells were washed with PBS and fixed with 3.7% PFA for 10 min. Scavenger receptors (SRB1 and CD36) and CD81 were colabeled by using primary antibodies (anti-SRB1, Novus Biologicals; anti-CD36, Abcam; anti-CD81, Santa Cruz). The proximity ligation assay was performed using Duolink in situ kit (Sigma) according to the manufacturer’s instructions. Images were randomly collected by confocal microscopy. PLA data were quantitatively analyzed using a Python script based on Trackpy, modified for identification of particles with high polydispersity in the direction of objective translation (“z”). A 3-pixel median filter was applied to remove salt and pepper noise, and a low-pass Gaussian filter was applied to remove large-scale features present due to channel crosstalk and optical aberrations. Local maxima were identified and linked into single particles by hierarchical clustering using the Nearest Point Algorithm as implemented in scipy. Data were reported as a number of detectable PLA events (“dots”) per nucleus.
Lectin Binding by FACs
The DC2.4, THP1-macrophages, FaDu, and HDF cells were incubated with different concentrations of fluorescein isothiocyanate (FITC)-labeled lectin from Lycopersicon esculentum (Sigma L0401) for 30 min at 37 °C. After that, cells were washed with PBS twice and centrifuged for 5 min at 1200 rpm and the cell pellet resuspended in 2% PFA/PBS. The specific binding of lectin in different cells was assessed by FACs.
Molecular Modeling
CD36 (gene CD36, UniProtKB - P16671 (CD36_HUMAN)) and SRB1 (gene SCARB1, UniProtKB - Q8WTV0 (SCRB1_HUMAN)) structures were constructed using the 3.0 Å resolution crystal structure of the lysosomal domain of limp-2 (PDBid 4F7B) as a template in the Robetta web server (https://robetta.bakerlab.org). For CD81 (gene CD81, UniProtKB - P60033 (CD81_HUMAN)), we used the available 2.96 Å resolution crystal structure, PDBid 5TCX, obtained from the PDB databank PDBids 4F7B and 5TCX. SRB1 and CD36 were glycosylated using the glycoprotein server Glycam, high-manose complex glycans (DNeup5Aca2–6DGalpb1–4DGlcpNAcb1–2DManpa1–6[DNeup5Aca2–6DGalpb1–4DGlcpNAcb1–2DManpa1–3]DManpb1–4DGlcpNAcb1–4DGlcpNAcb1-OME). The poly(2-methacryloyloxyethyl phosphorylcholine) monomer partial atomic charges were evaluated according to the RESP approach:48 the molecule was first optimized at the HF/6-31G(d) level, up to a convergence in energy of 10–5 au, using the Gaussian09 package.49 Atomic RESP charges were derived from the electrostatic potential using the antechamber module of the AMBER package as well as GAFF parameters.50,51 Different polymerization degree PMPC molecules were constructed and minimized using Amber20 and AmberTools20.52 For all three receptors and different polymerization degree PMPC molecules, we performed docking experiments with a fixed grid of 40 × 40 × 40 centered in the center of mass of the receptor, except for CD81 for which only the solvent-exposed region was considered. Docking calculations were performed with Autodock-vina.1.1.253 with default parameters. One hundred models were generated for each receptor/PMPC-N (N = 1,2,3,4,5,6,8,10,15,25), 3000 models in total. For the best pose, 2D-interaction maps were calculated using LigPlot+.54
The docking maximum affinity poses were simulated using molecular dynamics. CD36 and SRB1 in complex with PMPC (NPC = 5) were simulated in a 150 mMKCl solution using charmm36m55 in GROMACS2019.3.56 CD81 was simulated in a plasma membrane containing cholesterol, phosphoglycerides (PS,PE,PC,PI), sphingomyelin (SM), and glycolipids (GM) in a 150 mM KCl solution using charmm36m55 and GROMACS2019.3.56 The membrane systems were created using the membrane builder of CHARMM-GUI.57 Molecular modeling figures, root-mean-square deviations, and angles were measured/created using the visual molecular dynamics suite.58
In Vivo (Mice) Biodistribution of Polymersomes in Bloodstream
Three-month-old male C57/BL6 mice were intravenously (i.v.) injected via the tail vein with 10 mg/kg rhodamine labeled PMPC-PDPA polymersomes (mice = 5 per group). Control mice were i.v. injected with saline. The volume of solution injected was 8% of the total blood volume (TBV). TBV was calculated as 58.5 mL of blood per kg of body weight. At 0.16, 0.5, 1, 2, 4, 6, 24, and 168 h post-injection, the mice were terminally anaesthetized, and blood samples were collected through cardiac puncture. The plasma concentration of Psomes was measured after centrifugation of the whole blood at different time intervals. To determine the interactions of fluorescence-labeled Psomes with different types of mouse blood cells, such as lymphocytes, monocytes, granulocytes, and red blood cells, we separated the different fractions using an untouched neutrophil isolation kit, Murine Peripheral Blood Neutrophil Isolation – Easysep kit and Easyplate magnet.
All procedures involving animals were approved by and conformed to the guidelines of the Institutional Animal Care Committee of The University of Sheffield, University College London, and University of Ghent. We have taken great efforts to reduce the number of animals used in these studies and also taken effort to reduce animal suffering from pain and discomfort.
Acknowledgments
We would like to thank Dr I. Canton for useful discussion at the early stages of the work that helped to identify the receptors. We thank the Children with Cancer UK (16-227) for SAG and ES salaries, the EPSRC (EP/R024723/1) for DM salaries, the ERC (CheSSTaG 769798) for JF and part of GB salary, the EPSRC (EP/G062137/1) for JM salary. MAO thanks the BBSRC doctoral training grant Sheffield for her PhD studentship. JG thanks the DFG for sponsoring his fellowship. VMG thanks the received financial support from Fundação para a Ciência e Tencnologia (PD/BD/128388/2017). ADC and LR thank the Marie Skłodowska Curie program for sponsoring their fellowship. GB thanks the EPSRC (EP/N026322/1) for his personal fellowship.
Supporting Information Available
The Supporting Information is available free of charge at https://pubs.acs.org/doi/10.1021/acscentsci.2c00146.
Additional figures supporting the molecular modeling. Experimental data on Psome uptake kinetics on FaDu cells. Additional experimental details on polymersome characterization, including transmission electron microscopy images and dynamic light scattering (DLS). Photographs of experimental setup (PDF)
Author Contributions
S.A.G. designed and performed the in silico research, analyzed the data, and wrote and edited the manuscript. D.M. performed part of the in vitro data and analysis; wrote and edited the manuscript. M.A.O. performed some of the in vitro experiments. V.M.G. produced the polymersomes. E.S. performed part of the in vivo experiments. J.F. performed the P.L.A. analysis. C.C. and A.D.C. synthesized the PDPA–PMPC polymer. L.R. designed research and performed some in vitro and in vivo experiments. G. B. designed and conceived the research, and the statistical model, analyzed the data, and wrote and edited the manuscript.
The authors declare no competing financial interest.
Supplementary Material
References
- Langer R. New Methods of Drug Delivery. Science 1990, 249, 1527–1533. 10.1126/science.2218494. [DOI] [PubMed] [Google Scholar]
- Moghimi S. M.; Kissel T. Particulate nanomedicines. Adv. Drug Deliv Rev. 2006, 58 (14), 1451–5. 10.1016/j.addr.2006.09.010. [DOI] [PubMed] [Google Scholar]
- Farokhzad O. C.; Langer R. Impact of Nanotechnology on Drug Delivery. ACS Nano 2009, 3 (1), 16–20. 10.1021/nn900002m. [DOI] [PubMed] [Google Scholar]
- Cheng Z.; al Zaki A.; Hui J. Z.; Muzykantov V. R.; Tsourkas A. Multifunctional Nanoparticles: Cost Versus Benefit of Adding Targeting and Imaging Capabilities. Science 2012, 338, 903–910. 10.1126/science.1226338. [DOI] [PMC free article] [PubMed] [Google Scholar]
- Akinc A.; Battaglia G. Exploiting endocytosis for nanomedicines. Cold Spring Harb Perspect Biol. 2013, 5 (11), a016980. 10.1101/cshperspect.a016980. [DOI] [PMC free article] [PubMed] [Google Scholar]
- Fullstone G.; Nyberg S.; Tian X.; Battaglia G. From the Blood to the Central Nervous System: A Nanoparticle’s Journey Through the Blood-Brain Barrier by Transcytosis. Int. Rev. Neurobiol 2016, 130, 41–72. 10.1016/bs.irn.2016.06.001. [DOI] [PubMed] [Google Scholar]
- Mammen M.; Choi S.-K.; Whitesides G. M. Polyvalent Interactions in Biological Systems Implications for Design and Use of Multivalent Ligands and Inhibitors. Angew. Chem., Int. Ed. 1998, 37, 2754–2794. . [DOI] [PubMed] [Google Scholar]
- Kitov P. I.; Bundle D. R. On the Nature of the Multivalency Effect: A Thermodynamic Model. J. Am. Chem. Soc. 2003, 125, 16271–16284. 10.1021/ja038223n. [DOI] [PubMed] [Google Scholar]
- Kiessling L. L., Lamanna A. C.. Multivalency in Biological Systems. In Chemical Probes in Biology; Springer: Dordrecht, 2003; Vol. 129. [Google Scholar]
- Carlson C. B.; Mowery P.; Owen R. M.; Dykhuizen E. C.; Kiessling L. L. Selective Tumor Cell Targeting Using Low Affinity, Multivalent Interactions. ACS Chem. Biol. 2007, 2 (2), 119–127. 10.1021/cb6003788. [DOI] [PubMed] [Google Scholar]
- Martinez-Veracoechea F. J.; Frenkel D. Designing super selectivity in multivalent nano-particle binding. Proc. Natl. Acad. Sci. U. S. A. 2011, 108 (27), 10963–8. 10.1073/pnas.1105351108. [DOI] [PMC free article] [PubMed] [Google Scholar]
- Angioletti-Uberti S. Exploiting Receptor Competition to Enhance Nanoparticle Binding Selectivity. Phys. Rev. Lett. 2017, 118 (6), 068001. 10.1103/PhysRevLett.118.068001. [DOI] [PubMed] [Google Scholar]
- Tian X.; Angioletti-Uberti S.; Battaglia G. On the design of precision nanomedicines. Sci. Adv. 2020, 6, 1. 10.1126/sciadv.aat0919. [DOI] [PMC free article] [PubMed] [Google Scholar]
- Massignani M.; LoPresti C.; Blanazs A.; Madsen J.; Armes S. P.; Lewis A. L.; Battaglia G. Controlling cellular uptake by surface chemistry, size, and surface topology at the nanoscale. Small 2009, 5 (21), 2424–32. 10.1002/smll.200900578. [DOI] [PubMed] [Google Scholar]
- Fenaroli F.; Robertson J. D.; Scarpa E.; Gouveia V. M.; Di Guglielmo C.; De Pace C.; Elks P. M.; Poma A.; Evangelopoulos D.; Canseco J. O.; Prajsnar T. K.; Marriott H. M.; Dockrell D. H.; Foster S. J.; McHugh T. D.; Renshaw S. A.; Marti J. S.; Battaglia G.; Rizzello L. Polymersomes Eradicating Intracellular Bacteria. ACS Nano 2020, 14 (7), 8287–8298. 10.1021/acsnano.0c01870. [DOI] [PMC free article] [PubMed] [Google Scholar]
- Colley H. E.; Hearnden V.; Avila-Olias M.; Cecchin D.; Canton I.; Madsen J.; MacNeil S.; Warren N.; Hu K.; McKeating J. A.; Armes S. P.; Murdoch C.; Thornhill M. H.; Battaglia G. Polymersome-mediated delivery of combination anticancer therapy to head and neck cancer cells: 2D and 3D in vitro evaluation. Mol. Pharmaceutics 2014, 11 (4), 1176–88. 10.1021/mp400610b. [DOI] [PubMed] [Google Scholar]
- Yalaoui S.; Zougbede S.; Charrin S.; Silvie O.; Arduise C.; Farhati K.; Boucheix C.; Mazier D.; Rubinstein E.; Froissard P. Hepatocyte permissiveness to Plasmodium infection is conveyed by a short and structurally conserved region of the CD81 large extracellular domain. PLoS Pathog 2008, 4 (2), e1000010. 10.1371/journal.ppat.1000010. [DOI] [PMC free article] [PubMed] [Google Scholar]
- Zimmerman B.; Kelly B.; McMillan B. J.; Seegar T. C. M.; Dror R. O.; Kruse A. C.; Blacklow S. C. Crystal Structure of a Full-Length Human Tetraspanin Reveals a Cholesterol-Binding Pocket. Cell 2016, 167 (4), 1041–1051. 10.1016/j.cell.2016.09.056. [DOI] [PMC free article] [PubMed] [Google Scholar]
- Reily C.; Stewart T. J.; Renfrow M. B.; Novak J. Glycosylation in health and disease. Nat. Rev. Nephrol 2019, 15 (6), 346–366. 10.1038/s41581-019-0129-4. [DOI] [PMC free article] [PubMed] [Google Scholar]
- Syed G. H.; Amako Y.; Siddiqui A. Hepatitis C virus hijacks host lipid metabolism. Trends Endocrinol Metab 2010, 21 (1), 33–40. 10.1016/j.tem.2009.07.005. [DOI] [PMC free article] [PubMed] [Google Scholar]
- Boulant S.; Stanifer M.; Lozach P. Y. Dynamics of virus-receptor interactions in virus binding, signaling, and endocytosis. Viruses 2015, 7 (6), 2794–815. 10.3390/v7062747. [DOI] [PMC free article] [PubMed] [Google Scholar]
- Fredriksson S.; Gullberg M.; Jarvius J.; Olsson C.; Pietras K.; Gustafsdottir S. M.; Ostman A.; Landegren U. Protein detection using proximity-dependent DNA ligation assays. Nat. Biotechnol. 2002, 20, 473. 10.1038/nbt0502-473. [DOI] [PubMed] [Google Scholar]
- Tian X.; Leite D. M.; Scarpa E.; Nyberg S.; Fullstone G.; Forth J.; Matias D.; Apriceno A.; Poma A.; Duro-Castano A.; Vuyyuru M.; Harker-Kirschneck L.; Saric A.đe.; Zhang Z.; Xiang P.; Fang B.; Tian Y.; Luo L.; Rizzello L.; Battaglia G. On the shuttling across the blood-brain barrier via tubule formation: Mechanism and cargo avidity bias. Science Advances 2020, 6, eabc4397. 10.1126/sciadv.abc4397. [DOI] [PMC free article] [PubMed] [Google Scholar]
- Febbraio M.; Hajjar D. P.; Silverstein R. L. CD36: a class B scavenger receptor involved in angiogenesis, atherosclerosis, inflammation, and lipid metabolism. J. Clin. Invest. 2001, 108 (6), 785–791. 10.1172/JCI14006. [DOI] [PMC free article] [PubMed] [Google Scholar]
- Glatz J. F. C.; Luiken J. Dynamic role of the transmembrane glycoprotein CD36 (SR-B2) in cellular fatty acid uptake and utilization. J. Lipid Res. 2018, 59 (7), 1084–1093. 10.1194/jlr.R082933. [DOI] [PMC free article] [PubMed] [Google Scholar]
- Neculai D.; Schwake M.; Ravichandran M.; Zunke F.; Collins R. F.; Peters J.; Neculai M.; Plumb J.; Loppnau P.; Pizarro J. C.; Seitova A.; Trimble W. S.; Saftig P.; Grinstein S.; Dhe-Paganon S. Structure of LIMP-2 provides functional insights with implications for SR-BI and CD36. Nature 2013, 504 (7478), 172–6. 10.1038/nature12684. [DOI] [PubMed] [Google Scholar]
- Boullier A.; Gillotte K. L.; Horkko S.; Green S. R.; Friedman P.; Dennis E. A.; Witztum J. L.; Steinberg D.; Quehenberger O. The binding of oxidized low density lipoprotein to mouse CD36 is mediated in part by oxidized phospholipids that are associated with both the lipid and protein moieties of the lipoprotein. J. Biol. Chem. 2000, 275 (13), 9163–9. 10.1074/jbc.275.13.9163. [DOI] [PubMed] [Google Scholar]
- Gillotte-Taylor K.; Boullier A.; Witztum J. L.; Steinberg D.; Quehenberger O. Scavenger receptor class B type I as a receptor for oxidized low density lipoprotein. J. Lipid Res. 2001, 42 (9), 1474–1482. 10.1016/S0022-2275(20)30281-9. [DOI] [PubMed] [Google Scholar]
- Engelmann B.; Wiedmann M. K. Cellular phospholipid uptake: flexible paths to coregulate the functions of intracellular lipids. Biochim. Biophys. Acta 2010, 1801 (6), 609–16. 10.1016/j.bbalip.2010.02.013. [DOI] [PubMed] [Google Scholar]
- Valacchi G.; Sticozzi C.; Lim Y.; Pecorelli A. Scavenger receptor class B type I: a multifunctional receptor. Ann. N.Y. Acad. Sci. 2011, 1229, E1–7. 10.1111/j.1749-6632.2011.06205.x. [DOI] [PubMed] [Google Scholar]
- Tian K.; Xu Y.; Sahebkar A.; Xu S. CD36 in Atherosclerosis: Pathophysiological Mechanisms and Therapeutic Implications. Curr. Atheroscler Rep 2020, 22 (10), 59. 10.1007/s11883-020-00870-8. [DOI] [PubMed] [Google Scholar]
- Palor M.; Stejskal L.; Mandal P.; Lenman A.; Alberione M. P.; Kirui J.; Moeller R.; Ebner S.; Meissner F.; Gerold G.; Shepherd A. J.; Grove J. Cholesterol sensing by CD81 is important for hepatitis C virus entry. J. Biol. Chem. 2020, 295 (50), 16931–16948. 10.1074/jbc.RA120.014761. [DOI] [PMC free article] [PubMed] [Google Scholar]
- Susa K. J.; Rawson S.; Kruse A. C.; Blacklow S. C. Cryo-EM structure of the B cell co-receptor CD19 bound to the tetraspanin CD81. Science 2021, 371, 300–305. 10.1126/science.abd9836. [DOI] [PMC free article] [PubMed] [Google Scholar]
- Hilger D.; Kumar K. K.; Hu H.; Pedersen M. F.; O’Brien E. S.; Giehm L.; Jennings C.; Eskici G.; Inoue A.; Lerch M.; Mathiesen J. M.; Skiniotis G.; Kobilka B. K. Structural insights into differences in G protein activation by family A and family B GPCRs. Science 2020, 369 (6503), 1. 10.1126/science.aba3373. [DOI] [PMC free article] [PubMed] [Google Scholar]
- Umeda R.; Satouh Y.; Takemoto M.; Nakada-Nakura Y.; Liu K.; Yokoyama T.; Shirouzu M.; Iwata S.; Nomura N.; Sato K.; Ikawa M.; Nishizawa T.; Nureki O. Structural insights into tetraspanin CD9 function. Nat. Commun. 2020, 11 (1), 1606. 10.1038/s41467-020-15459-7. [DOI] [PMC free article] [PubMed] [Google Scholar]
- Smart T. P.; Mykhaylyk O. O.; Ryan A. J.; Battaglia G. Polymersomes hydrophilic brush scaling relations. Soft Matter 2009, 5 (19), 3607. 10.1039/b908731a. [DOI] [Google Scholar]
- Leckband D.; Sheth S.; Halperin A. Grafted poly(ethylene oxide) brushes as nonfouling surface coatings. J. Biomater Sci. Polym. Ed 1999, 10 (10), 1125–47. 10.1163/156856299X00720. [DOI] [PubMed] [Google Scholar]
- Liu M.; Apriceno A.; Sipin M.; Scarpa E.; Rodriguez-Arco L.; Poma A.; Marchello G.; Battaglia G.; Angioletti-Uberti S. Combinatorial entropy behaviour leads to range selective binding in ligand-receptor interactions. Nat. Commun. 2020, 11 (1), 4836. 10.1038/s41467-020-18603-5. [DOI] [PMC free article] [PubMed] [Google Scholar]
- Langmuir I. The Adsorption of Gases on Plane Surfaces of Glass, Mica and Platinum. J. Am. Chem. Soc. 1918, 40, 1361. 10.1021/ja02242a004. [DOI] [Google Scholar]
- Leite D. M.; Matias D.; Battaglia G. The Role of BAR Proteins and the Glycocalyx in Brain Endothelium Transcytosis. Cells 2020, 9, 2685. 10.3390/cells9122685. [DOI] [PMC free article] [PubMed] [Google Scholar]
- Acosta-Gutiérrez S.; Buckley J.; Battaglia G. The role of host cell glycans on virus infectivity: The SARS-CoV-2 case. bioRxiv 2021, 1. 10.1101/2021.05.08.443212. [DOI] [PMC free article] [PubMed] [Google Scholar]
- Zheng Z.; Ai J.; Guo L.; Ye X.; Bondada S.; Howatt D.; Daugherty A.; Li X. A. SR-BI (Scavenger Receptor Class B Type 1) Is Critical in Maintaining Normal T-Cell Development and Enhancing Thymic Regeneration. Arterioscler Thromb Vasc Biol. 2018, 38 (11), 2706–2717. 10.1161/ATVBAHA.118.311728. [DOI] [PMC free article] [PubMed] [Google Scholar]
- Vences-Catalan F.; Kuo C. C.; Rajapaksa R.; Duault C.; Andor N.; Czerwinski D. K.; Levy R.; Levy S. CD81 is a novel immunotherapeutic target for B cell lymphoma. J. Exp Med. 2019, 216 (7), 1497–1508. 10.1084/jem.20190186. [DOI] [PMC free article] [PubMed] [Google Scholar]
- Du J.; Tang Y.; Lewis A. L.; Armes S. P. pH-Sensitive Vesicles Based on a Biocompatible Zwitterionic Diblock Copolymer. J. Am. Chem. Soc. 2005, 127, 17982–17983. 10.1021/ja056514l. [DOI] [PubMed] [Google Scholar]
- Madsen J.; Warren N. J.; Armes S. P.; Lewis A. L. Synthesis of rhodamine 6G-based compounds for the ATRP synthesis of fluorescently labeled biocompatible polymers. Biomacromolecules 2011, 12 (6), 2225–34. 10.1021/bm200311s. [DOI] [PubMed] [Google Scholar]
- Pearson R. T.; Warren N. J.; Lewis A. L.; Armes S. P.; Battaglia G. Effect of pH and Temperature on PMPC–PDPA Copolymer Self-Assembly. Macromolecules 2013, 46 (4), 1400–1407. 10.1021/ma302228m. [DOI] [Google Scholar]
- Gouveia V. M.; Rizzello L.; Vidal B.; Nunes C.; Poma A.; Lopez-Vasquez C.; Scarpa E.; Brandner S.; Oliveira A.; Fonseca J. E.; Reis S.; Battaglia G. Targeting Macrophages and Synoviocytes Intracellular Milieu to Augment Anti-Inflammatory Drug Potency. Advanced Therapeutics 2022, 5, 2270005. 10.1002/adtp.202270005. [DOI] [Google Scholar]
- Gouveia V. M.; Rizzello L.; Nunes C.; Poma A.; Ruiz-Perez L.; Oliveira A.; Reis S.; Battaglia G. Macrophage Targeting pH Responsive Polymersomes for Glucocorticoid Therapy. Pharmaceutics 2019, 11 (11), 614. 10.3390/pharmaceutics11110614. [DOI] [PMC free article] [PubMed] [Google Scholar]
- Bayly C. I.; Ciplak P.; Cornell W.; Kollman P. A. A Well-Behaved Electrostatic Potential Based Method Using Charge Restraints for Deriving Atomic Charges: The RESP MOdel. J. Phys. Chem. 1993, 97, 10269–10280. 10.1021/j100142a004. [DOI] [Google Scholar]
- Frisch M. J.; Trucks G. W.; Schlegel H. B.; Scuseria G. E.; Robb M. A.; Cheeseman J. R.; Scalmani G.; Barone V.; Petersson G. A.; Nakatsuji H.; Li X.; Caricato M.; Marenich A.; Bloino J.; Janesko B. G.; Gomperts R.; Mennucci B.; Hratchian H. P.; Ortiz J. V.; Izmaylov A. F.; Sonnenberg J. L.; Williams-Young D.; Ding F.; Lipparini F.; Egidi F.; Goings J.; Peng B.; Petrone A.; Henderson T.; Ranasinghe D.; Zakrzewski V. G.; Gao J.; Rega N.; Zheng G.; Liang W.; Hada M.; Ehara M.; Toyota K.; Fukuda R.; Hasegawa J.; Ishida M.; Nakajima T.; Honda Y.; Kitao O.; Nakai H.; Vreven T.; Throssell K.; Montgomery J. A Jr.; Peralta J. E.; Ogliaro F.; Bearpark M.; Heyd J. J.; Brothers E.; Kudin K. N.; Staroverov V. N.; Keith T.; Kobayashi R.; Normand J.; Raghavachari K.; Rendell A.; Burant J. C.; Iyengar S. S.; Tomasi J.; Cossi M.; Millam J. M.; Klene M.; Adamo C.; Cammi R.; Ochterski J. W; Martin R. L.; Morokuma K.; Farkas O.; Foresman J. B.; Fox D. J.. Gaussian 09, Revision A.02; Gaussian, Inc.: Wallingford, CT, 2016.
- Wang J.; Wolf R. M.; Caldell J. W.; Kollman P. A.; Case D. A. Development and Testing of a General Amber Force Field. J. Comput. Chem. 2004, 25 (9), 1157. 10.1002/jcc.20035. [DOI] [PubMed] [Google Scholar]
- Wang J.; Wang W.; Kollman P. A.; Case D. A. Automatic atom type and bond type perception in molecular mechanical calculations. J. Mol. Graph Model 2006, 25 (2), 247–60. 10.1016/j.jmgm.2005.12.005. [DOI] [PubMed] [Google Scholar]
- Case D. A.; Belfon K.; Ben-Shalom I. Y.; Brozell S.R.; Cerutti D. S.; Cheatham T. E. III; Cruzeiro V. W. D.; Darden T. A.; Duke R. E.; Giambasu G.; Gilson M. K.; Gohlke H.; Goetz A. W.; Harris R.; Izadi S.; Izmailov S. A.; Jin C.; Kasavajhala K.; Kaymak M. C.; King E.; Kovalenko A.; Kurtzman T.; Lee T. S.; LeGrand S.; Li P.; Lin C.; Liu J.; Luchko T.; Luo R.; Machado M.; Man V.; Manathunga M.; Merz K. M.; Miao Y.; Mikhailovskii O.; Monard G.; Nguyen H.; O’Hearn K. A.; Onufriev A.; Pan F.; Pantano S.; Qi R.; Rahnamoun A.; Roe D. R.; Roitberg A.; Sagui C.; Schott-Verdugo S.; Shen J.; Simmerling C. L.; Skrynnikov N. R.; Smith J.; Swails J.; Walker R. C.; Wang J.; Wei H.; Wolf R. M.; Wu X.; Xue Y.; York D. M.; Zhao S.; Kollman P. A.. Amber 2021; University of California, San Francisco, 2021. [Google Scholar]
- Trott O.; Olson A. J. AutoDock Vina: improving the speed and accuracy of docking with a new scoring function, efficient optimization, and multithreading. J. Comput. Chem. 2009, 31 (2), 455–61. 10.1002/jcc.21334. [DOI] [PMC free article] [PubMed] [Google Scholar]
- Laskowski R. A.; Swindells M. B. LigPlot+: multiple ligand-protein interaction diagrams for drug discovery. J. Chem. Inf Model 2011, 51 (10), 2778–86. 10.1021/ci200227u. [DOI] [PubMed] [Google Scholar]
- Huang J.; Rauscher S.; Nawrocki G.; Ran T.; Feig M.; de Groot B. L.; Grubmuller H.; MacKerell A. D. Jr. CHARMM36m: an improved force field for folded and intrinsically disordered proteins. Nat. Methods 2017, 14 (1), 71–73. 10.1038/nmeth.4067. [DOI] [PMC free article] [PubMed] [Google Scholar]
- Abraham M. J.; Murtola T.; Schulz R.; Páll S.; Smith J. C.; Hess B.; Lindahl E. GROMACS: High performance molecular simulations through multi-level parallelism from laptops to supercomputers. SoftwareX 2015, 1–2, 19–25. 10.1016/j.softx.2015.06.001. [DOI] [Google Scholar]
- Lee J.; Patel D. S.; Stahle J.; Park S. J.; Kern N. R.; Kim S.; Lee J.; Cheng X.; Valvano M. A.; Holst O.; Knirel Y. A.; Qi Y.; Jo S.; Klauda J. B.; Widmalm G.; Im W. CHARMM-GUI Membrane Builder for Complex Biological Membrane Simulations with Glycolipids and Lipoglycans. J. Chem. Theory Comput 2019, 15 (1), 775–786. 10.1021/acs.jctc.8b01066. [DOI] [PubMed] [Google Scholar]
- Humphrey W.; Dalke A.; Schulten K. VMD: Visual Molecular Dynamics. J. Mol. Graphics 1996, 14, 33–38. 10.1016/0263-7855(96)00018-5. [DOI] [PubMed] [Google Scholar]
Associated Data
This section collects any data citations, data availability statements, or supplementary materials included in this article.