

Abstract

We present a new open-source, machine learning (ML) enhanced computational method for experimentalists to quickly analyze high-throughput small-angle scattering results from multicomponent nanoparticle mixtures and solutions at varying compositions and concentrations to obtain reconstructed 3D structures of the sample. This new method is an improvement over our original computational reverse-engineering analysis for scattering experiments (CREASE) method (ACS Materials Au 2021, 1 (2 (2), ), 140−156), which takes as input the experimental scattering profiles and outputs a 3D visualization and structural characterization (e.g., real space pair-correlation functions, domain sizes, and extent of mixing in binary nanoparticle mixtures) of the nanoparticle mixtures. The new gene-based CREASE method reduces the computational running time by >95% as compared to the original CREASE and performs better in scenarios where the original CREASE method performed poorly. Furthermore, the ML model linking features of nanoparticle solutions (e.g., concentration, nanoparticles’ tendency to aggregate) to a computed scattering profile is generic enough to analyze scattering profiles for nanoparticle solutions at conditions (nanoparticle chemistry and size) beyond those that were used for the ML training. Finally, we demonstrate application of this new gene-based CREASE method for analysis of small-angle X-ray scattering results from a nanoparticle solution with unknown nanoparticle aggregation and small-angle neutron scattering results from a binary nanoparticle assembly with unknown mixing/segregation among the nanoparticles.
Short abstract
Machine-learning-accelerated CREASE provides 3D structure, composition, and domain/aggregate sizes in binary nanoparticle mixtures or one-component nanoparticle solutions.
Introduction
Directed or self-assembly of nanoparticles in solution or near surfaces/interfaces is used to engineer functional materials for optical, biomedical, catalytic, and electronic applications.1−5 For example, assembly of nanoparticles in thin film or droplets (e.g., in emulsion assembly) into ordered three-dimensional (3D) nanostructures6−12 is used in photonic applications where the noniridescent structural color can be adjusted by tuning the nanoparticle size and structural order.11,13−16 In these applications, the assembled structure directly affects the resulting macroscopic properties, making structural characterization an important step during development of such functional materials.
Assembled nanoparticle structures are commonly characterized using microscopy [e.g., transmission electron microscopy (TEM) and scanning electron microscopy (SEM)] and small-angle scattering (SAS) techniques.17−25 Although microscopy enables direct imaging of the nanoparticles, the 2D images may probe a limited sample area and/or be limited by instrument resolution.19,20,26 More advanced microscopy techniques that can possibly obtain a 3D representation of the sample often require extensive data collection time and substantial data processing and analysis while still probing limited length scales compared to SAS techniques.27−29 Small-angle neutron and X-ray scattering (SANS and SAXS) are used to analyze the assembled structure with spatial resolution ranging from the nm to μm scale and present ensemble averaged structural information.26 The output from the SANS or SAXS measurement, the scattering intensity as a function of the scattering wavevector I(q) vs q, includes the nanoparticles’ form factor (i.e., size and shape) and the nanoparticles’ structure factor (i.e., spatial correlation).18 Interpretation of I(q) vs q from dilute nanoparticle dispersions30,31 (i.e., nonaggregating) have relied on analytical structure factor models,26,32 such as hard sphere33,34 and sticky hard sphere.35,36 However, the models developed assuming fluid suspensions do not perform well at high packing fractions above 0.4.37,38 For aggregating particles, the choice of structure factor model dictates the type of structural information one can obtain (e.g., aggregation numbers and aggregates’ radii of gyration).39
The above limitations of existing analytical models motivate the development of a computational method that is more broadly applicable without requiring the choice of a specific analytical model to fit the scattering data or significant a priori characterization. Further, it would be ideal if the computational method also provides a representative 3D structural reconstruction that could then be used as an input for other calculations (e.g., finite-difference time-domain method for optical properties40 and resistor network model calculation for electrical conductivity41).
Reverse Monte Carlo (RMC) simulation is a well-known computational method to analyze scattering data from nanoparticle dispersions. In RMC simulations, the random particle moves are rejected or accepted based on how much the particle move impacts the match between computed and target (e.g., experimental) scattering intensity profiles.42 With increasing number of particle moves, the structure progressively migrates toward one with a closer match between the computed and target scattering intensity profile. RMC simulations are commonly used for nanoparticle solutions at low particle packing fraction43−45 because the particle move acceptance rate is low at higher packing fraction.46 MONSA is an algorithm shown to identify various polymer-grafted nanoparticle morphologies using an RMC-based approach to reconstruct the structure by fitting a scattering profile curve.25 However, most RMC-related methods are limited by their reliance on a sequential, incrementally evolving structure that can require a significant number of accepted particle moves (computational time) to converge to the optimal structure (assuming no early convergence to a local minimum).
To overcome shortcomings in some of the above RMC-related methods, we developed our original analysis method called computational reverse-engineering analysis for scattering experiment (CREASE) using a genetic algorithm (GA)-based optimization that sampled many configurations simultaneously in parallel simulations and iterated toward the “optimal” structure(s) whose computed scattering profile(s) closely matched the target scattering profile. Besides successful application to analyzing structure in assembled polymer solutions,47−51 this CREASE method also worked well for analyzing scattering from polydisperse nanoparticles at high nanoparticle packing fraction (near the close-packed limit) for varying particle size dispersity, mixture composition, and chemical interactions in binary nanoparticle mixtures.52 In the case of nanoparticle systems, the key drawback of the original CREASE method was the representation of every individual as a 3D configuration (i.e., each individual stores the coordinates of all particles) and the creation of new individual configurations being dependent on stochastic particle swaps, much like RMC methods. These drawbacks led to the method being computationally slow and manifested in poor performance for the case of high packing fraction nanoparticle mixtures with strongly segregated particle domains.
To improve the original CREASE method, we draw inspiration from other implementations of CREASE from our laboratory that have used gene-based representation of individuals and successfully analyzed experimental and in silico generated target scattering profiles of micelles and vesicles.47,49−51 The micelle or vesicle structure is represented using a set of genes that include relevant structural dimensions (e.g., micelle diameter, vesicle core diameter, wall thickness, and dispersity) and parameters of interest (e.g., micelle aggregation number, ratio of molecules in one domain versus another). Using this idea of genes to represent relevant features of the structure, we present here a new gene-based CREASE method (Figure 1) to analyze the structural arrangement of binary nanoparticle mixtures and one-component nanoparticles solution at low and high packing fractions. The switch to a gene-based description of an individual from the cumbersome 3D configurations used before52 enables faster optimization toward the best structure whose computed scattering matches the target scattering. Furthermore, the gene-based CREASE also facilitates the incorporation of machine learning (ML) that directly links the genes defining the structure to a scattering intensity profile, bypassing the need to create a 3D structure with nanoparticles to calculate the computed scattering intensity profile using the Debye53,54 scattering equation.50
Figure 1.

Overview of the new gene-based CREASE workflow showing the input, how the structural information is stored as genes, two options for calculating the Icomp(q), checking for fitness convergence, population evolution, and finally, the types of output information.
We first validate our new gene-based CREASE approach using in silico scattering profiles from binary nanoparticle assemblies (with differing nanoparticle mixing/demixing, composition, and size dispersity) and one-component nanoparticle solutions (with varying nanoparticle aggregation, concentration, and size dispersity). Our incorporation of ML into the gene-based CREASE method significantly reduces computational time, maintains the performance similar to the non-ML version of the gene-based CREASE, and is general enough to analyze scattering profiles from systems beyond those that were used for ML training. Finally, we apply our gene-based CREASE method on an in vitro (i.e., from SAXS and SANS experiments) scattering profile of aggregating nanoparticles where both the extent of aggregation and nanoparticle size characteristics are unknown and of binary nanoparticle assembly with unknown nanoparticle mixing/segregation.
The ML augmented gene-based CREASE method described in this paper will be a broadly applicable computational method for experimentalists to quickly analyze high-throughput scattering results and obtain reconstructed 3D structures of the sample.
Results and Discussion
We first validate the new gene-based CREASE method by showing that it can produce the correct structure when used to analyze Itarget(q) obtained from in silico experiments (i.e., molecular simulations) where the target structure corresponding to the Itarget(q) is known. The in silico experiments contain both binary nanoparticle assemblies and one-component nanoparticle solutions to illustrate the versatility of the gene-based CREASE method.
The binary (A and B) nanoparticle assemblies are produced using molecular dynamics simulations with the details of the protocol described in our earlier work.12 We consider a range of systems with A-type volume compositions of 25%v and 50%v, weak and medium nanoparticle demixing, and nanoparticle size dispersity of 9% and 20%. We select the specific systems to briefly illustrate that this gene-based CREASE method outperforms the previous original CREASE method52 while requiring less specific inputs. The one-component nanoparticle solution systems are produced by placing nanoparticles to achieve a range of nanoparticle aggregation from disperse to strongly aggregating with nanoparticle concentrations by volume from 10%v to 50%v and nanoparticle size dispersity from 10% to 20%. The one-component nanoparticle solution systems target radial distribution function (RDF) and Itarget(q) is the average of 10 structures with similar characteristics (e.g., nanoparticle aggregation, concentration, and size distribution) to incorporate the variability in the structure. For these in silico systems, we compare the RDF returned by CREASE against that of the target structure, and we quantify the RDF match quality by determining the percent error between the CREASE output structure’s RDF and the target structure’s RDF.
For all systems, we perform three independent gene-based CREASE runs and compare the average and standard deviation from the three gene-based CREASE runs against the target structure. All visualizations are created using the VMD software.55
After validation, we apply the new gene-based CREASE method to analyze Iexp(q) vs q, from a SAXS measurement on a dilute, aggregating nanoparticle solution for which the extent of nanoparticle aggregation in unknown a priori and SANS measurements on a densely packed mixture of melanin and silica nanoparticles for which the extent of mixing between the two particles in unknown.
New Gene-Based CREASE Method vs Original CREASE Method for Analysis of I(q) vs q from Binary Nanoparticle Mixtures
We first highlight (briefly) the key differences between the new gene-based CREASE method and our original CREASE method.52 Additional details on this comparison are provided in the ESI Section II.
In the original CREASE, we described each individual in the GA as a 3D structure storing each nanoparticle’s identity and position; the original CREASE method also required the user to input the exact particle size distributions (defined as the average particle diameter and dispersity for a log-normal distribution) and nanoparticle binary mixture composition (in volume%). In contrast, in the new gene-based CREASE method, we define an individual as a collection of genes that identify a nanoparticle structure in a lower dimensional space than the positions of all nanoparticles (see ESI Section I). Further, the new gene-based CREASE does not require knowing the exact particle size distributions, composition (for binary mixture at high packing fraction) or concentration (for one-component nanoparticle solution) and can provide these as output! The gene-based description of individuals enables exploration of the phase space (degree of mixing/demixing, particle size distributions) more rapidly than the 3D configuration-based description of individuals in the original CREASE. Lastly the gene-based CREASE can utilize ML models that link the individual’s genes to a computed I(q) vs q, significantly reduce the computational time, and make the method more general.
We begin our comparison between the original and gene-based CREASE methods using target scattering profiles obtained from in silico experiments (where we know the structure) as it enables us to elucidate how well both methods reproduce the known target structure. To evaluate the performance of the gene-based CREASE method further, we consider two scenarios:
-
(1)
where the user inputs the exact particle size distribution, but not the composition of the particle mixture and allows the gene-based CREASE to converge to the optimal composition of the nanoparticle binary mixture (or concentration in case of 1-component nanoparticle solutions) in addition to the optimal structure; and
-
(2)
where the user does not input the particle size distribution or particle mixture composition and lets the gene-based CREASE output the optimal particle size distributions and mixture composition/nanoparticle concentration in addition to the optimal structure.
The first scenario shows how the gene-based CREASE method outperforms the original CREASE with similar user input. The second scenario shows the superiority of the gene-based CREASE in exhibiting excellent performance even with less user input than the original CREASE method.
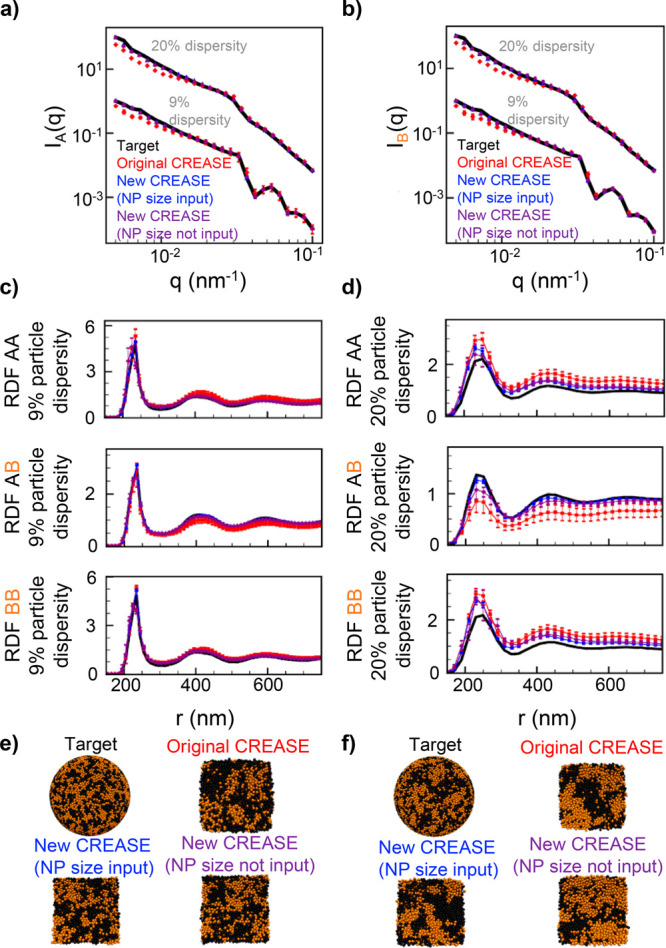
Figure 2 shows the performance of both CREASE methods on Itarget(q) from one specific binary nanoparticle mixture with 25% v A-type particle assembled within a spherical confinement. The weak and medium demixing in the target structures were brought about by modeling pairwise A–A and B–B interactions using the colloid Lenndard-Jones potential56 with Hamaker constants of 0.25 kBT (weak demixing) or 0.3 kBT (medium demixing) and A–B interactions using Hamaker constants of 0.2 kBT(weak and medium demixing). Figure 2a,b provides the scattering profiles of the A-type and B-type particles, respectively; in experiments one would obtain these through variations in contrast matching.57 The weak demixing system is offset in the y-axis direction from the medium demixing system to show how increasing the particle demixing impacts the scattering profile shape especially at low to medium q values. The Icomp(q) of the best structure from the original CREASE method (red curve) shows notable deviations from the Itarget(q) while both gene-based CREASE methods’ Icomp(q) more closely match the Itarget(q). This is confirmed by the higher χ2 value of the original CREASE’s Icomp(q) than the new gene-based CREASE methods’s Icomp(q) (ESI Figure S1).
Figure 2.

Comparison of the original and new gene-based CREASE methods on scattering profiles from an in silico nanoparticle mixture assembled in spherical confinement (using the simulation approach from ref (12)). The systems considered include binary (A and B) nanoparticles mixtures with 25%v A-type nanoparticle, weak or medium demixing of A and B nanoparticles, and an average nanoparticle diameter of 220 nm with 9% particle size dispersity (log-normal distribution) for both A and B nanoparticles. In all plots, curves from the target structure are in black, those from the original CREASE method are in red, those from the gene-based CREASE method with given particle size distribution as input are in blue, and those from the gene-based CREASE method without the particle size distribution as input are in purple. (e,f) Representative 3D renderings of the target structure and each of the CREASE method results. For all the CREASE methods, we provide the average and standard deviation from three independent CREASE runs.
Figure 2c provides the ensemble averaged real-space structure in the form of pairwise radial distribution functions (RDFs) for the target structure from a weakly demixed nanoparticle mixture; representative 3D visualizations of the target and CREASE structures are in Figure 2e. We quantify the percent error between the RDFs of the target structure and the optimized structure from each CREASE method in ESI Figure S1. In addition to the optimized structures, the gene-based CREASE method with the particle size distribution known via input also outputs the optimal composition of the structure as 24.2 ± 2.8%v A-type (the error 2.8% describes the variability between multiple CREASE runs). The gene-based CREASE with the particle size not known as input converges to an A-type particle diameter of 220.3 ± 2.4 nm, A-type particle diameter dispersity of 9.4 ± 1.1%, B-type particle diameter of 217.9 ± 3.3 nm, B-type particle diameter dispersity of 10.7 ± 0.7%, and a 27.9 ± 2.6%v A-type composition. For both scenarios of input (unknown or known information), the gene-based CREASE method achieves a composition that is quantitatively close to the composition in the target structure. Strikingly, even when the particle size distribution is not input to the gene-based CREASE, the gene-based CREASE converges to a particle size distribution close to the target values (220 nm diameter and 9% dispersity). However, if the exact particle size distribution is not input, we expect the resulting RDF to not match the target RDF as well as when the size distribution is input. For this weakly demixed target structure, the original CREASE method and the gene-based CREASE method with the particle size distribution input achieve similar error (ESI Figure S1). Not surprisingly, the gene-based CREASE method with the particle size distributions not input has the largest RDF percent error and also exhibits a minor shift in the primary RDF peak location because the particle size distribution is not same as that of target structure. It is important to note that the gene-based CREASE method (regardless of whether the particle size distribution was input or not) requires only ∼46% of the time needed by the original CREASE method and less input from the user!
Figure 2d,f shows similar information as Figure 2c,e but for the medium demixing target structure; how well the gene-based CREASE method performs with increasing extent of particle demixing is important to study as our past work showed that the original CREASE method’s performance decreased with increasing degree of demixing.52 Because the nanoparticle system has an asymmetric composition, the A–A RDF contains the most noticeable differences in the RDF profiles from increasing the particle demixing. The gene-based CREASE with the particle size input achieves a lower RDF percent error than the original CREASE method, with an especially good match to the target A–A RDF primary peak, as quantified in ESI Figure S1. Similar to weak demixed case, the gene-based CREASE method with the particle size distribution not input has the largest RDF percent error. Besides error resulting from slight difference in particle size distributions, this increased error demonstrates the not surprising trade-off of including less user input. In addition to the structure, the gene-based CREASE with the particle size distribution input converges to a composition of 25.5 ± 2.0%v A-type particle, and the gene-based CREASE without the particle size distribution input converges to an A-type particle diameter of 219.9 ± 3.2 nm, A-type particle diameter dispersity of 9.2 ± 0.4%, B-type particle diameter of 219.8 ± 0.7 nm, B-type particle diameter dispersity of 9.8 ± 0.5%, and a 26.4 ± 2.9%v A-type composition. While the resulting structure is qualitatively similar for the two gene-based CREASE methods, there is a loss in the quantitative match to the target structure because the gene-based CREASE method with less input has to converge to more outputs - the particle structure, particle composition, and particle size distributions. Thus, we suggest users include as much information as possible for cases where a close quantitative match is desired.
Figure 3 highlights how the gene-based CREASE method outperforms the original CREASE method even with increasing particle size dispersity; controlling dispersity in particle size during synthesis remains a challenge in experiments.58,59 In Figures 3a,b, the Icomp(q) of the best structure from the original CREASE method shows notable deviations from the Itarget(q) while both the gene-based CREASE methods with/without the nanoparticle size distributions input closely match the Itarget(q), also confirmed by the higher χ2 value of the original CREASE’s Icomp(q) than the new gene-based CREASE methods’s Icomp(q) (ESI Figure S2).
Figure 3.
Similar to Figure 2 except this figure is focused on 50%v A-type nanoparticle, medium demixing of A and B nanoparticles, and 9 or 20% nanoparticle size dispersity.
For the 9% particle size dispersity target structure, Figure 3c illustrates that the gene-based CREASE method with the particle size distributions input achieves the closest RDF match to the target structures (also confirmed by the percent error plotted in ESI Figure S2). The gene-based CREASE with the particle size input, over three independent replicates, converges to a composition of 48.0 ± 1.6%v A-type; the gene-based CREASE without the particle size input converges to an average A-type particle diameter of 221.7 ± 3.4 nm, A-type particle diameter dispersity of 9.8 ± 0.8%, average B-type particle diameter of 220.1 ± 2.2 nm, B-type particle diameter dispersity of 9.4 ± 1.2%, and a mixture composition of 47.1 ± 5.9%v A-type particle.
For the 20% particle size dispersity target structure, the original CREASE method produces a structure with larger RDF percent errors (ESI Figure S2) than both of the gene-based CREASE outputs (Figures 3d and S2). Our past work showed that the original CREASE method performs poorly when the degree of particle demixing is high, and the increased particle size dispersity worsens that poor performance.52 Unsurprisingly, the structure generated from the gene-based CREASE with the particle size distributions input results in the lowest RDF percent error. In addition, the gene-based CREASE with the particle size input converges to a mixture composition of 48.4 ± 2.5%v A-type; the gene-based CREASE with the particle size not input converges to an average A-type particle diameter of 220.1 ± 5.2 nm, A-type particle diameter dispersity of 20.5 ± 2.4%, average B-type particle diameter of 223.6 ± 5.4 nm, B-type particle diameter dispersity of 21.8 ± 1.1%, and a mixture composition of 43.9 ± 2.4%v A-type particle.
ESI Figure S3 provides additional comparisons between the original and gene-based CREASE methods for binary nanoparticle mixtures similar to Figure 3 but with weak particle demixing. Consistent with Figures 2 and 3, the original CREASE method achieves the worst match between the computed and target scattering profiles (also confirmed with χ2 values in ESI Figure S4). The original CREASE method (which was shown to perform reasonably well for weak demixing systems) and gene-based CREASE method with the particle size distributions input return structures with similar RDF percent error (ESI Figure S4). The gene-based CREASE with particle size distributions not input achieves a qualitatively similar local structure as the target assembly with quantitative differences largely resulting from the minor differences in particle size distributions that the gene-based CREASE method converges to.
So far, we have demonstrated that our new gene-based CREASE method is a significant improvement over the original CREASE method. It improves the accuracy of real-space structure determination for binary nanoparticle mixtures, especially with increasing particle demixing. The gene-based CREASE method signficantly reduces the computational time compared to the original CREASE method, even without the ML-based enhancement we describe in the next section. Lastly, the gene-based CREASE method predicts additional information about the nanoparticle sample (e.g., average particle size and dispersity, mixture composition) which would be greatly useful to users who have limited knowledge about the system that was used in the scattering experiment. It was also seen, not surprisingly that the gene-based CREASE method performs better quantitatively if the user provides more input (e.g., particle size information).
In the next section, we expand our validation of the gene-based CREASE method to another experimentally relevant system of one-component nanoparticles (e.g., one-component nanoparticle solutions or polymer nanocomposities with the scattering primarily from the nanoparticles like in ref.60).
Gene-Based CREASE Methods Applied to I(q) vs q from One-Component Nanoparticle Solutions with Varying Nanoparticle Aggregation and Concentration
We select three (one-component) nanoparticle solution concentrations that span from dilute to concentrated, and for each nanoparticle concentration, we consider three different nanoparticle degrees of aggregation from dispersed (nonaggregating) to strongly aggregating. We also demonstrate incorporation of machine learning (ML), specifically a trained artificial neural network (ANN), into the gene-based CREASE method to evaluate the Icomp(q) for each individual directly from the individual’s genes rather than using the computationally intensive Icomp(q) calculation with 3D structure creation and pairwise sums in the Debye equation. The details of how the ANN is trained is presented in the ESI Section I and Section VII; briefly, the ANN is trained to relate an individual’s genes and the q value to the resulting Icomp(q) at that q value. ESI Figure S5 shows we need an order of magnitude less time (∼95% faster) for the ANN-evaluated gene-based CREASE method vs the Debye-equation-evaluated gene-based CREASE method.
Next, we discuss the performance of the ANN-evaluated gene-based CREASE method compared to the explicit Debye-equation-evaluated gene-based CREASE methods (exclusively utilized up to this point in Figures 2 and 3).
In Figure 4a–c, we provide the nanoparticles’ scattering profiles spanning two decades of q values to include scattering from low q values (large distances) containing structural information and high q values (small distances) incorporating particle size and dispersity data. At intermediate q values (∼0.008–0.02 nm–1), the degree of nanoparticle aggregation influences the scattering profile shape with nonaggregating systems exhibiting a plateau I(q) value while aggregating systems have a negative slope in the I(q) vs q curve. At the lowest q values, we observe the emergence of minor oscillations in the scattering profiles due to finite system sizes used for the target structure and the 3D structure constructed for the converged final genes in the gene-based CREASE method.61 The finite system size effects can be mitigated at lower q values by considering larger system sizes or only utilizing those q values that have minor to negligible system size effect-driven oscillations. Regardless, all three gene-based CREASE methods converge to structures with Icomp(q) that closely matches the Itarget(q). We quantify the quality of fit of the scattering profile matches in ESI Figure S6 (10%v concentration), ESI Figure S7 (30%v concentration), and ESI Figure S8 (50%v concentration). In those ESI Figures, we show the converged nanoparticle size distribution (if not input) and the nanoparticle concentration to demonstrate that all three gene-based CREASE methods converge to particle size distributions close to target structures’ values. For the 50%v concentration, the Debye-equation-evaluated gene-based CREASE methods (blue and purple) converge to values closer to the target concentration than the ANN-evaluated gene-based CREASE method.
Figure 4.

Evaluation of the gene-based CREASE method on scattering profiles from simulated one-component nanoparticle solutions with varying degrees of nanoparticle aggregation (disperse, weakly aggregated, and strongly aggregated) and nanoparticle concentration (10%v, 30%v, and 50%v) for nanoparticles with average diameter of 220 nm and 10% particle size dispersity. (a–c) I(q) vs q for varying nanoparticle concentration (10%v, 30%v, and 50%v); shifted curves represent varying degrees of aggregation. (d–f) Nanoparticle radial distribution functions (RDFs). In all parts, the curve for the target structure is in black, the gene-based CREASE method with the particle size distribution input is in blue, the gene-based CREASE method without the particle size distribution input is in purple, and the ANN-evaluated gene-based CREASE method is in green. The inset images in (d–f) show representative renderings of the target structure and an output structure from the gene-based CREASE method with the nanoparticle size distribution input. For all the CREASE methods, we provide the average and standard deviation from three independent CREASE runs.
In Figure 4d–f, we find that the Debye-equation-evaluated gene-based CREASE methods converge to structures that have similar local ordering as the target structure. We quantify the RDF percent error in ESI Figures S6–S8 (10%–50%v concentration) to confirm the quantitative differences. The lower match to target RDF for the ANN-evaluated compared to Debye-equation-evaluated gene-based methods is not surprising as the ANN interpolated scattering calculation is not as precise as the explicit Debye scattering equation, and the value of the nanoparticle concentration is also mildly incorrect. However, despite these shortcomings, the ANN returns a structure with qualitatively similar degree of aggregation as target (dispersed for a dispersed target or strongly aggregated for a strongly aggregated target) with significantly reduced computational time as compared to Debye-equation-evaluated method.
We now validate our gene-based CREASE method on target structures with a higher nanoparticle size dispersity of 20% in Figure 5. The ANN used in Figure 4 was trained with data from systems with smaller nanoparticle size dispersity (7–13%), so a new ANN is needed for systems with larger size dispersity. We consider two approaches, one where the new ANN is trained solely on data with size dispersity of 17–23% and another where the ANN is trained on data with a broader range of dispersity (both the 7–13% and 17–23% data). The results in Figure 5 describe the performance of the former ANN models and in ESI Figure S11 the performance of the latter.
Figure 5.

Similar to Figure 4, except this figure is focused on 20% particle size dispersity and 10%v and 50%v nanoparticle concentrations.
At 20% particle size dispersity (Figure 5a,b) we observe the expected trend of less prominent features in the scattering profiles especially at high q values than at 10% particle size dispersity; having less prominent features in the scattering profile is a challenge when analyzing scattering results of increasingly polydisperse systems. All three gene-based CREASE methods converge to Icomp(q) that closely match the Itarget(q). We quantify the fit of the scattering matches as well as the converged values of nanoparticle size distribution and nanoparticle concentration for all three gene-based CREASE methods in ESI Figure S9 (10%v system) and S10 (50%v system). As expected, the increased nanoparticle size dispersity reduces the ability for the gene-based CREASE methods to achieve the exact target nanoparticle size distributions and concentrations; the converged particle size distributions and concentrations are qualitatively near the target values but not precise matches. For the average nanoparticle size, the CREASE methods without the nanoparticle size input (purple and green) converge to a value within a few nanometers of the target value (within ∼3% error). Interestingly, those two gene-based CREASE methods excel at determining the target nanoparticle size dispersity (within a standard deviation from the average dispersity returned). In ESI Figures S9 and S10, all three gene-based CREASE methods converge to concentration values with larger errors than for the systems with 10% nanoparticle size dispersity (ESI Figures S6–S8).
The nanoparticle RDFs in Figure 5c-d shows that all three gene-based CREASE methods achieve excellent (blue and purple curves) to reasonable (green curve) agreement for both 10%v and 50%v; particularly for the 50%v concentration systems, the ANN-evaluated gene-based CREASE method also performs well. Among the two Debye-equation-evaluated gene-based CREASE methods, when the nanoparticle size distribution is input, it helps the method converge to a closer RDF match with target structure RDF, otherwise it converges to slightly different nanoparticle size distribution. The ANN-evaluated gene-based CREASE method converges to structures with similar average RDF values as the target RDF; however, as the nanoparticle size dispersity increases there is larger variability in the output RDF, shown with larger error bars. We quantify the RDF percent error for the 10%v and 50%v systems in ESI Figures S9 and S10, respectively. Overall, we observe a similar performance of the three gene-based CREASE methods for target structures at 20% nanoparticle size dispersity as we saw at the 10% nanoparticle size dispersity in Figure 4.
In ESI Figure S11 we show that the ANN-evaluated gene-based CREASE if the ANN were trained using all training data generated for the two ANNs used in Figures 4 and 5. The Icomp(q) and Itarget(q) agree with the match quantified in ESI Figures S12 (10%v system) and S13 (50%v system). The ANN trained over all training data does not converge to closer values for the nanoparticle size distribution or concentrations than the dispersity specific ANN. Overall, the RDF matches are of similar quality between the two ANNs because one ANN will achieve a closer match for one system while the other ANN will perform better for a different system. Thus, while training a single ANN over a wider dispersity does not improve performance, it does not reduce accuracy, and it enables a user to rely on a single ANN over a much wider size dispersity range.
In Figures 4 and 5, we demonstrate how the gene-based CREASE method can utilize a pretrained ANN to output structures significantly faster than using the Debye scattering equation. Regardless of the nature of the data used for the ANN training, there is a computational cost to generate the data to train the ANN (ESI Figure S5). To generalize the ANN for various particle sizes, during the ANN training, we normalize the q value input by 2π divided by the nanoparticle average diameter gene instead of using the training data specific values. This normalization forces the ANN to learn the Icomp(q) value as a function of the normalized q values ranging from less than 1 to greater than 1, making the trained ANNs nanoparticle size agnostic. Therefore, a single trained ANN can be applied to target systems with different nanoparticle sizes without the need to obtain new data and train a new ANN. In Figure 6, we demonstrate how the ANN previously trained on data from 220 ± 10 nm diameter particles with 10 ± 3% size dispersity (used in Figure 4) can be directly applied to a target system with 130 nm diameter particles with 10% size dispersity.
Figure 6.

Similar to Figures 4 and 5, except this figure is for systems with an average nanoparticle diameter of 130 nm with 10% particle size dispersity and 50%v nanoparticle concentration.
Figure 6a illustrates the scattering profiles of the target structures and the computed scattering profile of the ANN-evaluated gene-based CREASE method. Because the average particle diameter is smaller than in Figures 4 and 5, the q range is shifted to higher q values to still span two decades without extrapolating to normalized q values that the ANN was not trained on. To understand why the q range shifts, in Figure 4 for average diameter of 220 nm, the lowest q value is 0.001 nm–1 leading to a normalized q value of 0.001/(2π/220) ≈ 0.35; in Figure 6, the average diameter is 130 nm, so the lowest q value is qlow ≈ 0.00169 nm–1.
We compare the closeness of the scattering fit values to those from the 220 nm diameter 50%v systems in Figure 4 (shown in ESI Figure S8), and we find that the ANN achieves a similar quality of scattering match in both cases. Figure 6b provides the local structure comparison through the RDF calculation, and ESI Figure S14 illustrates the RDF percent error. The ANN-evaluated gene-based CREASE method converges to structures with a close match to the target structures. Additionally, the RDF percent error for results in Figure 6 is quantitatively similar to that for Figure 4 highlighting that the ANN-evaluated gene-based CREASE does not suffer performance degradation for systems with nanoparticle diameters different from the ones the ANN is trained on.
We note, however, that our explanation as to why the q range changes for Figure 6 compared to Figure 4 was primarily to illustrate that even though the ANN is particle size agnostic, the ANN should only be applied within the limits of the trained range of normalized q values.
CREASE Performance on Scattering from Experimental One-Component (Melanin) Nanoparticle Solution and Binary (Melanin and Silica) Nanoparticle Assembly
First, we apply the validated gene-based CREASE method to analyze Iexp(q) vs q, from a SAXS measurement on a dilute, weakly aggregating nanoparticle solution (Figure 7). For this system, the exact particle size distribution and degree of aggregation are unknown, so the gene-based CREASE must also optimize those parameters in addition to the real-space structure. In Figure 7a the shape of Iexp(q) suggests that the solution exhibit some degree of aggregation. Specifically, the Iexp(q) in the q range from ∼0.008 to ∼0.02 nm–1 exhibits a steady decline unlike nonaggregating systems that are flat over that range (compare the Iexp(q) shape in Figure 7a to the Itarget(q) shapes in Figure 4a). ESI Figure S15 shows that all three CREASE variations achieve a similar goodness of fit (χ2 value) and converge to a similar average nanoparticle and size dispersity. The main difference between the three gene-based CREASE variations is the nanoparticle concentration as the gene-based CREASE method without the concentration input converges to ∼3.3%v instead of the experimental estimate used as input, ∼ 0.77%v.
Figure 7.

Application of the gene-based CREASE method on scattering profiles from an experimental system of one-component (melanin) nanoparticle solution with ∼0.77%v nanoparticle concentration. (a) Iexp(q) in black, Icomp(q) from the gene-based CREASE method with the nanoparticle concentration input in blue, Icomp(q) from the gene-based CREASE method without the nanoparticle concentration input in purple, and the Icomp(q) from the ANN-evaluated gene-based CREASE method with concentration input in green. The Iexp(q) comes from a slit-smeared, small-angle X-ray scattering experiment, and as such, the Icomp(q) curves shown incorporate instrument smearing effects (as described in the Methods). (b) Renderings of representative output structures from the three gene-based CREASE methods. (c) Nanoparticle radial distribution functions (RDFs) and (d) Average number of nanoparticles per aggregate; the gene-based CREASE method with the nanoparticle concentration input is in blue, the gene-based CREASE method without the nanoparticle concentration input is in purple, and the ANN-evaluated gene-based CREASE method with concentration input is in green. For all three gene-based CREASE methods, we provide the average and standard deviation from three independent runs.
Figure 7b shows that despite the differences in concentration, all the three methods visually return similarly small aggregates. We characterize the real-space structure in Figure 7c-d by considering both the nanoparticle RDF and the nanoparticle aggregation number (i.e., the number of nanoparticles in each aggregate). The three methods converge to structures with a similar RDF shape though the peak value is different when the gene-based CREASE method does not have an input concentration. The difference in peak value is a result of the concentration differences because the RDF is normalized by the number of particles. The higher concentration system (∼3.3%v) is normalized by that larger value (∼3.3%v) as compared to ∼0.77%v leading to a lower RDF peak value for that purple curve. ESI Figure S15 illustrates that the RDFs are the same if we normalize the CREASE variations as if they all had the same concentration. Figure 7d shows that the three methods achieve nearly identical average nanoparticle aggregation size and standard deviation sizes. The nanoparticle aggregation number is a metric for quantifying nanoparticle clusters that, unlike the RDF calculation, is not as impacted by system concentration. Thus, CREASE is consistently able to return quantitatively similar structures though with some variability in the concentration for such a low concentration in the experimental system.
Next, we apply the validated gene-based CREASE method to analyze Iexp(q) vs q, from a SANS measurement on a binary (melanin and silica) nanoparticle mixture assembled into a spherical supra-structure (Figure 8). For this system, the gene-based CREASE determines the melanin and silica nanoparticles’ size distribution and extent of mixing between melanin and silica nanoparticles within the real-space structure. We take as input both the total scattering from melanin and silica nanoparticles (Figure 8a) as well as the scattering from just the silica nanoparticles (Figure 8b). We note that the gene-based CREASE fits both scattering profiles concurrently as opposed to the traditional approach of manually fitting each scattering profile separately. ESI Figure S16 shows that both CREASE versions–with and without concentration input - achieve a similar goodness of fit (χ2 value) and converge to a similar average nanoparticle size and size dispersity. The CREASE version without the concentration input converges to a slightly smaller average diameter melanin nanoparticle, so the melanin–melanin RDF is slightly shifted left to smaller contact position. Figure 8c,d demonstrates that both gene-based CREASE versions achieve similar structures with a visualization that agrees with the experimental TEM images. Thus, CREASE is able to reconstruct correct structures for experimental scattering profiles coming from binary nanoparticle assemblies at high packing fractions.
Figure 8.

Application of the gene-based CREASE method on small-angle neutron scattering profiles from an experimental system of a two-component (melanin and silica) nanoparticle assembly with ∼50%v melanin nanoparticle concentration. (a) Itotal(q) vs q is the scattering from both the melanin and silica nanoparticles (non-contrast-matched) with the experimental profile shown in black, Icomp(q) from the Debye-evaluated gene-based CREASE method with the nanoparticle concentration input is in red, and the Icomp(q) from the Debye-evaluated gene-based CREASE method without the nanoparticle concentration input is in purple. (b) ISil(q) vs q is the scattering from only the silica nanoparticles (i.e., melanin particles are contrast-matched with background) with the experimental profile shown in black, Icomp(q) from the gene-based CREASE method with the nanoparticle concentration input in red, and the Icomp(q) from the gene-based CREASE method without the nanoparticle concentration input in purple. The experimental profiles come from a pinhole-smeared, small-angle neutron scattering experiment, and as such, the computed scattering Icomp(q) curves shown also have instrument smearing effects (as described in the Methods). (c) Melanin and silica nanoparticle radial distribution functions (RDFs); the gene-based CREASE method with the nanoparticle concentration input is in red and the gene-based CREASE method without the nanoparticle concentration input is in purple. (d) Cross section TEM image of a binary assembly (dark particles are silica; light particles are melanin) and renderings of sections of representative output structures from the gene-based CREASE method (blue particles are melanin; yellow particles are silica). For both gene-based CREASE methods, we provide the average and standard deviation from three independent runs.
Conclusion
We have presented an open-source computational tool to reconstruct the bulk structure from small-angle scattering experiments of binary nanoparticle mixtures and one-component nanoparticle solutions. We demonstrated that this redesigned gene-based CREASE method is more accurate and faster than the previously developed approach, applicable to a wider range of experimentally relevant systems, and can be augmented with an artificial neural network (ANN) to further accelerate the speed of the method while maintaining good performance. For every system considered, we quantify the closeness of the match between the target structure and CREASE’s determined structure by calculating the error (difference) between the target and CREASE scattering profiles and radial distribution functions. Furthermore, our approach to training the ANN using the nondimensionalized q value divided by the nanoparticle diameter enables a single ANN to be used on multiple systems with differing nanoparticle sizes. The gene-based CREASE method presents a facile tool to obtain a computational structural reconstruction enabling users to perform additional characterization such as optical modeling for further structural validation and development of structure–property relationships. The successful implementation of this gene-based CREASE method promises further extensions to characterize the amorphous structure of other soft materials that also have more complex form factors (e.g., anisotropic nanoparticles, concentrated micelle solutions, etc.).
Acknowledgments
C.M.H., A.P., A.D., and A.J. acknowledge financial support from the Air Force Office of Scientific Research (MURI-FA 9550-18-1-0142). This work was supported with computational resources from the University of Delaware (Caviness cluster). C.M.H., A.P., A.D., and A.J. gratefully acknowledge the efforts of Ziying Hu and Nathan C. Gianneschi for providing the nanoparticles used to in the experimental application section, Jan Ilavsky and Ivan Kuzmenko for assisting with the X-ray beamline measurements, and Markus Bleuel, Cedric Gagnon, Jeff Kryzwon, and John Barker during data collection on the beamlines at NIST. This research used the Advanced Photon Source (APS) 9-ID beamline operated by Argonne National Laboratory under contract No. DE-AC02-06CH11357 as a U.S. DOE Office of Science User Facility. Access to vSANS was provided by the Center for High Resolution Neutron Scattering (CHRNS), a partnership between the NIST and the National Science Foundation (NSF) under Agreement No. DMR-1508249. Specific commercial equipment, instruments, or materials are identified in this paper to foster understanding. Such identification does not imply recommendation or endorsement by the NIST, nor does it imply that the materials or equipment identified are necessarily the best available for the purpose.
Supporting Information Available
The Supporting Information is available free of charge at https://pubs.acs.org/doi/10.1021/acscentsci.2c00382.
Details of the computational and experimental methods. Discussion comparing method differences between gene-based CREASE to the previously developed original CREASE. Error quantification for the scattering profile and RDF matches of original and gene-based CREASE comparison for binary nanoparticle assemblies with weak nanoparticle demixing and 50%v A-type composition. Timing comparison for ANN-evaluated gene-based CREASE, training the ANN, and ANN data collection to the Debye-equation-evaluated gene-based CREASE. Gene-based CREASE genes to structure conversion schematic. ANN architecture evaluation. Experimental nanoparticle visualization (PDF)
Transparent Peer Review report available (PDF)
Author Contributions
C.M.H. was responsible for programming, computing, and data analysis with regular intellectual guidance and feedback from A.J. A.P. and A.D. performed the experiments and collected and processed the experimental scattering data used in the experimental application section. C.M.H. and A.J. wrote and edited the manuscript. A.P. and A.D. reviewed the manuscript and suggested edits during manuscript preparation. All authors approved the manuscript.
The authors declare no competing financial interest.
Notes
Code availability: The code for this CREASE method is available in the following GitHub repository: https://github.com/arthijayaraman-lab/crease_ga.
Supplementary Material
References
- Grzelczak M.; Vermant J.; Furst E. M.; Liz-Marzán L. M. Directed self-assembly of nanoparticles. ACS Nano 2010, 4 (7), 3591–3605. 10.1021/nn100869j. [DOI] [PubMed] [Google Scholar]
- McGorty R.; Fung J.; Kaz D.; Manoharan V. N. Colloidal self-assembly at an interface. Mater. Today 2010, 13 (6), 34–42. 10.1016/S1369-7021(10)70107-3. [DOI] [Google Scholar]
- Böker A.; He J.; Emrick T.; Russell T. P. Self-assembly of nanoparticles at interfaces. Soft Matter 2007, 3 (10), 1231–1248. 10.1039/b706609k. [DOI] [PubMed] [Google Scholar]
- Liu J.; Wickramaratne N. P.; Qiao S. Z.; Jaroniec M. Molecular-based design and emerging applications of nanoporous carbon spheres. Nature materials 2015, 14 (8), 763–774. 10.1038/nmat4317. [DOI] [PubMed] [Google Scholar]
- Lemaster J. E.; Wang Z.; Hariri A.; Chen F.; Hu Z.; Huang Y.; Barback C. V.; Cochran R.; Gianneschi N. C.; Jokerst J. V. Gadolinium doping enhances the photoacoustic signal of synthetic melanin nanoparticles: a dual modality contrast agent for stem cell imaging. Chem. Mater. 2019, 31 (1), 251–259. 10.1021/acs.chemmater.8b04333. [DOI] [PMC free article] [PubMed] [Google Scholar]
- Liu W.; Midya J.; Kappl M.; Butt H.-J. r.; Nikoubashman A. Segregation in Drying Binary Colloidal Droplets. ACS Nano 2019, 13 (5), 4972–4979. 10.1021/acsnano.9b00459. [DOI] [PMC free article] [PubMed] [Google Scholar]
- Cho Y.-S.; Yi G.-R.; Lim J.-M.; Kim S.-H.; Manoharan V. N.; Pine D. J.; Yang S.-M. Self-organization of bidisperse colloids in water droplets. J. Am. Chem. Soc. 2005, 127 (45), 15968–15975. 10.1021/ja0550632. [DOI] [PubMed] [Google Scholar]
- Schulz M.; Keddie J. A critical and quantitative review of the stratification of particles during the drying of colloidal films. Soft Matter 2018, 14 (30), 6181–6197. 10.1039/C8SM01025K. [DOI] [PubMed] [Google Scholar]
- Tang Y.; Grest G. S.; Cheng S. Stratification in drying films containing bidisperse mixtures of nanoparticles. Langmuir 2018, 34 (24), 7161–7170. 10.1021/acs.langmuir.8b01334. [DOI] [PubMed] [Google Scholar]
- Bai F.; Wang D.; Huo Z.; Chen W.; Liu L.; Liang X.; Chen C.; Wang X.; Peng Q.; Li Y. A versatile bottom-up assembly approach to colloidal spheres from nanocrystals. Angew. Chem. 2007, 119 (35), 6770–6773. 10.1002/ange.200701355. [DOI] [PubMed] [Google Scholar]
- Xiao M.; Hu Z.; Gartner T. E. 3rd; Yang X.; Li W.; Jayaraman A.; Gianneschi N. C.; Shawkey M. D.; Dhinojwala A. Experimental and theoretical evidence for molecular forces driving surface segregation in photonic colloidal assemblies. Sci. Adv. 2019, 5 (9), eaax1254 10.1126/sciadv.aax1254. [DOI] [PMC free article] [PubMed] [Google Scholar]
- Gartner T. E.; Heil C. M.; Jayaraman A. Surface composition and ordering of binary nanoparticle mixtures in spherical confinement. Molecular Systems Design & Engineering 2020, 5 (4), 864–875. 10.1039/C9ME00185A. [DOI] [Google Scholar]
- Kawamura A.; Kohri M.; Yoshioka S.; Taniguchi T.; Kishikawa K. Structural color tuning: Mixing melanin-like particles with different diameters to create neutral colors. Langmuir 2017, 33 (15), 3824–3830. 10.1021/acs.langmuir.7b00707. [DOI] [PubMed] [Google Scholar]
- Dutta H. S.; Goyal A. K.; Srivastava V.; Pal S. Coupling light in photonic crystal waveguides: A review. Photonics and Nanostructures-Fundamentals and Applications 2016, 20, 41–58. [Google Scholar]
- Echeverri M.; Patil A.; Hu Z.; Shawkey M. D.; Gianneschi N. C.; Dhinojwala A. Printing a Wide Gamut of Saturated Structural Colors Using Binary Mixtures, With Applications in Anticounterfeiting. ACS Appl. Mater. Interfaces 2020, 12 (17), 19882–19889. 10.1021/acsami.0c01449. [DOI] [PubMed] [Google Scholar]
- Patil A.; Heil C. M.; Vanthournout B.; Bleuel M.; Singla S.; Hu Z.; Gianneschi N. C.; Shawkey M. D.; Sinha S. K.; Jayaraman A.; et al. Structural Color Production in Melanin-Based Disordered Colloidal Nanoparticle Assemblies in Spherical Confinement. Advanced Optical Materials 2022, 10 (5), 2102162. 10.1002/adom.202102162. [DOI] [Google Scholar]
- Shipway A. N.; Katz E.; Willner I. Nanoparticle arrays on surfaces for electronic, optical, and sensor applications. ChemPhysChem 2000, 1 (1), 18–52. . [DOI] [PubMed] [Google Scholar]
- Boles M. A.; Engel M.; Talapin D. V. Self-assembly of colloidal nanocrystals: from intricate structures to functional materials. Chem. Rev. 2016, 116 (18), 11220–11289. 10.1021/acs.chemrev.6b00196. [DOI] [PubMed] [Google Scholar]
- Mourdikoudis S.; Pallares R. M.; Thanh N. T. Characterization techniques for nanoparticles: comparison and complementarity upon studying nanoparticle properties. Nanoscale 2018, 10 (27), 12871–12934. 10.1039/C8NR02278J. [DOI] [PubMed] [Google Scholar]
- Modena M. M.; Rühle B.; Burg T. P.; Wuttke S. Nanoparticle characterization: What to measure?. Adv. Mater. 2019, 31 (32), 1901556. 10.1002/adma.201901556. [DOI] [PubMed] [Google Scholar]
- Berbel Manaia E.; Paiva Abuçafy M. P.; Chiari-Andréo B. G.; Lallo Silva B. L.; Oshiro-Júnior J. A. O.; Chiavacci L. A. Physicochemical characterization of drug nanocarriers. Int. J. Nanomed. 2017, 12, 4991. 10.2147/IJN.S133832. [DOI] [PMC free article] [PubMed] [Google Scholar]
- Melnichenko Y. B.; Wignall G. D. Small-angle neutron scattering in materials science: Recent practical applications. J. Appl. Phys. 2007, 102 (2), 021101. 10.1063/1.2759200. [DOI] [Google Scholar]
- Chu B.; Liu T. Characterization of nanoparticles by scattering techniques. J. Nanopart. Res. 2000, 2 (1), 29–41. 10.1023/A:1010001822699. [DOI] [Google Scholar]
- Hollamby M. J. Practical applications of small-angle neutron scattering. Physical chemistry chemical physics 2013, 15 (26), 10566–10579. 10.1039/c3cp50293g. [DOI] [PubMed] [Google Scholar]
- Luo Z.; Marson D.; Ong Q. K.; Loiudice A.; Kohlbrecher J.; Radulescu A.; Krause-Heuer A.; Darwish T.; Balog S.; Buonsanti R.; et al. Quantitative 3D determination of self-assembled structures on nanoparticles using small angle neutron scattering. Nat. Commun. 2018, 9 (1), 1343. 10.1038/s41467-018-03699-7. [DOI] [PMC free article] [PubMed] [Google Scholar]
- Li T.; Senesi A. J.; Lee B. Small angle X-ray scattering for nanoparticle research. Chem. Rev. 2016, 116 (18), 11128–11180. 10.1021/acs.chemrev.5b00690. [DOI] [PubMed] [Google Scholar]
- Schryvers D.; Cao S.; Tirry W.; Idrissi H.; Van Aert S. Advanced three-dimensional electron microscopy techniques in the quest for better structural and functional materials. Sci. Technol. Adv. Mater. 2013, 14 (1), 014206. 10.1088/1468-6996/14/1/014206. [DOI] [PMC free article] [PubMed] [Google Scholar]
- Nan N.; Wang J. FIB-SEM three-dimensional tomography for characterization of carbon-based materials. Advances in Materials Science and Engineering 2019, 2019, 8680715. 10.1155/2019/8680715. [DOI] [Google Scholar]
- Holzer L.; Cantoni M. Review of FIB-tomography. Nanofabrication using focused ion and electron beams: Principles and applications 2012, 410–435. [Google Scholar]
- Ottewill R.; Rennie A.; Johnson G. Small-angle neutron scattering studies on binary mixtures of polystyrene and perfluorinated particles. Advances in colloid and interface science 2003, 100, 585–611. 10.1016/S0001-8686(02)00077-5. [DOI] [Google Scholar]
- De Kruif C.; Briels W.; May R.; Vrij A. Hard-sphere colloidal silica dispersions. The structure factor determined with SANS. Langmuir 1988, 4 (3), 668–676. 10.1021/la00081a029. [DOI] [Google Scholar]
- Botet R.; Kwok S.; Cabane B. Percus-Yevick structure factors made simple. J. Appl. Crystallogr. 2020, 53 (6), 1570–1582. 10.1107/S1600576720014041. [DOI] [Google Scholar]
- Blum L.; Stell G. Polydisperse systems. I. Scattering function for polydisperse fluids of hard or permeable spheres. J. Chem. Phys. 1979, 71 (1), 42–46. 10.1063/1.438088. [DOI] [Google Scholar]
- Salacuse J.; Stell G. Polydisperse systems: Statistical thermodynamics, with applications to several models including hard and permeable spheres. J. Chem. Phys. 1982, 77 (7), 3714–3725. 10.1063/1.444274. [DOI] [Google Scholar]
- Menon S.; Manohar C.; Rao K. S. A new interpretation of the sticky hard sphere model. J. Chem. Phys. 1991, 95 (12), 9186–9190. 10.1063/1.461199. [DOI] [Google Scholar]
- Baxter R. Percus-Yevick equation for hard spheres with surface adhesion. J. Chem. Phys. 1968, 49 (6), 2770–2774. 10.1063/1.1670482. [DOI] [Google Scholar]
- Schmidt P. Some Fundamental Concepts and Techniques Useful in Small-Angle Scattering Studies of Disordered Solids. Modern Aspects of Small-Angle Scattering 1995, 451, 1–56. 10.1007/978-94-015-8457-9_1. [DOI] [Google Scholar]
- Zemb T.; Lindner P.. Neutrons, X-rays and light: scattering methods applied to soft condensed matter; North-Holland, 2002. [Google Scholar]
- Larsen A. H.; Pedersen J. S.; Arleth L. Assessment of structure factors for analysis of small-angle scattering data from desired or undesired aggregates. J. Appl. Crystallogr. 2020, 53 (4), 991–1005. 10.1107/S1600576720006500. [DOI] [Google Scholar]
- Patil A.; Heil C. M.; Vanthournout B.; Bleuel M.; Singla S.; Hu Z.; Gianneschi N. C.; Shawkey M. D.; Sinha S. K.; Jayaraman A. Structural Color Production in Melanin-Based Disordered Colloidal Nanoparticle Assemblies in Spherical Confinement. Advanced Optical Materials 2022, 10, 2102162. 10.1002/adom.202102162. [DOI] [Google Scholar]
- White S. I.; DiDonna B. A.; Mu M.; Lubensky T. C.; Winey K. I. Simulations and electrical conductivity of percolated networks of finite rods with various degrees of axial alignment. Phys. Rev. B 2009, 79 (2), 024301. 10.1103/PhysRevB.79.024301. [DOI] [Google Scholar]
- McGreevy R.; Pusztai L. Reverse Monte Carlo simulation: a new technique for the determination of disordered structures. Mol. Simul. 1988, 1 (6), 359–367. 10.1080/08927028808080958. [DOI] [Google Scholar]
- Gereben O.; Pusztai L.; McGreevy R. RMCSANS-modelling the inter-particle term of small angle scattering data via the reverse Monte Carlo method. J. Phys.: Condens. Matter 2010, 22 (40), 404216. [DOI] [PubMed] [Google Scholar]
- Musino D.; Genix A.-C.; Chauveau E.; Bizien T.; Oberdisse J. Structural identification of percolation of nanoparticles. Nanoscale 2020, 12 (6), 3907–3915. 10.1039/C9NR09395H. [DOI] [PubMed] [Google Scholar]
- Hagita K.; Tominaga T.; Sone T. Large-scale reverse Monte Carlo analysis for the morphologies of silica nanoparticles in end-modified rubbers based on ultra-small-angle X-ray scattering data. Polymer 2018, 135, 219–229. 10.1016/j.polymer.2017.12.018. [DOI] [Google Scholar]
- Tóth G. Simultaneous Monte Carlo determination of particle size distribution and pair-correlation function of spherical colloids from a diffraction experiment. Langmuir 1999, 15 (20), 6718–6723. 10.1021/la9901534. [DOI] [Google Scholar]
- Beltran-Villegas D. J.; Wessels M. G.; Lee J. Y.; Song Y.; Wooley K. L.; Pochan D. J.; Jayaraman A. Computational reverse-engineering analysis for scattering experiments on amphiphilic block polymer solutions. J. Am. Chem. Soc. 2019, 141 (37), 14916–14930. 10.1021/jacs.9b08028. [DOI] [PubMed] [Google Scholar]
- Lee J. Y.; Song Y.; Wessels M. G.; Jayaraman A.; Wooley K. L.; Pochan D. J. Hierarchical Self-Assembly of Poly (d-glucose carbonate) Amphiphilic Block Copolymers in Mixed Solvents. Macromolecules 2020, 53 (19), 8581–8591. 10.1021/acs.macromol.0c01575. [DOI] [Google Scholar]
- Wessels M. G.; Jayaraman A. Computational Reverse-Engineering Analysis of Scattering Experiments (CREASE) on Amphiphilic Block Polymer Solutions: Cylindrical and Fibrillar Assembly. Macromolecules 2021, 54 (2), 783–796. 10.1021/acs.macromol.0c02265. [DOI] [Google Scholar]
- Wessels M. G.; Jayaraman A. Machine learning enhanced computational reverse engineering analysis for scattering experiments (crease) to determine structures in amphiphilic polymer solutions. ACS Polym. Au 2021, 1, 153–164. 10.1021/acspolymersau.1c00015. [DOI] [PMC free article] [PubMed] [Google Scholar]
- Ye Z.; Wu Z.; Jayaraman A. Computational Reverse Engineering Analysis for Scattering Experiments (CREASE) on Vesicles Assembled from Amphiphilic Macromolecular Solutions. JACS Au 2021, 1 (11), 1925–1936. 10.1021/jacsau.1c00305. [DOI] [PMC free article] [PubMed] [Google Scholar]
- Heil C. M.; Jayaraman A. Computational Reverse-Engineering Analysis for Scattering Experiments of Assembled Binary Mixture of Nanoparticles. ACS Materials Au 2021, 1 (2), 140–156. 10.1021/acsmaterialsau.1c00015. [DOI] [PMC free article] [PubMed] [Google Scholar]
- Debye P. Zerstreuung von röntgenstrahlen. Annalen der Physik 1915, 351 (6), 809–823. 10.1002/andp.19153510606. [DOI] [Google Scholar]
- Scardi P.; Billinge S. J.; Neder R.; Cervellino A.. Celebrating 100 years of the Debye scattering equation; BNL-112736-2016-JA; Brookhaven National Laboratory, 2016. [DOI] [PubMed]
- Humphrey W.; Dalke A.; Schulten K. VMD: visual molecular dynamics. J. Mol. Graphics 1996, 14 (1), 33–38. 10.1016/0263-7855(96)00018-5. [DOI] [PubMed] [Google Scholar]
- Everaers R.; Ejtehadi M. Interaction potentials for soft and hard ellipsoids. Phys. Rev. E 2003, 67 (4), 041710. 10.1103/PhysRevE.67.041710. [DOI] [PubMed] [Google Scholar]
- Ballauff M. Analysis of Polymer Colloids by Small-Angle X-Ray and Neutron Scattering: Contrast Variation. Adv. Eng. Mater. 2011, 13 (8), 793–802. 10.1002/adem.201000303. [DOI] [Google Scholar]
- Ma J.; Lee S. M.-Y.; Yi C.; Li C.-W. Controllable synthesis of functional nanoparticles by microfluidic platforms for biomedical applications-a review. Lab Chip 2017, 17 (2), 209–226. 10.1039/C6LC01049K. [DOI] [PubMed] [Google Scholar]
- Plumeré N.; Ruff A.; Speiser B.; Feldmann V.; Mayer H. A. Stöber silica particles as basis for redox modifications: Particle shape, size, polydispersity, and porosity. J. Colloid Interface Sci. 2012, 368 (1), 208–219. 10.1016/j.jcis.2011.10.070. [DOI] [PubMed] [Google Scholar]
- Oberdisse J.; Hine P.; Pyckhout-Hintzen W. Structure of interacting aggregates of silica nanoparticles in a polymer matrix: small-angle scattering and reverse Monte Carlo simulations. Soft Matter 2007, 3 (4), 476–485. 10.1039/B614957J. [DOI] [PubMed] [Google Scholar]
- Olds D. P.; Duxbury P. M. Efficient algorithms for calculating small-angle scattering from large model structures. J. Appl. Crystallogr. 2014, 47 (3), 1077–1086. 10.1107/S1600576714005925. [DOI] [Google Scholar]
Associated Data
This section collects any data citations, data availability statements, or supplementary materials included in this article.