

Abstract
Early allergic sensitization (atopy) is the first step in the development of allergic diseases such as atopic asthma later in life. Genes and pathways associated with atopy and atopic asthma in children and adolescents have not been well characterized.
A transcriptome-wide association study of atopy and atopic asthma in white blood cells or whole blood was conducted in a cohort of 460 Puerto Ricans aged 9 to 20 years (EVA-PR) and in a cohort of 250 Swedish adolescents (BAMSE). Pathway enrichment and network analyses were conducted to further assess top findings, and classification models of atopy and atopic asthma were built using expression levels for the top differentially expressed genes.
In a meta-analysis of the study cohorts, both previously implicated genes (e.g., IL5RA and IL1RL1) and genes not previously reported in TWAS (novel) were significantly associated with atopy and/or atopic asthma. Top novel genes for atopy included SIGLEC8 (P = 8.07×10⁻¹³), SLC29A1 (P = 7.07×10⁻¹²), and SMPD3 (P = 1.48×10⁻¹¹). Expression quantitative trait locus (eQTL) analyses identified multiple asthma-relevant genotype-expression pairs, such as rs2255888/ALOX15. Pathway enrichment analysis uncovered sixteen significantly enriched pathways at P < 0.01, including those relevant to Th1 and Th2 immune responses. Classification models built using the top differentially expressed genes and a few demographic/parental history variables accurately differentiated subjects with atopic asthma from non-atopic control subjects (area under the curve=0.84).
We have identified genes and pathways for atopy and atopic asthma in children and adolescents, using transcriptome-wide data from white blood cells and whole blood samples.
INTRODUCTION
Over the last few decades, the prevalence of allergic diseases increased in the United States (U.S.) and worldwide. Sensitization to allergens (atopy) in early life precedes the development of allergic diseases later in childhood, including food allergies, allergic rhinitis, and atopic asthma (1). Puerto Rican and Swedish children bear a high burden of atopy and asthma (1–3). In studies of school-aged children, estimates of the prevalence of asthma and allergic rhinitis in Puerto Ricans were 16.1% and 48.4%, respectively (2, 4). Among Swedish children ages 7 to 8 years, estimates of the prevalence of current wheeze and allergic rhinitis were 13% and 13.8%, respectively (5, 6).
Recent meta-analyses of genome-wide association studies (GWAS) identified 18 susceptibility loci for asthma (7) and 41 susceptibility loci for allergic rhinitis (8). However, such loci accounted for a small proportion of the heritability of asthma (~3.5%) and allergic rhinitis (~7.8%), and alternative approaches such as transcriptomics could help identify the “missing heritability” of atopic diseases. Yet another complementary approach is to study intermediate phenotypes such as atopy, as susceptibility genes for atopy often overlap with those for common allergic diseases (8).
In contrast to the many GWAS conducted to date, there have been few transcriptome-wide studies (TWAS) of atopy and asthma, all limited by modest sample size and no or insufficient replication (9–13). For example, a study of targeted RNA sequencing of 105 genes in nasal brushings from subjects with (n=50) and without (n=50) asthma showed that nasal transcriptomic profiles could identify subjects with IL-13 driven asthma and Th2-skewed immune responses (10). In another study (including mostly adults), RNA sequencing profiles from nasal brushings were used to first develop a panel of 90 genes to differentiate subjects with mild to moderate asthma (n=53) from control subjects (n=97), and then test the “classifier panel” in 40 subjects with (n=13) and without (n=27) asthma (11). Although the panel performed well in training cohorts, external replication was limited and thus no individual genes could confidently be identified as conferring susceptibility to asthma.
While airway epithelial studies have shown promising results, blood samples are easy to collect and often available in epidemiologic studies. A genome-wide analysis of transcriptomics in circulating CD19+ B lymphocytes from 41 adults provided suggestive evidence of increased IL4R expression in subjects with dust mite allergy and asthma, compared with control subjects (12). In another study in young adolescents with asthma, microarray expression profiles from CD4+ T lymphocytes were differentially expressed by atopic status (13), and five “atopic signature” genes were then nominally replicated in a cohort of 30 subjects. A later integrative study in asthma controls focused on the transcriptomic components in blood that vary with degree of asthma control (14).
Herein we report the findings from the first transcriptome-wide association study of atopy and atopic asthma in white blood cells (WBCs) from children and adolescents in Puerto Rico, with validation studies in a cohort of Swedish children.
METHODS
Please also see the Online Supplement.
Study population
The Epigenetic Variation and Childhood Asthma in Puerto Ricans study (EVA-PR) is a case-control study of asthma in Puerto Ricans aged 9 to 20 years, recruited using an approach similar to that used in previous studies in the metropolitan area of San Juan (Puerto Rico) (15, 16). Of the 543 participating children, 460 had measurements of immunoglobulin E (IgE) to five common allergens in Puerto Rico (dust mite [Der p 1], cockroach [Bla g 2], cat dander [Fel d 1], dog dander [Can f 1], and mouse urinary protein [Mus m 1])(17), WBC count and differential, and RNA from WBCs, and are thus included in the current analysis. The study was approved by the institutional review boards of the University of Puerto Rico (San Juan, PR) and the University of Pittsburgh (Pittsburgh, PA). Written parental consent and assent were obtained from all participants.
RNA sequencing and data preprocessing
Sequencing was performed using 350 ng of high-quality RNA extracted from WBCs after removing hemoglobin (RNA Integrity Number [RIN] > 7). Library preparation was done using TruSeq Stranded Total RNA Library Prep Kit with Ribo-Zero Gold High Throughput kit (Illumina Inc., San Diego, CA), according to the manufacturer’s protocol. Libraries were run on the NextSeq 500 using NextSeq® 500/550 High Output Kit v2.
Quality control for raw RNA-Seq fastq files was performed using FastQC (18). Low quality reads and 3’ adapters were trimmed with Trim Galore! and Cutadapt (19, 20). Trimmed reads were then aligned to reference human genome (hg19) with STAR (6) and subsequently annotated in the Illumina iGenomes database using RSEM (21). Samples with low alignment percentage and genes with low expression were removed from downstream analyses. After preprocessing, a total of 16,880 genes and 460 samples were retained in the final analysis.
Principal components (PCs) were calculated from genome-wide genotypic data, which were obtained using the HumanOmni2.5 BeadChip platform (Illumina Inc.), as previously described (22). Imputation of non-genotyped single nucleotide polymorphisms (SNPs) was performed with the Imputation Server (23), using the Haplotype Reference Consortium (HRC) r1.1 2016 (24) as the reference panel.
The BAMSE (Barn/Children, Allergy, Milieu, Stockholm, Epidemiology; Sweden) Study
We also analyzed whole blood samples using Affymetrix Human Transcriptome Array 2.0 (HTA 2.0) in 269 16-year-old children selected from BAMSE, a Swedish population-based cohort (with oversampling of asthma and rhinitis cases) (25). After quality control (RIN>6) and outlier detection, gene expression data from 250 blood samples were included in the current analysis of atopy and atopic asthma with available WBC count and differential. Allergen-specific IgE levels were measured using the ImmunoCAP System (Thermo Fisher/Phadia AB, Uppsala, Sweden).
Statistical analyses
In EVA-PR and BAMSE, atopy was defined as at least one positive IgE (>= 0.35 IU/mL) to the allergens tested. Atopic asthma was defined as current asthma (physician-diagnosed asthma and current wheeze) and atopy in EVA-PR, and as current asthma (assessed using a modified version of the GA2LEN questionnaire2) (26) and atopy in BAMSE.
Differentially expressed genes (DEGs) were analyzed based on the raw count table using DESeq2 (27) for RNA sequencing data in EVA-PR, and LIMMA for microarray data in BAMSE. In both EVA-PR and BAMSE, multivariable models of atopic asthma were adjusted for age, sex, batch label, and the proportions (percentages) of WBC subtypes (eosinophils, lymphocytes, monocytes and neutrophils). All multivariable models of atopy were additionally adjusted for asthma status. In EVA-PR, all models were additionally adjusted for the first five PCs derived from genotypes, to account for population stratification. A zero-mean normal prior was put on the non-intercept coefficients, to ensure that fold changes are independent of the choice of reference level. Next, we conducted a meta-analysis of the cohort-specific results using a fixed-effect model with in-house code using the R package Meta (28, 29). The False Discovery Rate (FDR) approach was applied to adjust for multiple testing.
In EVA-PR, we performed an expression quantitative trait loci (eQTL) analysis (at a distance < 1Mb from gene start and end sites) for the top findings in the meta-analysis of atopy using the R package Matrix eQTL (30).
Pathway and network analysis
Ingenuity Pathway Analysis (IPA) was performed for the top DEGs (FDR-adjusted P value < 0.1) in the meta-analysis of atopy and atopic asthma, to identify enriched canonical pathways and gene networks (31). We then calculated the partial correlation between gene expression levels in our discovery cohort, first in all subjects and then separately by asthma status, using the R package FastGGM (32), a powerful tool to detect conditional gene network under the framework of Gaussian graphical model.
Classification models of atopy and atopic asthma
Logistic regression with penalized maximum likelihood was applied to build classification models of atopy and atopic asthma in EVA-PR. We first built two models for comparison: one including only demographic and parental history (age, gender, parental history of asthma) as predictors, and another including demographic and parental history, and gene expression levels of randomly chosen genes. Next, we built a model using the top DEGs in our meta-analysis, and another using the top DEGs plus demographic and parental history. Models were built separately for atopy and atopic asthma.
RESULTS
The main characteristics of study participants are shown in Table 1. In EVA-PR, subjects with atopy were significantly more likely to be male and to have asthma than control subjects. Compared with participants in EVA-PR, those in BAMSE had, as expected for a population-based cohort study, a lower proportion of asthmatic subjects and a narrower age range.
Table 1.
| EVA-PR* (n = 460) |
BAMSE** (n = 250) |
|||
|---|---|---|---|---|
| Atopy (n=300) | No atopy (n=160) | Atopy (n=134) | No atopy (n=116) | |
|
| ||||
| Age (y) | 15.2 (10–20) | 15.7 (10–21) | 16.7 (16.0–17.9) | 16.7 (15.9–18.1) |
| Sex (female) | 131 (43.7%) | 87 (54.4%) | 47 (35.1%) | 59 (50.9%) |
| Asthma | 165 (55%) | 63 (39.4%) | 42 (31.3%) | 10 (8.6%) |
| Sensitization to: | ||||
| Dust mite | 282 (94%) | 48 (35.8%) | ||
| Cat dander | 49 (16.3%) | 72 (53.7%) | ||
| Dog dander | 168 (56%) | 85 (63.4%) | ||
| Mouse urinary protein | 12 (4%) | Not measured | ||
| Cockroach | 174 (58%) | Not measured | ||
Data are shown as mean (range) for continuous variables, and as number (percentage) for categorical variables.
EVA-PR= Epigenetic variation and childhood asthma in Puerto Rico
BAMSE= Children, Allergy, Milieu, Stockholm, Epidemiological Survey birth cohort study
TWAS of atopy
In the multivariable analysis of atopy, which was adjusted for WBC subtype and other covariates, we identified 69 DEGs in EVA-PR at FDR-adjusted P <0.05. In BAMSE, there were no DEGs at FDR-adjusted P <0.05 but 17 of the 69 DEGs in EVA-PR were differentially expressed at P <0.05, with similar estimates of effect size across the two studies (Table S1). Next, to increase the statistical power of DEG analysis, we combined the results from the two cohorts in a transcriptome-wide meta-analysis, which identified 59 DEGs by atopy, at an FDR-adjusted P < 0.05 (Figure 1a). Table 2 lists the top 20 genes (by P value) in this meta-analysis, for which the direction of the association between gene expression and atopy was consistent across the two studies.
Figure 1.

Meta-analysis of gene expression demonstrates substantial differences in gene expression between atopic subjects and control subjects. A. Volcano plots show the log2 (fold change) and −log10 (adjusted p-value) of all the genes in the RNA-seq dataset. The statistically significant DEGs between atopic subjects and control subjects are represented in red. The statistical criteria for a gene to be considered differentially expressed was adjusted p-value < 0.05. B. Venn diagram depicting the distribution of the DEGs in analysis between atopic subjects and control subjects, and between atopic asthmatics and non-atopic non-asthmatic constrol subjects.
Table 2.
Top differentially expressed genes from the meta-analysis of atopy
| EVA-PR |
BAMSE |
Meta-analysis |
||||||||
|---|---|---|---|---|---|---|---|---|---|---|
| Gene Symbol | Description | Fold Change | P Value | FDR | Fold Change | P Value | FDR* | Fold Change | P Value | FDR |
|
| ||||||||||
| SIGLEC8 | Sialic acid binding Ig like lectin 8 | 1.18 | 2.97×10⁻¹² | 2.51×10−08 | 1.05 | 9.34×10−03 | NS | 1.10 | 8.07×10⁻¹³ | 2.86×10−08 |
| IL5RA | Interleukin 5 receptor subunit alpha | 1.15 | 2.06×10−09 | 3.48×10−06 | 1.18 | 1.97×10−04 | NS | 1.16 | 2.03×10⁻¹² | 3.59×10−08 |
| IL17RB | Interleukin 17 receptor B | 1.19 | 1.29×10⁻¹⁴ | 2.18×10⁻¹⁰ | 1.01 | 2.39×10−01 | NS | 1.04 | 5.14×10⁻¹² | 6.07×10−08 |
| SLC29A1 | Solute carrier family 29 member 1 (Augustine blood group) | 1.15 | 1.23×10−09 | 2.31×10−06 | 1.05 | 9.24×10−04 | NS | 1.07 | 7.07×10⁻¹² | 6.26×10−08 |
| SMPD3 | Sphingomyelin phosphodiesterase 3 | 1.15 | 2.44×10⁻¹⁰ | 1.03×10−06 | 1.04 | 5.31×10−03 | NS | 1.07 | 1.48×10⁻¹¹ | 1.05×10−07 |
| IL1RL1 | Interleukin 1 receptor like 1 | 1.14 | 6.15×10−09 | 8.94×10−06 | 1.13 | 2.24×10−03 | NS | 1.14 | 8.46×10⁻¹¹ | 4.99×10−07 |
| ALOX15 | Arachidonate 15-lipoxygenase | 1.15 | 9.79×10⁻¹⁰ | 2.11×10−06 | 1.11 | 1.22×10−02 | NS | 1.14 | 1.48×10⁻¹⁰ | 7.50×10−07 |
| OLIG2 | Oligodendrocyte transcription factor 2 | 1.17 | 5.22×10⁻¹² | 2.×10 −08 | 1.01 | 3.18×10−01 | NS | 1.06 | 7.96×10⁻¹⁰ | 3.52×10−06 |
| PIK3R6 | Phosphoinositide-3-kinase regulatory subunit 6 | 1.12 | 9.07×10−08 | 7.×10 −05 | 1.05 | 2.41×10−03 | NS | 1.07 | 1.04×10−09 | 4.10×10−06 |
| CLC | Charcot-Leyden crystal galectin | 1.14 | 2.54×10−08 | 2.×10 −05 | 1.17 | 9.22×10−03 | NS | 1.14 | 1.65×10−09 | 5.85×10−06 |
| ADORA3 | Adenosine A3 receptor | 1.14 | 6.58×10−09 | 8.94×10−06 | 1.04 | 2.47×10−02 | NS | 1.07 | 1.95×10−09 | 6.27×10−06 |
| CEBPE | CCAAT/enhancer binding protein epsilon | 1.12 | 1.04×10−06 | 6.04×10−04 | 1.07 | 2.32×10−03 | NS | 1.09 | 9.52×10−09 | 2.59×10−05 |
| PMP22 | Peripheral myelin protein 22 | 1.15 | 1.00×10−09 | 2.11×10−06 | 1.02 | 1.75×10−01 | NS | 1.06 | 1.05×10−08 | 2.66×10−05 |
| PRSS33 | Protease, serine 33 | 1.15 | 7.21×10⁻¹⁰ | 2.03×10−06 | 1.01 | 3.15×10−01 | NS | 1.05 | 2.77×10−08 | 6.55×10−05 |
| PTGDR2 | Prostaglandin D2 receptor 2 | 1.12 | 3.85×10−07 | 2.60×10−04 | 1.04 | 2.34×10−02 | NS | 1.07 | 5.61×10−08 | 1.17×10−04 |
| RAB44 | Member RAS oncogene family | 1.08 | 6.77×10−05 | 2.11×10−02 | 1.07 | 2.39×10−04 | NS | 1.07 | 7.15×10−08 | 1.41×10−04 |
| HRASLS5 | HRAS like suppressor family member 5 | 1.14 | 2.11×10−08 | 2.19×10−05 | 1.02 | 1.60×10−01 | NS | 1.05 | 9.10×10−08 | 1.69×10−04 |
| HRH4 | Histamine receptor H4 | 1.11 | 4.78×10−06 | 2.18×10−03 | 1.10 | 7.45×10−03 | NS | 1.11 | 1.37×10−07 | 2.42×10−04 |
| CCR3 | C-C Motif Chemokine Receptor 3 | 1.11 | 1.20×10−05 | 4.72×10−03 | 1.15 | 4.20×10−03 | NS | 1.11 | 1.77×10−07 | 2.85×10−04 |
| CDK15 | Cyclin dependent kinase 15 | 1.14 | 8.22×10−09 | 9.25×10−06 | 1.01 | 3.56×10−01 | NS | 1.03 | 2.14×10−07 | 3.29×10−04 |
All models were adjusted for age, sex, asthma status, batch, and proportions of white blood cell subtypes (eosinophils, lymphocytes, neutrophils and monocytes). Models in EVA-PR were additionally adjusted for principal components.
NS means non-significant, i.e., FDR-adjusted P value > 0.05.
For the top DEGs by atopy, we found forty-three enriched pathways at FDR-adjusted P <0.05. Table 3 lists the top 20 enriched pathways, of which the two most significant ones were the Th2 pathway and the Th1/Th2 activation pathway. Other top pathways included those for Nerve growth factor (NGF) and Adenine/Adenosine salvage I.
Table 3.
Top functional ingenuity pathways enriched by top DEGs in the meta-analysis of atopy
| Ingenuity Canonical Pathways | −log(P Value) | Molecules |
|---|---|---|
|
| ||
| Th2 Pathway | 3.83 | CCR3,PTGDR2,IL17RB,IL1RL1,PIK3R6 |
| Th1 and Th2 Activation Pathway | 3.41 | CCR3,PTGDR2,IL17RB,IL1RL1,PIK3R6 |
| Type II Diabetes Mellitus Signaling | 2.75 | CACNA 1D,PIK3R6, CACNG8, SMPD 3 |
| MSP-RON Signaling Pathway | 2.74 | CSF1,PIK3R6,RPS6KA2 |
| FcyRIIB Signaling in B Lymphocytes | 2.54 | CACNA1D,PIK3R6, CACNG8 |
| Role of Macrophages, Fibroblasts and Endothelial Cells in Rheumatoid Arthritis | 2.35 | IL1RL1,CSF1,PIK3R6,FZD1,CEBPE |
| Amyotrophic Lateral Sclerosis Signaling | 2.21 | CACNA1D, GRID1,PIK3R6 |
| CREB Signaling in Neurons | 2.21 | CACNA1D, GRID1,PIK3R6, CACNG8 |
| UVA-Induced MAPK Signaling | 2.21 | PIK3R6,RPS6KA2,SMPD3 |
| Adenine and Adenosine Salvage I | 2.18 | APRT |
| Role of Osteoblasts, Osteoclasts and Chondrocytes in Rheumatoid Arthritis | 2.11 | IL1RL1,CSF1,PIK3R6,FZD1 |
| nNOS Signaling in Skeletal Muscle Cells | 2.08 | CACNA 1D, CACNG8 |
| NGF Signaling | 2.08 | PIK3R6,RPS6KA2,SMPD3 |
| Atherosclerosis Signaling | 2.05 | CCR3,ALOX15,CSF1 |
| Role of Tissue Factor in Cancer | 2.02 | CSF1,PIK3R6,RPS6KA2 |
| Cellular Effects of Sildenafil (Viagra) | 2.01 | CACNA1D,MYH9, CACNG8 |
| Docosahexaenoic Acid (DHA) Signaling | 1.88 | ALOX15,PIK3R6 |
| α-tocopherol Degradation | 1.88 | CYP4F12 |
| Tetrapyrrole Biosynthesis II | 1.78 | ALAS2 |
| PKCθ Signaling in T Lymphocytes | 1.75 | CACNA1D,PIK3R6,CACNG8 |
TWAS of atopic asthma
We then conducted a transcriptomic analysis of atopic asthma, finding substantial overlap between the results from this analysis and those for atopy (Figure 1b, Table S2). We identified 49 DEGs by atopic asthma in EVA-PR at FDR-adjusted P <0.05. In BAMSE, there were no DEGs at FDR-adjusted P<0.05, but 5 of the 49 DEGs by atopic asthma in EVA-PR were differentially expressed at P<0.05 in BAMSE, with similar estimates of effect size. 40 DEGs were then identified in meta-analysis at FDR-adjusted P value < 0.05. For atopic asthma, a pathway enrichment analysis revealed pathways related to lipid metabolism (e.g., Docosahexaenoic Acid signaling), and arachidonic acid signaling (e.g., eicosanoids signaling) (Table S3).
eQTL analysis
Next, we conducted a cis-eQTL analysis in EVA-PR, which identified 3,772 SNPs that were significantly associated with our top genes from the expression analysis for atopy at FDR-adjusted P < 0.05 (Table S4). Such SNPs included multiple eQTLs in the GTEx database (33) (e.g., rs2255888 in ALOX15, rs35092096 in CCR3). Of interest, multiple SNPs were associated with expression of IL1RL1 (a known asthma-susceptibility gene) (7).
Network analysis
A network analysis was performed to illustrate interactions among our top DEGs by atopy (Figure S3), first in all subjects and then separately in atopic subjects and in control subjects. Partial correlation among these genes remained strong, even after conditioning on global expression profile. This was particularly true for the most differentially expressed gene, SIGLEC8. We also found that some strong correlations in control subjects weakened significantly in atopic children, such as those for the gene pair IL34 and CYSLTR2.
We next performed hierarchical clustering with log-transformed TPM (Transcripts Per Kilobase Million) values in EVA-PR, based on the 59 DEGs (FDR-adjusted P <0.05) in the meta-analysis of atopy, identifying four individual clusters (Figure 2a). In this analysis, the prevalence of atopy differs between the first two clusters, but not between the last two clusters (Figure S3). However, when we compared eosinophil proportions in samples across these four clusters, we found that the samples with higher expression of the top DEGs for atopy had more eosinophils in peripheral blood (Figure 2b). We then tested for an association between expression levels of the top DEGs for atopy or atopic asthma and the measured proportions of each cell subset in peripheral blood (Table S5). Of the top 59 DEGs for atopy, 51 genes were significantly associated (FDR-P <0.05) with the proportion of eosinophils in peripheral blood. However, a few of the top DEGs were associated with the proportions of other cell types (e.g., APRT and TMEM160 with lymphocyte proportions, and PEPD with neutrophil proportions). All top 40 DEGs for atopic asthma were significantly associated with eosinophils in peripheral blood. Next, we deconvolved the expression profile of white blood cells based on known cell proportions and permutations, in order to investigate cell-type-specific differential expression using CIBERSORT (34). Thirty-eight genes were significantly enriched in eosinophils (FDR-P < 0.05). Of these 38 genes, 24 were among the top DEGs for atopy and 20 were among the top DEGs for atopic asthma.
Figure 2.
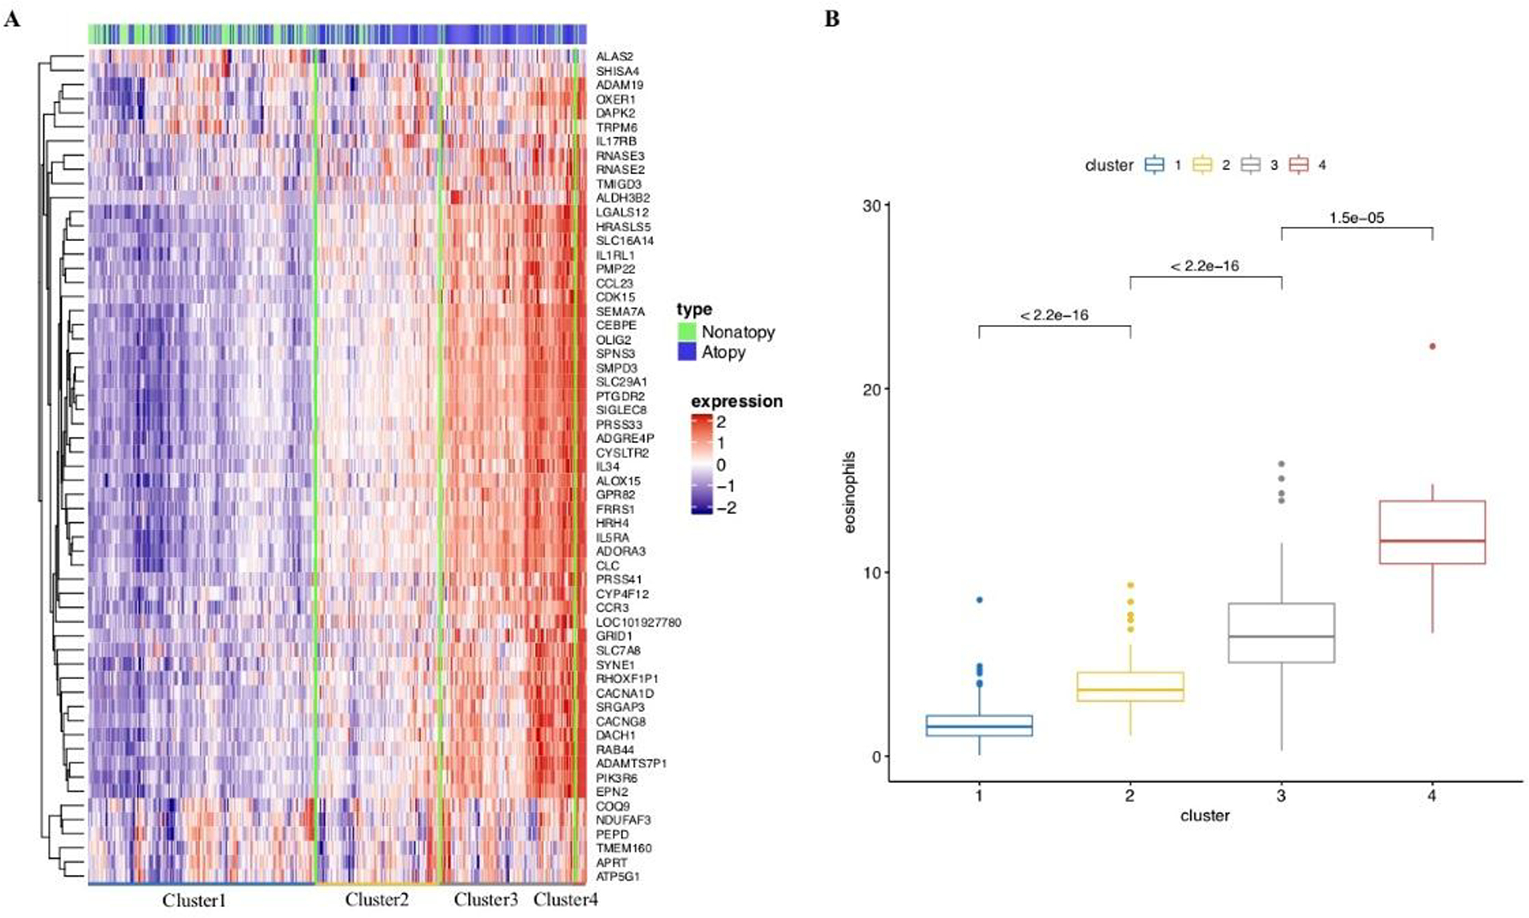
Hierarchical clustering based on top DEGs in meta-analysis. A. Four clusters are identified, with most of the genes up-regulated from cluster1 to cluster4. B. Eosinophil proportion comparison for each cluster, showing significant difference both globally and between clusters individually in Kruskal-Wallis Test.
Classification models for atopy and atopic asthma
Finally, we built classification models in our discovery cohort using only demographic variables and parental history, achieving areas under the curve (AUCs) of 0.56 for atopy and 0.74 for atopic asthma. These results were similar after adding expression levels for a random set of genes (data not shown). When using top DEGs alone as predictors, the models reached AUC of 0.77 and 0.81 for atopy and atopic asthma, respectively. On the other hand, the performance of the classification models improved substantially after expression levels of the top DEGs were included as predictors, achieving AUCs of 0.77 for atopy and 0.84 for atopic asthma (Figure 3). For atopy, we used 51 genes (FDR-adjusted P <0.05 in meta-analysis for atopy, and available in both cohorts), while for atopic asthma we included the top 33 genes (FDR-adjusted P <0.05 in meta-analysis for atopic asthma, and available in both cohorts).
Figure 3.

Classification model of atopy and atopic asthma. H: age, gender, asthma history of parents as predictors. R: expression profile of randomly chosen genes (the same number as G) as predictors. G: expression profile of top DEGs as predictors (FDR < 0.05 in meta-analysis). A. classification model of atopy. B. classification model of atopic asthma.
DISCUSSION
In a TWAS of WBCs, we identified DEGs by atopy and atopic asthma in 460 Puerto Rican children. In parallel, we conducted a TWAS of atopy and atopic asthma in 250 Swedish children, which yielded non-significant results due to small sample size but yielded replication of some of our top findings in Puerto Rican children at P <0.05, in the same direction of association and with similar estimates of effect size. Next, we conducted a meta-analysis of TWAS from both study cohorts, identifying 59 DEGs by atopy and 40 DEGs by atopic asthma.
In our meta-analysis, the top DEG by atopy was SIGLEC8, which has an extracellular binding domain that induces apoptosis in eosinophils and inhibits FcεRI-dependent mediator release in mast cells (35). SNPs in SIGLEC8 were associated with asthma and eosinophilic esophagitis in candidate-gene studies (36, 37), but this gene was not associated with asthma in a recent meta-analysis of GWAS (38). Of interest, expression of one of the top 20 genes in our meta-analysis of atopy (oligodendrocyte transcription factor 2 expression, OLIG2) was previously reported to down-regulate RNA and protein levels of SIGLEC8 in peripheral blood eosinophils (39). Moreover, expression levels of OLIG2 and CCL23 (one of our top DEGs for atopic asthma) in whole blood were significantly associated with suboptimal disease control in a meta-analysis of data from 693 ethnically diverse children and adults (40). Both OLIG2 and CCL23 are TREM1 (triggering receptor expressed in myeloid cells)/LPS signaling genes, and TREM-1 is a key amplifier of inflammatory responses induced by pattern-recognition receptors.
Other top study results are supported by experimental evidence or findings from other human studies. SLC29A1 is involved in adenosine-regulated inhibition of IgE-dependent degranulation of mast cells (41). IL5RA, a gene implicated in asthma in our prior study (42), regulates Th2-cell differentiation and Th2-cell effector functions (43). Moreover, IL5RA and ALOX15 (also among our top genes) were both significantly associated with eosinophil count in a transcriptomic analysis of blood samples from subjects with asthma (36). This is consistent with our prior findings for total IgE (44), and, together with the results from our hierarchical cluster analysis and other complementary analyses, further emphasizes the key role of eosinophil-dependent mechanisms in the pathogenesis of atopy and atopic asthma.
Our findings for IL17RB are particularly interesting. In mouse models, allergen challenge triggers the IL-4 pathway, which promotes allergic airway inflammation and airway responsiveness. In turn, activation of IL-4 pathways induces expression of IL-25 and IL-17RB in serum and the lungs (45, 46). In a prior study of human subjects with asthma, IL17RB expression in peripheral blood CD4+ T cells was significantly associated with serum total IgE (47), albeit only in males. Consistent with a key role for IL17RB in atopy in humans, genetic deletion of IL-17RB significantly lessens allergic sensitization in mice (46).
We identified other plausible candidate genes for atopy and atopic asthma. SMPD3, encoding sphingomyelin phosphodiesterase 3 (48), is hypermethylated and down-regulated in the small airways of subjects with chronic obstructive pulmonary disease (49). PIK3R6, an IL-17A gene target in airway smooth muscle cells (50), has been shown to interact with second-hand smoke exposure on FEV1. Other genes, such as ADAMTS7P1, EPN2, and RAB44, have not been previously reported in TWAS and merit further investigation.
DEGs by atopy often overlapped with those for atopic asthma. Most of our top findings were correlated with genotypic data, emphasizing a genetic predisposition to atopy. Moreover, a network analysis based on partial correlation revealed close interactions between significant DEGs.
Consistent with known mechanisms of atopy, we found that the top two most enriched pathways were the Th2 and Th1/Th2 activation pathways. Other top pathways in our analysis were that for Nerve growth factor (NGF, a critical factor in the pathogenesis of allergic airway inflammation and proliferation of airway smooth muscle cells) (51) and that for Adenine and Adenosine Salvage I (adenosine has been contraindicated in allergy or severe asthma) (52).
We compared our findings for gene expression and atopic asthma in WBCs with those of a prior meta-analysis of gene expression in airway epithelium and asthma (53). Of the top 40 DEGs by atopic asthma in our study, 7 were differentially expressed by asthma in airway epithelium (Table S6). Some of these differences may be due to inclusion of cases of both atopic and non-atopic asthma in the prior analysis in airway epithelium, while others may indicate true tissue-specific differences in gene expression in atopic asthma. We also compared our results to those of a prior European study of sputum transcriptomics in 104 subjects with moderate to severe asthma and 16 healthy volunteers (54). In that study, three transcriptome-associated clusters (TAC) were identified, with one of them enriched for the IL-13/Th2 pathway. Of the 20 genes comprising this cluster, seven were also associated with atopy or atopic asthma (at FDR-P <0.05) in our meta-analysis (PRSS33, CLC, LGALS12, ALOX15, OLIG2, HRH4, and CCR3).
We mapped the top DEGs in our meta-analysis to the top CpG sites discovered in epigenome-wide association studies (EWAS) of atopy and atopic asthma in blood and airway epithelial samples. None of the genes containing or near the top 30 CpG sites recently associated with atopy in an EWAS of nasal epithelium (55) were DEGs by atopy in our study, but two of the top DEGs by atopic asthma in our study (IL5RA and SIGLEC8) were part of differentially methylated regions by asthma in an EWAS of whole blood (56, 57).
Results from our classification models further support the validity of our top findings, as well as the plausibility of developing predictive transcriptomic panels of atopy and atopic asthma, using WBCs, in future longitudinal studies. Although classification models of atopic asthma using transcriptomic data from airway epithelium in adults have shown greater accuracy (AUC=0.99) (11) than that shown in the current study (AUC=0.84), WBCs are easier to collect than nasal or bronchial epithelium (11).
There were differences in both the type of sample (WBCs vs. whole blood) and the platform used to assess gene expression (RNA sequencing vs. microarray) between EVA-PR and BAMSE. This, together with differences in ethnicity and sample size between the two studies, likely explains lack of significant replication of our findings in EVA-PR in BAMSE. However, a previous study of the transcriptomics of atopic dermatitis found generally good correlation between the results of RNA-Seq and microarrays, except for genes with low expression levels (58). Moreover, we found nominal replication at P<0.05, with consistent direction and estimated effect size, for some of our top findings in EVA-PR in BAMSE. Although there were no significant DEGs for atopy or atopic asthma in BAMSE after FDR correction for multiple testing, the top genes associated with atopy or atopic asthma in BAMSE (shown in Table S7) were enriched in pathways for energy-coupled proton and ion transmembrane transport.
In summary, our combined transcriptomic analysis in Puerto Rican and Swedish children identified 59 DEGs by atopy and 40 DEGs by atopic asthma, including SIGLEC8 and IL17RB. Transcriptomic data from WBCs could be used to develop predictive models of atopy and atopic asthma in future prospective studies.
Supplementary Material
Acknowledgements
We thank all the participating children and families.
Funding/Support:
This study was supported by grants HL079966, HL117191, and MD011764 (PI: Celedón JC) from the U.S. National Institutes of Health (NIH). Dr. Forno’s contribution was supported by NIH grant HL125666. Y.J. was supported by the China Scholarship Council. The BAMSE cohort was supported by grants from The Swedish Heart-Lung Foundation, The Swedish Research Council, Stockholm County Council (ALF), the Strategic Research Program (SFO) in Epidemiology at Karolinska Institutet, MeDALL (Mechanisms of the Development of ALLergy; European Union grant agreement No. 261357). E.M. is supported by a grant from the European Research Council (ERC, grant agreement n° 757919, TRIBAL).
Footnotes
Subject Category Descriptor Number: 1.18 Asthma (Genetics), 2.09 Racial, Ethnic, or Social Disparities in Lung Disease and Treatment
Publisher's Disclaimer: This manuscript has recently been accepted for publication in the European Respiratory Journal. It is published here in its accepted form prior to copyediting and typesetting by our production team. After these production processes are complete and the authors have approved the resulting proofs, the article will move to the latest issue of the ERJ online.
References
- 1.Pearce N, Aït-Khaled N, Beasley R, Mallol J, Keil U, Mitchell E, Robertson C. Worldwide trends in the prevalence of asthma symptoms: phase III of the International Study of Asthma and Allergies in Childhood (ISAAC). Thorax 2007; 62: 758–766. [DOI] [PMC free article] [PubMed] [Google Scholar]
- 2.Jacobs TS, Forno E, Brehm JM, Acosta-Perez E, Han YY, Blatter J, Colon-Semidey A, Alvarez M, Canino G, Celedon JC. Underdiagnosis of allergic rhinitis in underserved children. J Allergy Clin Immunol 2014; 134: 737–739 e736. [DOI] [PMC free article] [PubMed] [Google Scholar]
- 3.Rosser FJ, Forno E, Cooper PJ, Celedon JC. Asthma in Hispanics. An 8-year update. Am J Respir Crit Care Med 2014; 189: 1316–1327. [DOI] [PMC free article] [PubMed] [Google Scholar]
- 4.Akinbami LJ, Moorman JE, Bailey C, Zahran HS, King M, Johnson CA, Liu X. Trends in asthma prevalence, health care use, and mortality in the United States, 2001–2010. NCHS Data Brief 2012: 1–8. [PubMed] [Google Scholar]
- 5.Bjerg A, Sandstrom T, Lundback B, Ronmark E. Time trends in asthma and wheeze in Swedish children 1996–2006: prevalence and risk factors by sex. Allergy 2010; 65: 48–55. [DOI] [PubMed] [Google Scholar]
- 6.Dobin A, Davis CA, Schlesinger F, Drenkow J, Zaleski C, Jha S, Batut P, Chaisson M, Gingeras TR. STAR: ultrafast universal RNA-seq aligner. Bioinformatics 2013; 29: 15–21. [DOI] [PMC free article] [PubMed] [Google Scholar]
- 7.Demenais F, Margaritte-Jeannin P, Barnes KC, Cookson WO, Altmüller J, Ang W, Barr RG, Beaty TH, Becker AB, Beilby J. Multiancestry association study identifies new asthma risk loci that colocalize with immune-cell enhancer marks. Nature genetics 2018; 50: 42. [DOI] [PMC free article] [PubMed] [Google Scholar]
- 8.Waage J, Standl M, Curtin JA, Jessen LE, Thorsen J, Tian C, Schoettler N, Flores C, Abdellaoui A, Ahluwalia TS, Alves AC, Amaral AFS, Anto JM, Arnold A, Barreto-Luis A, Baurecht H, van Beijsterveldt CEM, Bleecker ER, Bonas-Guarch S, Boomsma DI, Brix S, Bunyavanich S, Burchard EG, Chen Z, Curjuric I, Custovic A, den Dekker HT, Dharmage SC, Dmitrieva J, Duijts L, Ege MJ, Gauderman WJ, Georges M, Gieger C, Gilliland F, Granell R, Gui H, Hansen T, Heinrich J, Henderson J, Hernandez-Pacheco N, Holt P, Imboden M, Jaddoe VWV, Jarvelin MR, Jarvis DL, Jensen KK, Jonsdottir I, Kabesch M, Kaprio J, Kumar A, Lee YA, Levin AM, Li X, Lorenzo-Diaz F, Melen E, Mercader JM, Meyers DA, Myers R, Nicolae DL, Nohr EA, Palviainen T, Paternoster L, Pennell CE, Pershagen G, Pino-Yanes M, Probst-Hensch NM, Ruschendorf F, Simpson A, Stefansson K, Sunyer J, Sveinbjornsson G, Thiering E, Thompson PJ, Torrent M, Torrents D, Tung JY, Wang CA, Weidinger S, Weiss S, Willemsen G, Williams LK, Ober C, Hinds DA, Ferreira MA, Bisgaard H, Strachan DP, Bonnelykke K. Genome-wide association and HLA fine-mapping studies identify risk loci and genetic pathways underlying allergic rhinitis. Nat Genet 2018; 50: 1072–1080. [DOI] [PMC free article] [PubMed] [Google Scholar]
- 9.Yick CY, Zwinderman AH, Kunst PW, Grunberg K, Mauad T, Dijkhuis A, Bel EH, Baas F, Lutter R, Sterk PJ. Transcriptome sequencing (RNA-Seq) of human endobronchial biopsies: asthma versus controls. Eur Respir J 2013; 42: 662–670. [DOI] [PubMed] [Google Scholar]
- 10.Poole A, Urbanek C, Eng C, Schageman J, Jacobson S, O’Connor BP, Galanter JM, Gignoux CR, Roth LA, Kumar R, Lutz S, Liu AH, Fingerlin TE, Setterquist RA, Burchard EG, Rodriguez-Santana J, Seibold MA. Dissecting childhood asthma with nasal transcriptomics distinguishes subphenotypes of disease. J Allergy Clin Immunol 2014; 133: 670–678 e612. [DOI] [PMC free article] [PubMed] [Google Scholar]
- 11.Pandey G, Pandey OP, Rogers AJ, Ahsen ME, Hoffman GE, Raby BA, Weiss ST, Schadt EE, Bunyavanich S. A Nasal Brush-based Classifier of Asthma Identified by Machine Learning Analysis of Nasal RNA Sequence Data. Sci Rep 2018; 8: 8826. [DOI] [PMC free article] [PubMed] [Google Scholar]
- 12.Pascual M, Roa S, Garcia-Sanchez A, Sanz C, Hernandez-Hernandez L, Greally JM, Lorente F, Davila I, Isidoro-Garcia M. Genome-wide expression profiling of B lymphocytes reveals IL4R increase in allergic asthma. J Allergy Clin Immunol 2014; 134: 972–975. [DOI] [PubMed] [Google Scholar]
- 13.Howrylak JA, Moll M, Weiss ST, Raby BA, Wu W, Xing EP. Gene expression profiling of asthma phenotypes demonstrates molecular signatures of atopy and asthma control. J Allergy Clin Immunol 2016; 137: 1390–1397.e1396. [DOI] [PMC free article] [PubMed] [Google Scholar]
- 14.Croteau-Chonka DC, Qiu W, Martinez FD, Strunk RC, Lemanske RF Jr, Liu AH, Gilliland FD, Millstein J, Gauderman WJ, Ober C. Gene expression profiling in blood provides reproducible molecular insights into asthma control. American journal of respiratory and critical care medicine 2017; 195: 179–188. [DOI] [PMC free article] [PubMed] [Google Scholar]
- 15.Bird HR, Davies M, Duarte CS, Shen S, Loeber R, Canino GJ. A study of disruptive behavior disorders in Puerto Rican youth: II. Baseline prevalence, comorbidity, and correlates in two sites. J Am Acad Child Adolesc Psychiatry 2006; 45: 1042–1053. [DOI] [PubMed] [Google Scholar]
- 16.Brehm JM, Acosta-Perez E, Klei L, Roeder K, Barmada M, Boutaoui N, Forno E, Kelly R, Paul K, Sylvia J, Litonjua AA, Cabana M, Alvarez M, Colon-Semidey A, Canino G, Celedon JC. Vitamin D insufficiency and severe asthma exacerbations in Puerto Rican children. Am J Respir Crit Care Med 2012; 186: 140–146. [DOI] [PMC free article] [PubMed] [Google Scholar]
- 17.Forno E, Cloutier MM, Datta S, Paul K, Sylvia J, Calvert D, Thornton-Thompson S, Wakefield DB, Brehm J, Hamilton RG, Alvarez M, Colon-Semidey A, Acosta-Perez E, Canino G, Celedon JC. Mouse allergen, lung function, and atopy in Puerto Rican children. PLoS One 2012; 7: e40383. [DOI] [PMC free article] [PubMed] [Google Scholar]
- 18.Andrews S FastQC: a quality control tool for high throughput sequence data. 2010. [Google Scholar]
- 19.Krueger F Trim Galore!: A wrapper tool around Cutadapt and FastQC to consistently apply quality and adapter trimming to FastQ files. 0.4; 2015. [Google Scholar]
- 20.Martin M Cutadapt removes adapter sequences from high-throughput sequencing reads. EMBnet journal 2011; 17: pp. 10–12. [Google Scholar]
- 21.Li B, Dewey CN. RSEM: accurate transcript quantification from RNA-Seq data with or without a reference genome. BMC bioinformatics 2011; 12: 323. [DOI] [PMC free article] [PubMed] [Google Scholar]
- 22.Brehm JM, Acosta-Pérez E, Klei L, Roeder K, Barmada MM, Boutaoui N, Forno E, Cloutier MM, Datta S, Kelly R. African ancestry and lung function in Puerto Rican children. Journal of Allergy and Clinical Immunology 2012; 129: 1484–1490. e1486. [DOI] [PMC free article] [PubMed] [Google Scholar]
- 23.Das S, Forer L, Schönherr S, Sidore C, Locke AE, Kwong A, Vrieze SI, Chew EY, Levy S, McGue M. Next-generation genotype imputation service and methods. Nature genetics 2016; 48: 1284. [DOI] [PMC free article] [PubMed] [Google Scholar]
- 24.McCarthy S, Das S, Kretzschmar W, Delaneau O, Wood AR, Teumer A, Kang HM, Fuchsberger C, Danecek P, Sharp K, Luo Y, Sidore C, Kwong A, Timpson N, Koskinen S, Vrieze S, Scott LJ, Zhang H, Mahajan A, Veldink J, Peters U, Pato C, van Duijn CM, Gillies CE, Gandin I, Mezzavilla M, Gilly A, Cocca M, Traglia M, Angius A, Barrett JC, Boomsma D, Branham K, Breen G, Brummett CM, Busonero F, Campbell H, Chan A, Chen S, Chew E, Collins FS, Corbin LJ, Smith GD, Dedoussis G, Dorr M, Farmaki AE, Ferrucci L, Forer L, Fraser RM, Gabriel S, Levy S, Groop L, Harrison T, Hattersley A, Holmen OL, Hveem K, Kretzler M, Lee JC, McGue M, Meitinger T, Melzer D, Min JL, Mohlke KL, Vincent JB, Nauck M, Nickerson D, Palotie A, Pato M, Pirastu N, McInnis M, Richards JB, Sala C, Salomaa V, Schlessinger D, Schoenherr S, Slagboom PE, Small K, Spector T, Stambolian D, Tuke M, Tuomilehto J, Van den Berg LH, Van Rheenen W, Volker U, Wijmenga C, Toniolo D, Zeggini E, Gasparini P, Sampson MG, Wilson JF, Frayling T, de Bakker PI, Swertz MA, McCarroll S, Kooperberg C, Dekker A, Altshuler D, Willer C, Iacono W, Ripatti S, Soranzo N, Walter K, Swaroop A, Cucca F, Anderson CA, Myers RM, Boehnke M, McCarthy MI, Durbin R, Haplotype Reference C. A reference panel of 64,976 haplotypes for genotype imputation. Nat Genet 2016; 48: 1279–1283. [DOI] [PMC free article] [PubMed] [Google Scholar]
- 25.Gref A, Merid SK, Gruzieva O, Ballereau S, Becker A, Bellander T, Bergström A, Bossé Y, Bottai M, Chan-Yeung M. Genome-wide interaction analysis of air pollution exposure and childhood asthma with functional follow-up. American journal of respiratory and critical care medicine 2017; 195: 1373–1383. [DOI] [PMC free article] [PubMed] [Google Scholar]
- 26.Irizarry RA, Hobbs B, Collin F, Beazer-Barclay YD, Antonellis KJ, Scherf U, Speed TP. Exploration, normalization, and summaries of high density oligonucleotide array probe level data. Biostatistics 2003; 4: 249–264. [DOI] [PubMed] [Google Scholar]
- 27.Love MI, Huber W, Anders S. Moderated estimation of fold change and dispersion for RNA-seq data with DESeq2. Genome biology 2014; 15: 550. [DOI] [PMC free article] [PubMed] [Google Scholar]
- 28.Lee CH, Cook S, Lee JS, Han B. Comparison of Two Meta-Analysis Methods: Inverse-Variance-Weighted Average and Weighted Sum of Z-Scores. Genomics Inform 2016; 14: 173–180. [DOI] [PMC free article] [PubMed] [Google Scholar]
- 29.Schwarzer G meta: An R package for meta-analysis. R news 2007; 7: 40–45. [Google Scholar]
- 30.Shabalin AA. Matrix eQTL: ultra fast eQTL analysis via large matrix operations. Bioinformatics 2012; 28: 1353–1358. [DOI] [PMC free article] [PubMed] [Google Scholar]
- 31.Krämer A, Green J, Pollard J Jr, Tugendreich S. Causal analysis approaches in ingenuity pathway analysis. Bioinformatics 2013; 30: 523–530. [DOI] [PMC free article] [PubMed] [Google Scholar]
- 32.Wang T, Ren Z, Ding Y, Fang Z, Sun Z, MacDonald ML, Sweet RA, Wang J, Chen W. FastGGM: an efficient algorithm for the inference of gaussian graphical model in biological networks. PLoS computational biology 2016; 12: e1004755. [DOI] [PMC free article] [PubMed] [Google Scholar]
- 33.Lonsdale J, Thomas J, Salvatore M, Phillips R, Lo E, Shad S, Hasz R, Walters G, Garcia F, Young N. The genotype-tissue expression (GTEx) project. Nature genetics 2013; 45: 580. [DOI] [PMC free article] [PubMed] [Google Scholar]
- 34.Newman AM, Liu CL, Green MR, Gentles AJ, Feng W, Xu Y, Hoang CD, Diehn M, Alizadeh AA. Robust enumeration of cell subsets from tissue expression profiles. Nat Methods 2015; 12: 453–457. [DOI] [PMC free article] [PubMed] [Google Scholar]
- 35.Yokoi H, Choi OH, Hubbard W, Lee H-S, Canning BJ, Lee HH, Ryu S-D, von Gunten S, Bickel CA, Hudson SA. Inhibition of FcεRI-dependent mediator release and calcium flux from human mast cells by sialic acid–binding immunoglobulin-like lectin 8 engagement. Journal of allergy and clinical immunology 2008; 121: 499–505. e491. [DOI] [PubMed] [Google Scholar]
- 36.Choy DF, Jia G, Abbas AR, Morshead KB, Lewin-Koh N, Dua R, Rivera P, Moonsamy P, Fontecha M, Balasubramanyam A. Peripheral blood gene expression predicts clinical benefit from anti–IL-13 in asthma. Journal of Allergy and Clinical Immunology 2016; 138: 1230–1233. e1238. [DOI] [PubMed] [Google Scholar]
- 37.Gao P-S, Shimizu K, Grant AV, Rafaels N, Zhou L-F, Hudson SA, Konno S, Zimmermann N, Araujo MI, Ponte EV. Polymorphisms in the sialic acid-binding immunoglobulin-like lectin-8 (Siglec-8) gene are associated with susceptibility to asthma. European Journal of Human Genetics 2010; 18: 713. [DOI] [PMC free article] [PubMed] [Google Scholar]
- 38.Demenais F, Margaritte-Jeannin P, Barnes KC, Cookson WOC, Altmuller J, Ang W, Barr RG, Beaty TH, Becker AB, Beilby J, Bisgaard H, Bjornsdottir US, Bleecker E, Bonnelykke K, Boomsma DI, Bouzigon E, Brightling CE, Brossard M, Brusselle GG, Burchard E, Burkart KM, Bush A, Chan-Yeung M, Chung KF, Couto Alves A, Curtin JA, Custovic A, Daley D, de Jongste JC, Del-Rio-Navarro BE, Donohue KM, Duijts L, Eng C, Eriksson JG, Farrall M, Fedorova Y, Feenstra B, Ferreira MA, Freidin MB, Gajdos Z, Gauderman J, Gehring U, Geller F, Genuneit J, Gharib SA, Gilliland F, Granell R, Graves PE, Gudbjartsson DF, Haahtela T, Heckbert SR, Heederik D, Heinrich J, Heliovaara M, Henderson J, Himes BE, Hirose H, Hirschhorn JN, Hofman A, Holt P, Hottenga J, Hudson TJ, Hui J, Imboden M, Ivanov V, Jaddoe VWV, James A, Janson C, Jarvelin MR, Jarvis D, Jones G, Jonsdottir I, Jousilahti P, Kabesch M, Kahonen M, Kantor DB, Karunas AS, Khusnutdinova E, Koppelman GH, Kozyrskyj AL, Kreiner E, Kubo M, Kumar R, Kumar A, Kuokkanen M, Lahousse L, Laitinen T, Laprise C, Lathrop M, Lau S, Lee YA, Lehtimaki T, Letort S, Levin AM, Li G, Liang L, Loehr LR, London SJ, Loth DW, Manichaikul A, Marenholz I, Martinez FJ, Matheson MC, Mathias RA, Matsumoto K, Mbarek H, McArdle WL, Melbye M, Melen E, Meyers D, Michel S, Mohamdi H, Musk AW, Myers RA, Nieuwenhuis MAE, Noguchi E, O’Connor GT, Ogorodova LM, Palmer CD, Palotie A, Park JE, Pennell CE, Pershagen G, Polonikov A, Postma DS, Probst-Hensch N, Puzyrev VP, Raby BA, Raitakari OT, Ramasamy A, Rich SS, Robertson CF, Romieu I, Salam MT, Salomaa V, Schlunssen V, Scott R, Selivanova PA, Sigsgaard T, Simpson A, Siroux V, Smith LJ, Solodilova M, Standl M, Stefansson K, Strachan DP, Stricker BH, Takahashi A, Thompson PJ, Thorleifsson G, Thorsteinsdottir U, Tiesler CMT, Torgerson DG, Tsunoda T, Uitterlinden AG, van der Valk RJP, Vaysse A, Vedantam S, von Berg A, von Mutius E, Vonk JM, Waage J, Wareham NJ, Weiss ST, White WB, Wickman M, Widen E, Willemsen G, Williams LK, Wouters IM, Yang JJ, Zhao JH, Moffatt MF, Ober C, Nicolae DL. Multiancestry association study identifies new asthma risk loci that colocalize with immune-cell enhancer marks. Nat Genet 2018; 50: 42–53. [DOI] [PMC free article] [PubMed] [Google Scholar]
- 39.Hwang SM, Uhm TG, Lee SK, Kong SK, Jung KH, Binas B, Chai YG, Park SW, Chung IY. Olig2 is expressed late in human eosinophil development and controls Siglec-8 expression. Journal of leukocyte biology 2016; 100: 711–723. [DOI] [PubMed] [Google Scholar]
- 40.Croteau-Chonka DC, Qiu W, Martinez FD, Strunk RC, Lemanske RF Jr., Liu AH, Gilliland FD, Millstein J, Gauderman WJ, Ober C, Krishnan JA, White SR, Naureckas ET, Nicolae DL, Barnes KC, London SJ, Barraza-Villarreal A, Carey VJ, Weiss ST, Raby BA. Gene Expression Profiling in Blood Provides Reproducible Molecular Insights into Asthma Control. Am J Respir Crit Care Med 2017; 195: 179–188. [DOI] [PMC free article] [PubMed] [Google Scholar]
- 41.Gomez G, Nardone V, Lotfi-Emran S, Zhao W, Schwartz LB. Intracellular adenosine inhibits IgE-dependent degranulation of human skin mast cells. Journal of clinical immunology 2013; 33: 1349–1359. [DOI] [PMC free article] [PubMed] [Google Scholar]
- 42.Forno E, Wang T, Yan Q, Brehm J, Acosta-Perez E, Colon-Semidey A, Alvarez M, Boutaoui N, Cloutier MM, Alcorn JF. A multiomics approach to identify genes associated with childhood asthma risk and morbidity. American journal of respiratory cell and molecular biology 2017; 57: 439–447. [DOI] [PMC free article] [PubMed] [Google Scholar]
- 43.Vercelli D Discovering susceptibility genes for asthma and allergy. Nature reviews immunology 2008; 8: 169. [DOI] [PubMed] [Google Scholar]
- 44.Chen W, Wang T, Pino-Yanes M, Forno E, Liang L, Yan Q, Hu D, Weeks DE, Baccarelli A, Acosta-Perez E, Eng C, Han YY, Boutaoui N, Laprise C, Davies GA, Hopkin JM, Moffatt MF, Cookson W, Canino G, Burchard EG, Celedon JC. An epigenome-wide association study of total serum IgE in Hispanic children. J Allergy Clin Immunol 2017; 140: 571–577. [DOI] [PMC free article] [PubMed] [Google Scholar]
- 45.Weathington NM, Kanth SM, Gong Q, Londino J, Hoji A, Rojas M, Trudeau J, Wenzel S, Mallampalli RK. IL-4 Induces IL17Rb Gene Transcription in Monocytic Cells with Coordinate Autocrine IL-25 Signaling. American journal of respiratory cell and molecular biology 2017; 57: 346–354. [DOI] [PMC free article] [PubMed] [Google Scholar]
- 46.Petersen BC, Budelsky AL, Baptist AP, Schaller MA, Lukacs NW. Interleukin-25 induces type 2 cytokine production in a steroid-resistant interleukin-17RB+ myeloid population that exacerbates asthmatic pathology. Nature medicine 2012; 18: 751. [DOI] [PMC free article] [PubMed] [Google Scholar]
- 47.Hunninghake GM, Chu JH, Sharma SS, Cho MH, Himes BE, Rogers AJ, Murphy A, Carey VJ, Raby BA. The CD4+ T-cell transcriptome and serum IgE in asthma: IL17RB and the role of sex. BMC Pulm Med 2011; 11: 17. [DOI] [PMC free article] [PubMed] [Google Scholar]
- 48.Filosto S, Castillo S, Danielson A, Franzi L, Khan E, Kenyon N, Last J, Pinkerton K, Tuder R, Goldkorn T. Neutral sphingomyelinase 2: a novel target in cigarette smoke–induced apoptosis and lung injury. American journal of respiratory cell and molecular biology 2011; 44: 350–360. [DOI] [PMC free article] [PubMed] [Google Scholar]
- 49.Vucic EA, Chari R, Thu KL, Wilson IM, Cotton AM, Kennett JY, Zhang M, Lonergan KM, Steiling K, Brown CJ. DNA methylation is globally disrupted and associated with expression changes in chronic obstructive pulmonary disease small airways. American journal of respiratory cell and molecular biology 2014; 50: 912–922. [DOI] [PMC free article] [PubMed] [Google Scholar]
- 50.Dragon S, Hirst SJ, Lee TH, Gounni AS. IL-17A mediates a selective gene expression profile in asthmatic human airway smooth muscle cells. American journal of respiratory cell and molecular biology 2014; 50: 1053–1063. [DOI] [PMC free article] [PubMed] [Google Scholar]
- 51.Yang Y-G, Tian W-M, Zhang H, Li M, Shang Y-X. Nerve growth factor exacerbates allergic lung inflammation and airway remodeling in a rat model of chronic asthma. Experimental and therapeutic medicine 2013; 6: 1251–1258. [DOI] [PMC free article] [PubMed] [Google Scholar]
- 52.Layland J, Carrick D, Lee M, Oldroyd K, Berry C. Adenosine: physiology, pharmacology, and clinical applications. JACC: Cardiovascular Interventions 2014; 7: 581–591. [DOI] [PubMed] [Google Scholar]
- 53.Tsai Y-H, Parker JS, Yang IV, Kelada SN. Meta-Analysis of Airway Epithelia Gene Expression in Asthma. European Respiratory Journal 2018: 1701962. [DOI] [PMC free article] [PubMed] [Google Scholar]
- 54.Kuo C-HS, Pavlidis S, Loza M, Baribaud F, Rowe A, Pandis I, Sousa A, Corfield J, Djukanovic R, Lutter R. T-helper cell type 2 (Th2) and non-Th2 molecular phenotypes of asthma using sputum transcriptomics in U-BIOPRED. European respiratory journal 2017; 49: 1602135. [DOI] [PubMed] [Google Scholar]
- 55.Forno E, Wang T, Qi C, Yan Q, Xu CJ, Boutaoui N, Han YY, Weeks DE, Jiang Y, Rosser F, Vonk JM, Brouwer S, Acosta-Perez E, Colon-Semidey A, Alvarez M, Canino G, Koppelman GH, Chen W, Celedon JC. DNA methylation in nasal epithelium, atopy, and atopic asthma in children: a genome-wide study. Lancet Respir Med 2018. [DOI] [PMC free article] [PubMed] [Google Scholar]
- 56.Reese SE, Xu CJ, den Dekker HT, Lee MK, Sikdar S, Ruiz-Arenas C, Merid SK, Rezwan FI, Page CM, Ullemar V, Melton PE, Oh SS, Yang IV, Burrows K, Soderhall C, Jima DD, Gao L, Arathimos R, Kupers LK, Wielscher M, Rzehak P, Lahti J, Laprise C, Madore AM, Ward J, Bennett BD, Wang T, Bell DA, Consortium B, Vonk JM, Haberg SE, Zhao S, Karlsson R, Hollams E, Hu D, Richards AJ, Bergstrom A, Sharp GC, Felix JF, Bustamante M, Gruzieva O, Maguire RL, Gilliland F, Baiz N, Nohr EA, Corpeleijn E, Sebert S, Karmaus W, Grote V, Kajantie E, Magnus MC, Ortqvist AK, Eng C, Liu AH, Kull I, Jaddoe VWV, Sunyer J, Kere J, Hoyo C, Annesi-Maesano I, Arshad SH, Koletzko B, Brunekreef B, Binder EB, Raikkonen K, Reischl E, Holloway JW, Jarvelin MR, Snieder H, Kazmi N, Breton CV, Murphy SK, Pershagen G, Anto JM, Relton CL, Schwartz DA, Burchard EG, Huang RC, Nystad W, Almqvist C, Henderson AJ, Melen E, Duijts L, Koppelman GH, London SJ. Epigenome-wide Meta-analysis of DNA Methylation and Childhood Asthma. J Allergy Clin Immunol 2018. [DOI] [PMC free article] [PubMed] [Google Scholar]
- 57.Xu CJ, Soderhall C, Bustamante M, Baiz N, Gruzieva O, Gehring U, Mason D, Chatzi L, Basterrechea M, Llop S, Torrent M, Forastiere F, Fantini MP, Carlsen KCL, Haahtela T, Morin A, Kerkhof M, Merid SK, van Rijkom B, Jankipersadsing SA, Bonder MJ, Ballereau S, Vermeulen CJ, Aguirre-Gamboa R, de Jongste JC, Smit HA, Kumar A, Pershagen G, Guerra S, Garcia-Aymerich J, Greco D, Reinius L, McEachan RRC, Azad R, Hovland V, Mowinckel P, Alenius H, Fyhrquist N, Lemonnier N, Pellet J, Auffray C, Consortium B, van der Vlies P, van Diemen CC, Li Y, Wijmenga C, Netea MG, Moffatt MF, Cookson W, Anto JM, Bousquet J, Laatikainen T, Laprise C, Carlsen KH, Gori D, Porta D, Iniguez C, Bilbao JR, Kogevinas M, Wright J, Brunekreef B, Kere J, Nawijn MC, Annesi-Maesano I, Sunyer J, Melen E, Koppelman GH. DNA methylation in childhood asthma: an epigenome-wide meta-analysis. The Lancet Respiratory medicine 2018; 6: 379–388. [DOI] [PubMed] [Google Scholar]
- 58.Suárez-Fariñas M, Ungar B, da Rosa JC, Ewald DA, Rozenblit M, Gonzalez J, Xu H, Zheng X, Peng X, Estrada YD. RNA sequencing atopic dermatitis transcriptome profiling provides insights into novel disease mechanisms with potential therapeutic implications. Journal of Allergy and Clinical Immunology 2015; 135: 1218–1227. [DOI] [PubMed] [Google Scholar]
Associated Data
This section collects any data citations, data availability statements, or supplementary materials included in this article.