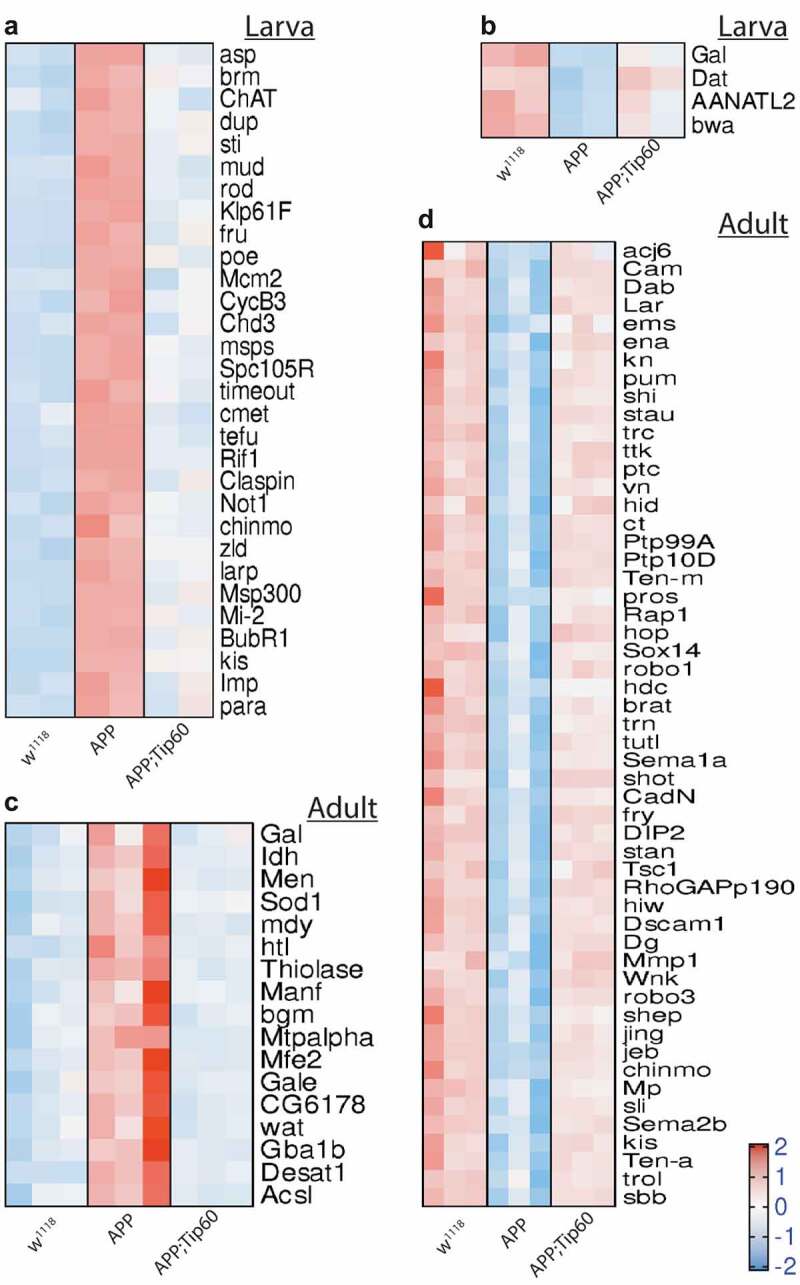
Figure 3.

Heatmaps depicting the relative expression pattern of genes misregulated in APP larval and adult heads and are rescued by Tip60. Representation of genes from the most representative biological processes in the top 25 pathways enriched from the rescue gene list. (a) Heatmap of genes representing the cell-cycle regulation processes and RNA metabolic processes in the third instar larval head. Heatmap of genes representing the lipid metabolic pathways in the (b) third-instar larval head and (c) the adult head. (d) Heatmap of genes representing the axon and dendrite related pathways in the adult head. Log-transformed gene expression values are displayed as colours ranging from red to blue, as shown in the key. Red represents an increase in gene expression, while blue represents a decrease in expression.
