

Abstract
Objectives
Cardiovascular diseases (CVD) burden is rising among persons living with HIV (PLWH) in sub-Saharan Africa. It is unclear whether this reflects absolute increase in HIV-related CVD risk or unmasking by improved survival. We, therefore, examined whether HIV is associated with adverse cardiometabolic profiles among South African adults.
Methods
We analyzed a nationally-representative dataset (n=6,420), estimating weighted prevalence of hypertension, diabetes, and 10-year predicted risk of incident fatal/non-fatal CVD (if ≥40 years old). Associations between HIV and cardiometabolic indices were assessed using log-binomial regression models adjusted for sociodemographic factors.
Results
HIV population prevalence was 18.9% with median age of 36.0 years. Hypertension (44.2 vs. 45.4%), diabetes (18.6 vs. 20.4%) and overweight/obesity (BMI ≥25 kg/m2: 54.9 vs. 52.0%) prevalence did not substantially differ by HIV status, although PLWH had lower 10-year predicted CVD risk (median: 5.1 vs. 13.5%). In adjusted models, HIV- females had a 5 mmHg higher median systolic blood pressure (128 vs. 123 mmHg) than female PLWH.
Conclusions
PLWH in South Africa have better cardiometabolic disease profiles than the general population, and social determinants, rather than HIV, may have a greater influence on cardiometabolic risk. Designating PLWH a CVD high-risk group in South Africa is likely unwarranted.
Keywords: HIV, hypertension, diabetes, obesity, cardiometabolic disease, South Africa
Background
The successful rollout of antiretroviral therapy (ART) in high-income countries (HICs) transformed the clinico-epidemiological profile of HIV infection. Once a rapidly fatal disease, persons living with HIV (PLWH) now have life expectancies nearing, if not equaling, the general population.(Teeraananchai et al., 2017) However, the dramatic decline in incident opportunistic infections (OIs) and AIDS-related cancers (ARCs), which previously were the main manifestations of HIV disease, is mirrored by the emergence of comorbid non-communicable diseases (NCDs), including cardiometabolic disorders.(High et al., 2012) Thus NCDs have emerged as the main drivers of ill-health, disability and premature death in PLWH. For example, treated HIV has gained recognition as a novel cardiovascular disease (CVD) risk factor with PLWH having at least 1.5-fold higher risk of acute myocardial infarction, stroke, and heart failure than the general population.(Shah et al., 2018) By 2030, and mostly driven by rising CVD, 84% of PLWH in HICs will have at least one NCD representing a 3-fold increase (29%) from 2010.(Smit et al., 2018)
This shift from OIs and ARCs to NCDs is also increasingly observed in sub-Saharan Africa (SSA) paralleling increasing access to ART.(Levitt et al., 2011), (Magodoro et al., 2016) Life expectancy has similarly rebounded although PLWH still lag behind the general population.(Nsanzimana et al., 2015) PLWH in HIC and SSA differ with respect to their demographic, socioeconomic and HIV treatment characteristics, among other important exposures, implying potential differences in ageing trajectories and NCD profiles. For example, limited available evidence suggests that female sex may be a CVD risk marker in the general population in SSA(Magodoro et al., 2019), (Mensah et al., 2015) in contrast to male sex in HIC. Indeed, whether HIV in the post-ART era is a novel risk factor for NCDs in SSA is contested. It remains unclear whether the documented rise in prevalent NCDs among PLWH in SSA reflects an absolute increase in HIV-related NCD risk or it is merely their unmasking by improved survival and ageing.(Petersen et al., 2014) Compounding this is the dearth of representative datasets as well as prospective clinical events data. The former means we have limited insights into important PLWH subgroups, including sex, and their differentiated NCD risks while the latter precludes any conclusions about the long-term implications for national health resource needs and patient survival.
Therefore, detailed studies of the epidemiology of HIV/NCDs comorbidity in SSA remain an important and urgent priority. Here, we leverage individual-level data from a large South African nationally representative survey to address this challenge. Specifically, we sought to comprehensively examine if HIV infection is associated with a worse profile of cardiometabolic diseases in the South African adult population. We also examined how these associations might vary with sex in light of evidence, albeit limited, suggesting worse cardiovascular outcomes for women than men in SSA.
Methods
Study Design and Data Collection
We analyzed individual-level data for persons aged at least 15 years who participated in the South Africa Demographic Health Survey 2016 (SA DHS 2016), a multi-stage stratified population-based cross-sectional survey of non-institutionalized South Africans. Complete details of the survey methodology, fieldwork procedures, questionnaire contents, and laboratory testing procedures including quality control measures, are described elsewhere. (National Department of Health and ICF, 2019) Briefly, a sample of 13,300 households representing the country`s sociodemographic and geospatial profile was drawn. Eleven thousand (11,083) of these households (response rate 83%) consented to study participation with all persons in each household eligible for questionnaire-based interviews. In a random subsample of households, persons aged at least 15 years old were consented for physical examination and blood testing (Supplementary Figure 1).
Participant information on tobacco and alcohol use, consumption of salt, fruit and vegetables, and self-reported clinician-made diagnosis of hypertension was captured. Height, weight, and waist circumference were measured. Three blood pressure (BP) and corresponding heart rate (HR) readings were taken with participants seated using digital monitors (Omron 1300, Omron Healthcare, Bannockburn, IL, USA) and appropriate cuff sizes. The BP and HR readings were taken at least 3 minutes apart after a 5-minute rest with the average of the second and third measurements used as the final BP and HR reading, respectively.
Finger prick to collect blood for glycated hemoglobin (HbA1c) and HIV testing was done on a filter paper card, dried overnight, and stored at −20°C. HbA1c was measured using a blood chemistry analyzer (Hitachi 912 Analyzer, Hitachi, Tokyo, Japan) using the Roche Tina-quant® II immunoturbidimetric assay. HIV status was ascertained by an HIV antibody testing algorithm with three different immunoassays. All data were collected between June and November 2016.
Ethics
The study protocol was approved by the South African Medical Research Council (SAMRC)’s Research Ethics Committee and the Institutional Review Board of ICF. All participants aged 17 years or older gave written informed consent while those younger than 17 years provided assent preceding consent from their parent/guardian.
Role of funding source
Research reported in this publication was supported by the Fogarty International Center and National Institute of Mental Health, of the National Institutes of Health under Award Number D43 TW010543. The funder had no role in study design; in the collection, analysis, and interpretation of data; in the writing of the report; and in the decision to submit the paper for publication.
Definitions
Socio-Demographic Characteristics and Health-Related Behaviors
Sex was self-reported as male or female. We classified BMI as underweight (<18.5kg/m2), normal (18.5 to 24.9kg/m2), overweight (25 0–29 9kg/m2) and obese (≥30 0kg/m2) if ≥19 years old. BMI-for-sex/age z scores were used to classify participants aged 15–18 years old as underweight (≤ −2 standard deviations, SD), normal (> −2 SD to +1 SD), overweight (> +1 SD to < +2 SD), and obese (≥+2 SD).(de Onis et al., 2007) Waist circumference was considered increased if ≥102cm for males and ≥88cm for females. The CAGE test was administered to screen for risk of excessive drinking and alcoholism with a score of at least 2 out of 4 considered significant.(Ewing, 1984) We examined the use of e-cigarettes (yes/no) and regular cigarettes, categorizing the latter as daily, less than daily and non-smokers. Race was self-reported as Black, White, Colored (for mixed race) or Indian/Asian; and marital status as never married, married/lives with partner, or separated/divorced/widowed. Socioeconomic status was described according to the multidimensional deprivation index (MPI).(Alkire et al., 2020) This non-monetary indicator of socioeconomic status, measures multiple joint deprivations in basic functionings (ten weighted indicators in health, education and living standards) that are experienced by individuals. We reported the proportions of people living in poverty, vulnerable to poverty and not living in poverty in the South African population. The MPI identifies a person as poor if deprived in at least 33 3% of the weighted indicators, and as vulnerable to poverty if deprived in 20 0 to 33 3% of weighted indicators.
Hypertension, Diabetes Mellitus, and Comorbidity
Hypertension was defined as systolic blood pressure (SBP) ≥140mmHg and/or diastolic blood pressure (DBP) ≥90mmHg according to current South African clinical practice guidelines (Hypertension guideline working et al., 2014) or as self-reported current use of clinician prescribed antihypertensives. We classified hypertension into three categories: controlled hypertension defined as self-reported use of antihypertensive medication and SBP <140 and DBP <90 mmHg, grade 1 hypertension defined as a SBP between 140 to159 or DBP 90 to 99 mmHg, grade 2 defined as SBP of 160–179 or DBP of 100–109 mmHg and grade 3 as SBP ≥180 or DBP ≥ 110 mmHg.(Hypertension guideline working et al., 2014) Diabetes mellitus (diabetes) was defined as HbA1c ≥6.5%, while pre-diabetes was defined as HbA1c 5 7–6 4%.(American Diabetes, 2012) Data on usage of hypoglycemic medication were not collected. Comorbidity was the co-occurrence of hypertension and diabetes.
10-Year Predicted Cardiovascular Disease Risk
We estimated the 10-year risk of a first fatal and non-fatal cardiovascular event (stroke or coronary heart disease) among adults aged ≥40 years using the Globorisk score recalibrated for the South African population.(Hajifathalian et al., 2015) This validated office-based tool provides country-specific estimates of 10-year CVD risk based on age, sex, systolic BP, body mass index (BMI), and smoking status. We categorized the predicted CVD risk as low-risk (<10%), intermediate-risk (10 – 30%) and high-risk (≥30%).(Organization, 2020)
Statistical Analysis
We performed a complete case analysis (<4% missingness in key exposure, confounder and outcome variables (HIV status, sex, age, BMI, SBP, DBP and HbA1c). We derived population-representative estimates using inverse probability sampling weights to account for survey design and uneven probabilities of participation in the survey. We described sex-specific population characteristics, covariates and outcomes according to HIV infection status. Studies among PLWH in HIC indicate synergistic effects of obesity and HIV on CVD risk.(Okello et al., 2017) Thus we assessed for effect modification by overweight/obesity of the relationship between HIV and hypertension (Wald test P value for interaction term: p=0 47) or diabetes (p=0 72) to determine if further stratification by BMI categories was warranted.
The main outcomes of interest were prevalent hypertension and diabetes. We used WHO’s standard population (Ahmad et al.) to additionally generate age-standardized estimates of hypertension and diabetes prevalence. We examined the associations between HIV serostatus and hypertension, diabetes and their comorbidity using multivariable adjusted log-binomial regression models, reporting adjusted relative prevalence. Race, marital status, age, sex, smoking, alcohol abuse and multidimensional deprivation were chosen a priori as individual characteristics that confound the relationship between HIV and outcomes based on current evidence (Supplementary figure 1). Adjusted mean differences in systolic BP and HbA1c by HIV status were examined using linear regression models in combination with post-estimation margins. Lastly, we compared 10-year predicted CVD risk between HIV positive versus HIV negative persons. All statistical tests were performed using Stata version 17 0 (StataCorp, College Station, TX).
Results
Derivation of the analytic sample
A total 6,804 participants (≥15 years old) completed HIV testing in addition to physical examination and health questionnaires. Of these, we excluded 110 pregnant women and another 274 participants who had missing data for at least one of the following key variables: HIV (43), sociodemographic characteristics (66), HbA1c (30), DBP (43) and SBP (92). Therefore, the final analytic sample included 6,420 participants (Supplementary Figure 2). The distribution of characteristics of the unweighted analytic sample are summarized in Supplementary Tables 1 and 2.
Socio-demographic and behavioral characteristics
The weighted sample had an overall HIV prevalence of 18 9% (95% CI: 17 6, 20 3), with females twice as likely to be HIV positive as males (23 5% vs. 13 3%). Median (interquartile, IQR) age was similar between the HIV positive [37 0 (29 0, 46 0) years] and HIV negative groups [35 0 (35 0, 55 0) years] although the proportion of HIV positive persons below 50 years old was larger (80 9% vs. 64 9%) (Table 1; Supplementary Figure 3). Compared to their HIV negative peers, HIV positive persons were predominantly of black race (98 2% vs. 81 8%) and more frequently living in or vulnerable to poverty (33 2% vs. 258%). HIV positive males were disproportionately abusing alcohol relative to their HIV negative comparators (23. 5% vs 15 0%). Overall, PLWH were similar to the general population in rates of marital status and rates of smoking and alcohol usage. Characteristics of the unweighted analytic sample are summarized in Supplementary Table 1.
Table 1.
Sociodemographic and behavioral characteristics of weighted population of South African adults (≥15 years old) according to HIV infection status and sex.
| Characteristic | Female | Male | Total | |||
|---|---|---|---|---|---|---|
| HIV Positive | HIV Negative | HIV Positive | HIV Negative | HIV Positive | HIV Negative | |
| Proportion (%) | 12·8 (11·7, 13·9) | 41·5 (39·8, 43·2) | 6·1 (5·2, 7·1) | 39·6 (37·8, 41·) | 18·9 (17·6, 20·3) | 81·1 (79·7, 82·4) |
| Female sex (%) | - | - | - | - | 67.6 (63.4, 71.5) | 51.2 (49.2, 53.2) |
| Agea (years) | 35·0 (28.0, 44·0) | 37·0 (24·0, 57·0) | 39·0 (31·0, 48·0) | 32·0 (21·0, 52·0) | 37·0 (29·0, 46·0) | 35·0 (22·0, 55·0) |
| 15–29 | 29·2 | 37·3 | 16·8 | 46·0 | 25·2 | 41·6 |
| 30–39 | 32·6 | 15·4 | 33·7 | 15·7 | 33·0 | 15·5 |
| 40–49 | 19·1 | 12·2 | 29·2 | 10·7 | 22·4 | 11·5 |
| 50–59 | 13·7 | 13·7 | 12·6 | 11·2 | 13·4 | 12·5 |
| ≥60 | 5·4 | 21·4 | 7·6 | 16·3 | 6·1 | 18·9 |
| Self-reported race (%) | ||||||
| Black | 98·4 | 82·4 | 97·7 | 81·2 | 98·2 | 81·8 |
| White | 0·0 | 5·8 | 0·7 | 8·1 | 0·2 | 6·9 |
| Colored | 1·4 | 10·0 | 1·7 | 8·9 | 1·5 | 9·5 |
| Asian/Indian | 0·2 | 1·8 | 0·0 | 1·8 | 0·1 | 1·8 |
| Multidimensional Poverty (%) | ||||||
| Not living in poverty | 64·8 | 74·2 | 70·8 | 74·2 | 66·8 | 74·2 |
| Vulnerable to poverty | 26·2 | 19·5 | 20·5 | 20·3 | 24·3 | 19·9 |
| Living in poverty | 9·0 | 6·3 | 8·7 | 5·5 | 8·9 | 5·9 |
| Marital Status (%) | ||||||
| Never married | 56·6 | 47·0 | 53·5 | 56·9 | 55·8 | 51·9 |
| Married/lives with partner | 31·1 | 36·3 | 36·8 | 37·4 | 32·9 | 36·8 |
| Separated/divorced/widowed | 12·0 | 16·7 | 9·7 | 5·7 | 11·3 | 11·3 |
| Smoking and Tobacco Use (%) | ||||||
| E-cigarette user | 1·4 | 2·5 | 0·5 | 0·9 | 1·1 | 1·7 |
| Non-user | ||||||
| Cigarette smoking | ||||||
| Non-smoker | 92·8 | 91·2 | 55·2 | 65·2 | 80·6 | 78·5 |
| Less than daily | 5·9 | 7·4 | 37·4 | 28·7 | 16·1 | 17·8 |
| Daily | 1·3 | 1·4 | 7·4 | 6·2 | 3·2 | 3·7 |
| Excess drinking and alcohol abuseb (%) | ||||||
| Low risk | 96·3 | 97·0 | 76·5 | 85·0 | 89·8 | 91·1 |
| High risk | 3·8 | 3·1 | 23·6 | 15·0 | 10·2 | 8·9 |
Values are presented as proportion (95% confidence interval) or median (interquartile range)a or proportion.
Low risk if score ≤1 and high risk if score >1 on the CAGE test.
Prevalence and profiles of hypertension, diabetes mellitus, comorbidity and obesity
The overall crude prevalence of hypertension was 45 1% (95% CI 43 5, 46 8) and that of diabetes was 20 4 (19 0, 21 3). The prevalence of either hypertension (44 2% vs. 45 4%) or diabetes (18 6% vs. 20 4%) did not differ substantially by HIV status. However, co-occurring hypertension and diabetes, i.e., comorbidity, was less common among PLWH (9 6% vs. 13 5%) (Table 2; Supplementary Table 3). Overall, PLWH had a 4 2 mmHg lower mean SBP than the general population (127 5 vs 131 7 mmHg) and higher resting heart rates (80 8 vs. 76 4 beats/minute).
Table 2.
Prevalence of hypertension, diabetes mellitus and obesity in weighted population of South African adults (≥15 years old) according to HIV infection status and sex.
| Characteristic | Female | Male | Total | |||
|---|---|---|---|---|---|---|
| HIV Positive | HIV Negative | HIV Positive | HIV Negative | HIV Positive | HIV Negative | |
| Hypertension | ||||||
| Resting heart rate (beats/minute) | 82·1 (80·8, 83·3) | 79·8 (79·2, 80·4) | 78·2 (76·1, 80·4) | 72·8 (72·1, 73·5) | 80·8 (79·8, 81·9) | 76·4 (75·9, 76·9) |
| Mean systolic BP (mmHg) | 125·4 (123·8, 127·0) | 130·6 (129·5, 131·7) | 131·9 (129·4, 134·4) | 132·9 (131·8, 134·0) | 127·5 (126·2, 128·9) | 131·7 (130·9, 132·5) |
| Mean diastolic BP (mmHg) | 84·9 (83·9, 85·9) | 84·5 (83·9, 85·2) | 87·3 (85·7, 88·9) | 84·9 (84·2, 85·6) | 85·7 (84·8, 86·5) | 84·7 (84·2, 85·2) |
| Crude prevalence (%) | 43·6 (39·1, 48·2) | 46·0 (43·6, 48·4) | 45·6 (37·8, 53·5) | 44·7 (41·8, 47·6) | 44·2 (40·2, 48·3) | 45·4 (43·6, 47·2) |
| Age-standardized prevalence (%) | 43·8 (39·3, 48·4) | 46·8 (44·4, 49·3) | 45·3 (37·5, 53·3) | 45·9 (42·9, 48·9) | 44·3 (40·3, 48·4) | 46··4 (44·5, 48·2) |
| Hypertension categoryb | ||||||
| Controlled | 25·5 (19·3, 32·9) | 18·5 (15·8, 21·4) | 7·7 (4·3, 13·5) | 12·3 (9·5, 15·8) | 19·5 (14·9, 25·2) | 15·5 (13·5, 17·7) |
| Grade 1 | 47·8 (41·1, 54.·6) | 46·0 (42·6, 49·5) | 60·3 (49·7, 70·0) | 54·2 (49·7, 58·6) | 52·0 (46·2, 57·6) | 50·0 (47·2, 52·7) |
| Grade 2 | 16·5 (12·0, 22·1) | 19·0 (16·6, 21·7) | 24·2 (15·7, 35·4) | 19·3 (15·9, 23·1) | 19·0 (14·8, 24·2) | 19·2 (17·1, 21·4) |
| Grade 3 | 10·3 (6·7, 15·5) | 16·5 (14·0, 19·2) | 7·9 (4·4, 13·6) | 14·2 (11·3, 17·7) | 9·5 (6·7, 13·2) | 15·4 (13·4, 17·6) |
| Diabetes Mellitus | ||||||
| Median HbA1ca (%) | 6.2 (5·9, 6·4) | 6·2 (5·9, 6·4) | 6·2 (5·9, 6·4) | 6·1 (5·9, 6·4) | 6·2 (5·9, 6·4) | 6·1 (5·8, 6·4) |
| Crude prevalence (%) | 19·0 (15·7, 23·0) |
24·0 (22·1, 25·9) |
17·5 (12·3, 24·7) |
16·6 (14·5, 18·8) |
18·6 (15·6, 22·0) |
20·4 (19·0, 21·8) |
| Age-standardized prevalence (%) | 19·3 (15·8, 23·3) | 24·6 (22·6, 26·7) | 17·8 (12·3, 25·0) | 16·9 (14·8, 19·3) | 18·8 (15·7, 22·3) | 20·9 (19·5, 22·4) |
| Pre-diabetesc | 70·3 (65·9, 74·3) | 64·6 (62·2, 66·8) | 72·5 (64·9, 79·0) | 70·2 (67·4, 72·9) | 71·0 (67·2, 74·5) | 67·3 (65·5, 69·0) |
| Comorbidity (hypertension and diabetes mellitus) | ||||||
| Crude prevalence (%) | 10·7 (7·9, 14·3) | 16·4 (14·8, 18·1) | 7·3 (4·5, 11·7) | 10·6 (9·0, 12·5) | 9·6 (7·4, 12·4) | 13·5 (12·4, 14·8) |
| Age-standardized prevalence (%) | 10·8 (8·0, 14·5) | 16·6 (15·0, 18·4) | 7·3 (4·5, 11·7) | 10·8 (9·1, 12·8) | 9·7 (7·4, 12·4) | 13·8 (12·6, 15·1) |
| 10-year Predicted Cardiovascular Disease Risk | ||||||
| Median riskα (%) | 6·0 (2·6, 13·4) | 14·6 (6·7, 24·5) | 4·3 (2·3, 10·0) | 12·0 (4·4, 22·6) | 5·1 (2·3, 12·2) | 13·5 (5·6, 23·7) |
| Adiposity | ||||||
| Waist circumference (cm) | 86·6 (85·3, 87·9) | 88·0 (87·3, 88·8) | 83·0 (81·0, 84·9) | 83·3 (82·4, 84·3) | 85·4 (84·3, 86·5) | 85·8 (85·2, 86·3) |
| Increasedd | 42·3 (37·8, 47·0) | 47·5 (45·.0, 50·0) | 7·8 (4·1, 14·5) | 12·6 (10·7, 14·9) | 30·9 (27·3, 34·8) | 30·4 (28·7, 32·2) |
| BMI (kg/m2) | 28·9 (28·2, 29·5) | 29·4 (29·1, 29·8) | 23·4 (22·6, 24·1) | 23·9 (23·6, 24·2) | 27·1 (26·5, 27·7) | 26·7 (26·5, 27·0) |
| Underweighte | 2·6 (1·4, 4·6) | 2·0 (1·5, 2·7) | 5·8 (3·8, 8·6) | 8·8 (7·2, 10·6) | 3·6 (2·6, 5.·1) | 5·3 (4·5, 6·3) |
| Normal | 29·7 (25·6, 34·1) | 28·8 (26·5, 31·1) | 65·4 (57·5, 72·6) | 57·0 (54·0, 59·9) | 41·4 (37·3, 45·7) | 42·7 (40·7, 44·7) |
| Overweight | 28·8 (24·8, 33·1) | 27·5 (25·2, 29·8) | 19·5 (14·0, 26·5) | 21·1 (18·7, 23·6) | 25·7 (22·4, 29·4) | 24·3 (22·7, 26·1) |
| Obese | 39·0 (34·4, 43·7) | 41·8 (39·3, 44·3) | 9·3 (5·3, 16·0) | 13·2 (11·2, 15·4) | 29·2 (25·6, 33·2) | 27·7 (26·0, 29·4) |
Data are presented as mean (95% confidence interval) or median (interquartile range)a.
Controlled hypertension = current use of antihypertensive medication and SBP <140 and DBP <90 mmHg; Grade 1 = SBP 140 to159 or DBP 90 to 99 mmHg; Grade 2 = SBP 160–179 or DBP 100–109 mmHg; Grade 3 = SBP ≥180 or DBP ≥ 110 mmHg.
Pre-diabetes = HbA1c 5·7–6·4% and no current use of hypoglycemic medication.
Waist circumference increased if ≥102cm for males and ≥88cm for females.
Underweight (BMI <18·5kg/m2), normal (18·5 to 24·9kg/m2), overweight (25·0–29·9kg/m2) and obese (≥30·0kg/m2) if ≥19 years old; or underweight (BMI-for-sex/age z score ≤ -2 standard deviations, SD), normal (> -2 SD to +1 SD), overweight (> +1 SD to < +2 SD), and obese (≥+2 SD) if 15–18 years old.
When standardized to the WHO reference population, overall prevalence of hypertension was 46 4 (44 5, 48 2)% and that of diabetes was 20 9 (19 5, 22 4)%, while that of comorbidity was 13 8 (12 6, 15 1)%. Mean waist circumference (WC) and BMI were similar between HIV positive (female: WC 86 6 cm, BMI 28 9 kg/m2; male: WC 83 3 cm, BMI 27 1 kg/m2) and HIV negative (female: WC 88 0 cm, BMI 29 4 kg/m2; male: WC 85 4 cm, BMI 27 1 kg/m2) groups, as were rates of increased waist circumference (HIV positive: 30 9% vs. HIV negative: 30 4%) and overweight/obesity (HIV positive: 54 9% vs. HIV negative: 52 0%).
In HIV/sex subgroup comparisons, female PLWH had lower mean SBP (125 4) and less severe hypertension (grades 2 and 3: 25 87%) than HIV uninfected women (mean SBP: 130 6 mmHg; hypertension grades 2 and 3: 34 5%; while male PLWH had higher DBP (87 3 mmHg) than their HIV negative peers (84 9 mmHg). Female PLWH also had less prevalent diabetes (19 0%) than HIV negative peers (24 0%) (Table 2). The prevalence of hypertension, diabetes and their comorbidity (i.e., hypertension and diabetes) increased sharply with age in both HIV comparison groups (Figure 1; Supplementary Figure 4. Among younger adults (<30 years old), HIV infection was associated with substantially higher prevalence of hypertension in both males (40 0% vs. 22 6%) and females (30 3% vs. 17 7%). PLWH also had higher resting heart rates than HIV negative persons in comparisons stratified by sex (HIV positive male: 78 2 beats/minute vs HIV negative male: 72 8 beats/minute and HIV positive female: 82 1 beats/minute vs HIV negative female: 79 8/minute). In contrast, there were no substantial HIV related differences in adiposity within sex-specific subgroups (mean waist circumference: HIV positive male: 83 3 cm vs. HIV negative male: 85 4 cm; and HIV positive female: 86 6 cm vs. HIV negative female: 88 0 cm) (Table 2).
Fig. 1. Age-specific prevalence of (a) hypertension and (b) diabetes mellitus in weighted population of South African adults (≥15 years old) according to sex and HIV infection status.
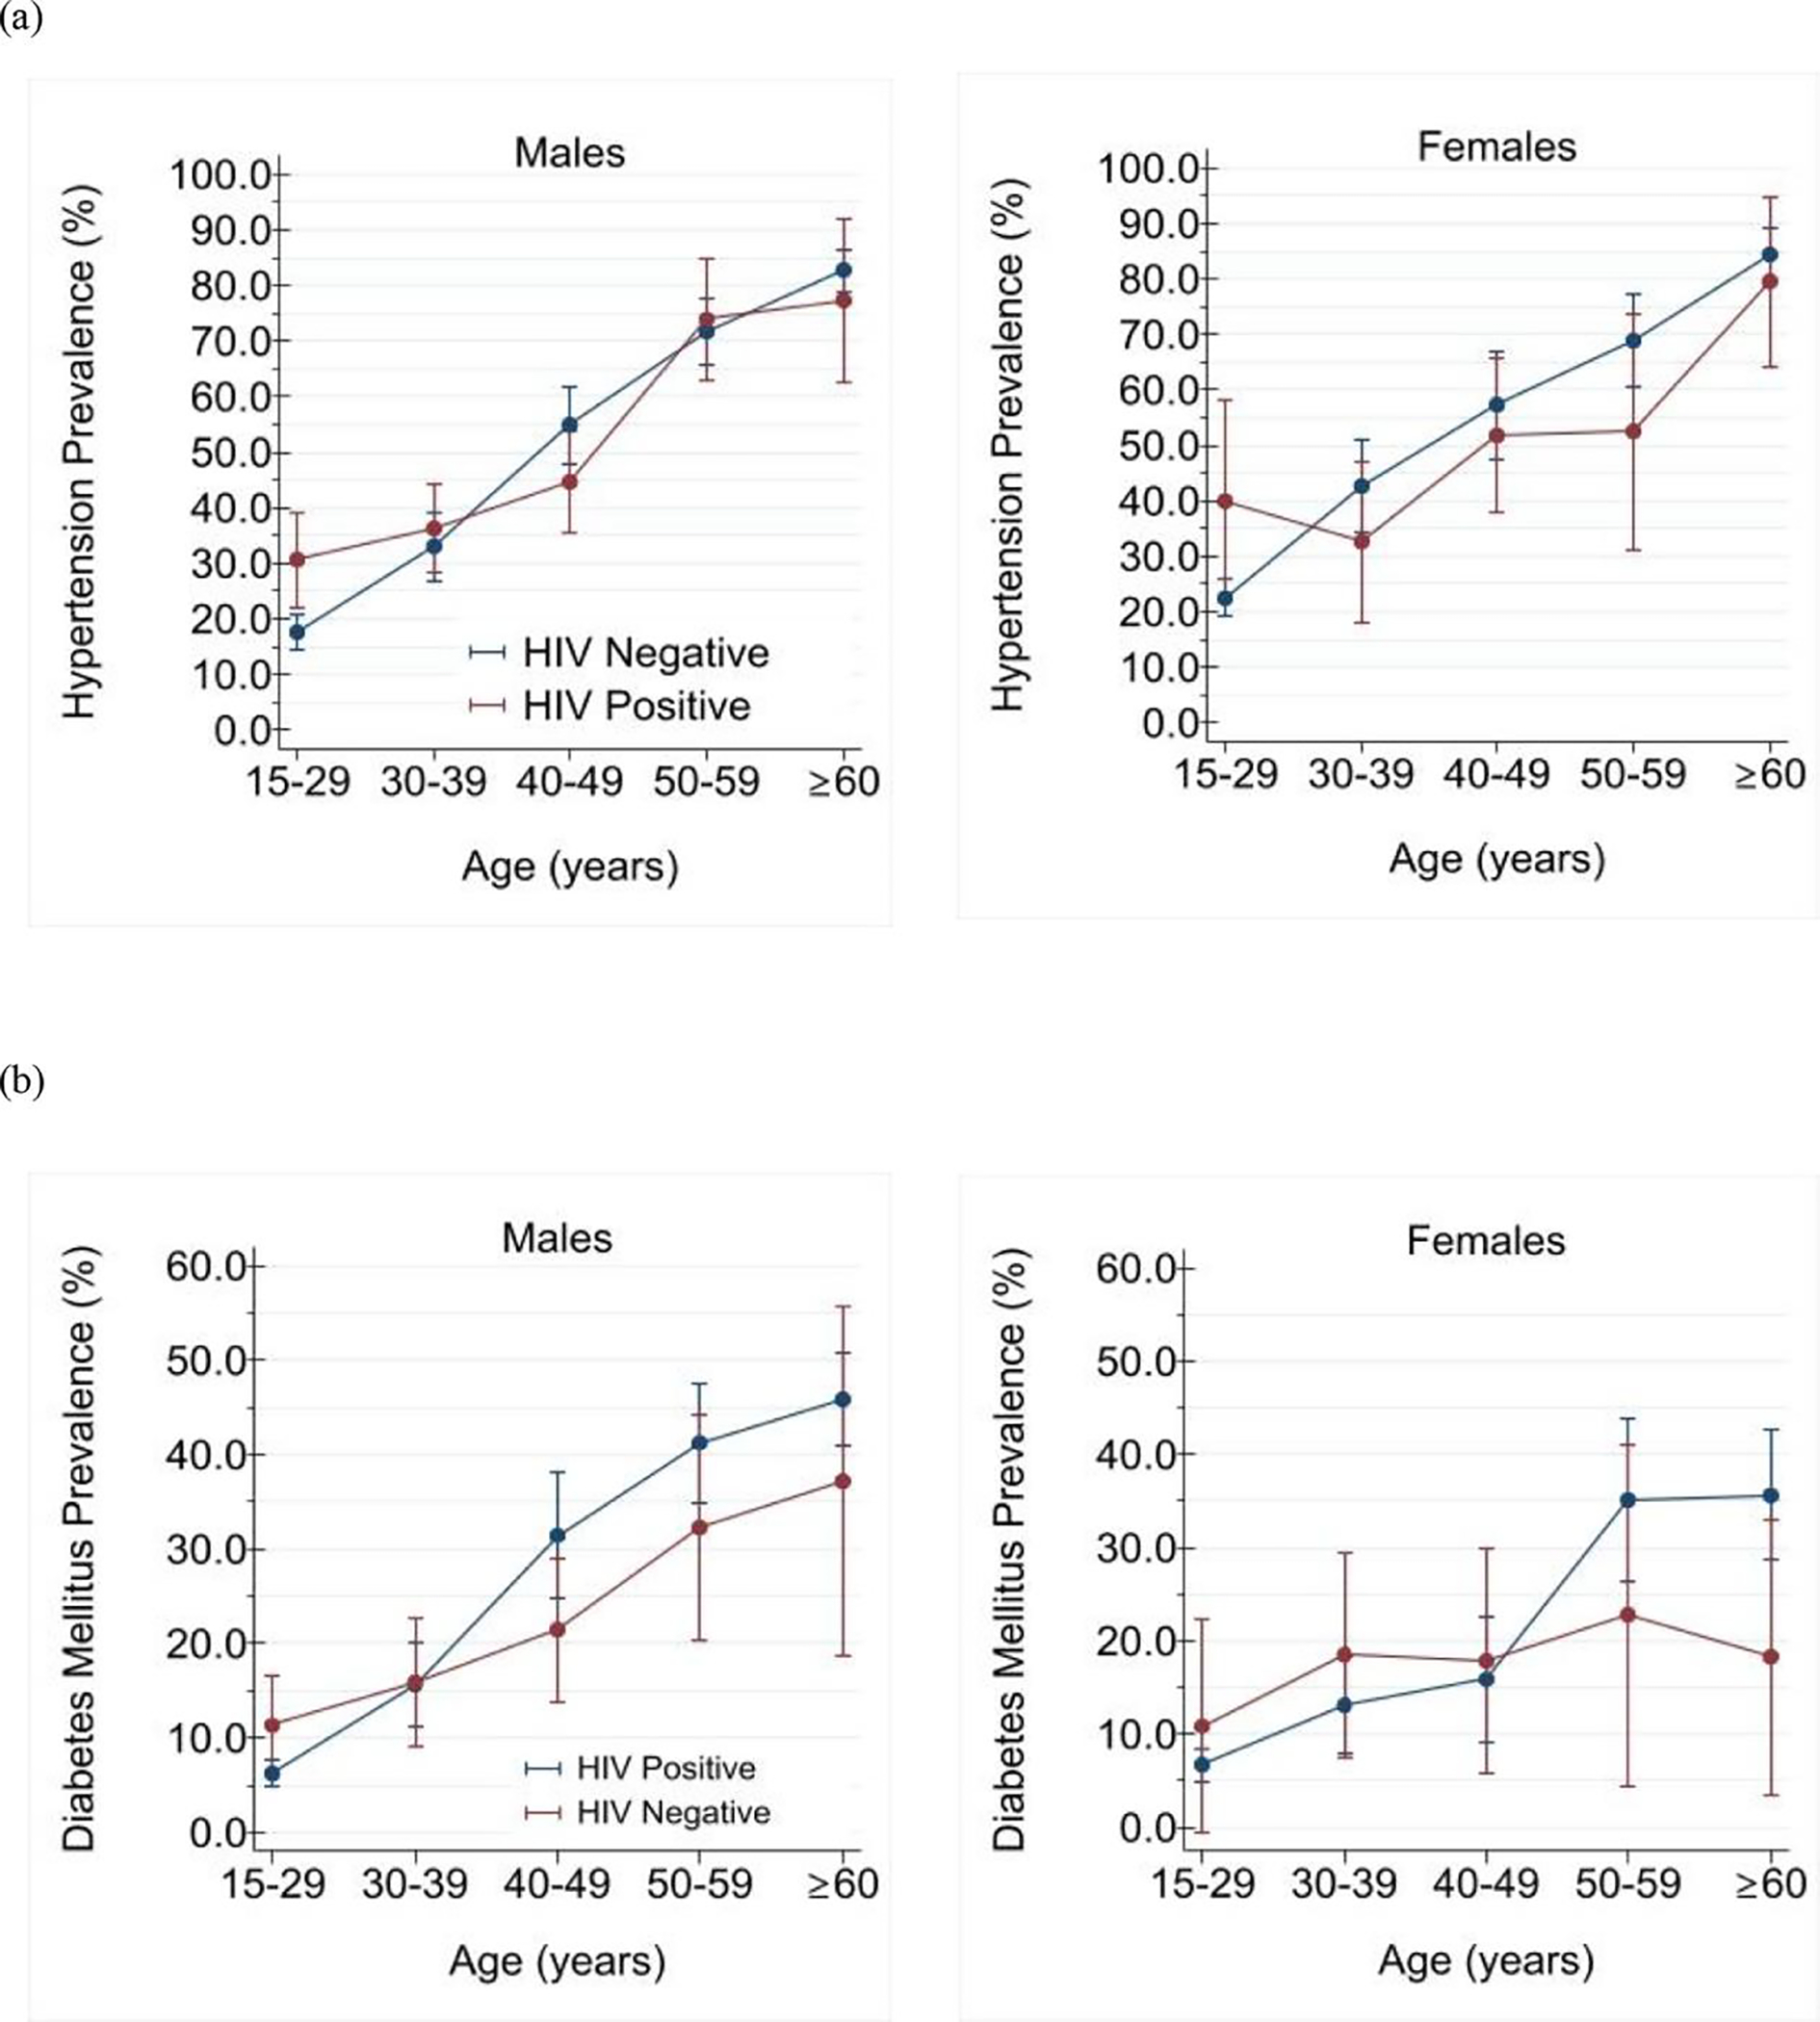
In multivariable adjusted analyses stratified by sex, we found no significant association for either hypertension [adjusted relative prevalence, males: 0 9 (0 8, 1 1); females: 1 1 (0 9, 1 3)] or diabetes [adjusted relative prevalence, males: 1 1 (0 7, 1 5); females: 0 9 (0 7, 1 1)] with HIV (Tables 3, and 4). However, only among women was HIV infection associated with lower adjusted mean SBP and HbA1c (Supplementary Figure 5). Age and race were independently correlated with both prevalent hypertension and diabetes, while marital status and tobacco use were additionally associated with prevalent diabetes. Poverty as measured by multidimensional deprivation was not correlated with either hypertension or diabetes (Tables 3 and 4).
Table 3.
Associations between HIV infection status and hypertension adjusted for sociodemographic characteristics and stratified by sex weighted population of South African adults (≥15 years old).
| Characteristic | Adjusted Relative Prevalencea | |||
|---|---|---|---|---|
| Males | Females | |||
| 95% CI | P value | 95% CI | P value | |
| HIV Status | ||||
| HIV negative | Ref. | Ref | ||
| HIV positive | 0·9 (0·8, 1·1) | 0·48 | 1·1 (0·9, 1·3) | 0·16 |
| Age (years) | ||||
| 15–29 | Ref. | Ref. | ||
| 30–39 | 1·8 (1·4, 2·2) | <0·001 | 1·6 (1·3, 2·0) | <0·001 |
| 40–49 | 2·5 (2·0, 3·1) | <0·001 | 2·5 (2·0, 3·0) | <0·001 |
| 50–59 | 2·9 (2·3, 3·6) | <0·001 | 3·5 (2·9, 4·2) | <0·001 |
| ≥60 | 3·7 (3·0, 4·6) | <0·001 | 4·1 (3·4, 4·9) | <0·001 |
| Self-reported race | ||||
| Black | Ref. | Ref. | ||
| White | 1·2 (0·9, 1·3) | 0·11 | 0·8 (0·7, 1·1) | 0·15 |
| Colored | 1·2 (1·0, 1·4) | 0·028 | 1·2 (1·0, 1·3) | 0·019 |
| Asian/Indian | 1·3 (1·0, 1·7) | 0·028 | 1·0 (0·7, 1·3) | 0·89 |
| Marital Status | ||||
| Never married | Ref. | Ref. | ||
| Married/has partner | 0·9 (0·8, 1·1) | 0·36 | 1·1 (0·8, 1·2) | 0·18 |
| Separated/widowed | 1·0 (0·8, 1·2) | 0·90 | 1·1 (0·9, 1·2) | 0·39 |
| Multidimensional Poverty | ||||
| Not living in poverty | Ref. | Ref. | ||
| Vulnerable to poverty | 1·1 (0·9, 1·3) | 0·30 | 1·0 (0·9, 1·2) | 0·53 |
| Living in poverty | 1·1 (0·9, 1·4) | 0·38 | 1·1 (0·9, 1·4) | 0·16 |
Inverse probability sampling weights applied.
Table 4.
Associations between HIV infection status and diabetes mellitus adjusted for sociodemographic characteristics and stratified by sex weighted population of South African adults (≥15 years old).
| Characteristic | Adjusted Relative Prevalencea | |||
|---|---|---|---|---|
| Males | Females | |||
| 95% CI | P value | 95% CI | P value | |
| HIV Status | ||||
| HIV negative | Ref. | Ref. | ||
| HIV positive | 1·1 (0·7, 1·5) | 0·78 | 0·9 (0·7, 1·1) | 0·23 |
| Age (years) | ||||
| 15–29 | Ref. | Ref. | ||
| 30–39 | 1·9 (1·2, 3·0) | 0·009 | 2·2 (1·6, 3·1) | <0·001 |
| 40–49 | 1·9 (1·1, 3·2) | 0·017 | 3·9 (2·9, 5·4) | <0·001 |
| 50–59 | 3·6 (2·3, 5·5) | <0·001 | 5·4 (4·0, 7·9) | <0·001 |
| ≥60 | 3·4 (2·2, 5·3) | <0·001 | 5·9 (4·5, 7·9) | <0·001 |
| Self-reported race | ||||
| Black | Ref. | Ref. | ||
| White | 0·8 (0.5, 1.4) | 0·47 | 0·4 (0·2, 0·6) | <0·001 |
| Colored | 1·2 (0·8, 1·8) | 0·29 | 0·9 (0·7, 1·2) | 0·35 |
| Asian/Indian | 1·7 (1·0, 3·0) | 0·037 | 1·3 (0·8, 2·1) | 0·39 |
| Marital Status | ||||
| Never married | Ref. | Ref. | ||
| Married/has partner | 1·4 (1·0 1·8) | 0·027 | 1·1 (0·9, 1·3) | 0·51 |
| Separated/widowed | 1·8 (1·1, 2·9) | 0·020 | 1·1 (0·7, 1·4) | 0·29 |
| Excess drinking and alcohol abuse b | ||||
| Low risk | Ref. | Ref. | ||
| High risk | 0·9 (0·6, 1·3) | 0·48 | 0·7 (0·4, 1·1) | 0·14 |
| Tobacco Use | ||||
| Non-smoker | Ref. | Ref. | ||
| Less than daily | 0·9 (0·5; 1·7) | 0·82 | 1·1 (0·5, 2·3) | 0·18 |
| Daily | 0·7 (0·6, 1·0) | 0·022 | 0·81 (0·1, 2·3) | 0·79 |
Inverse probability sampling weights applied.
Low risk if score ≤1 and high risk if score >1 on the CAGE test.
Predicted 10-year cardiovascular disease risk
PLWH had substantially lower predicted 10-year CVD risk relative to their HIV negative peers (median: 5 1% vs. 13 5%) (Table 2; Figure 2). HIV negative men (median (IQR): 12 0 (4 3, 10 0)%) and women (14 6 (6 7, 24 5)%) had nearly 3-fold higher predicted CVD risk than their HIV negative male (4 3 (2 3, 10 0)%) and female (6 0 (2 6, 13 4)%) peers. Overall, 1 in 6 (16 0%) HIV negative persons versus 1 in 56 (1 8%; p<0.001) HIV positive persons were considered to have high 10-year predicted CVD risk using the 10-year CVD risk of 30% or greater as the threshold.(Organization, 2020)
Fig. 2 a. Ten-year predicted cardiovascular diseases (CVD) risk weighted population of South African adults (≥40 years old) according to sex, age, and HIV infection status.
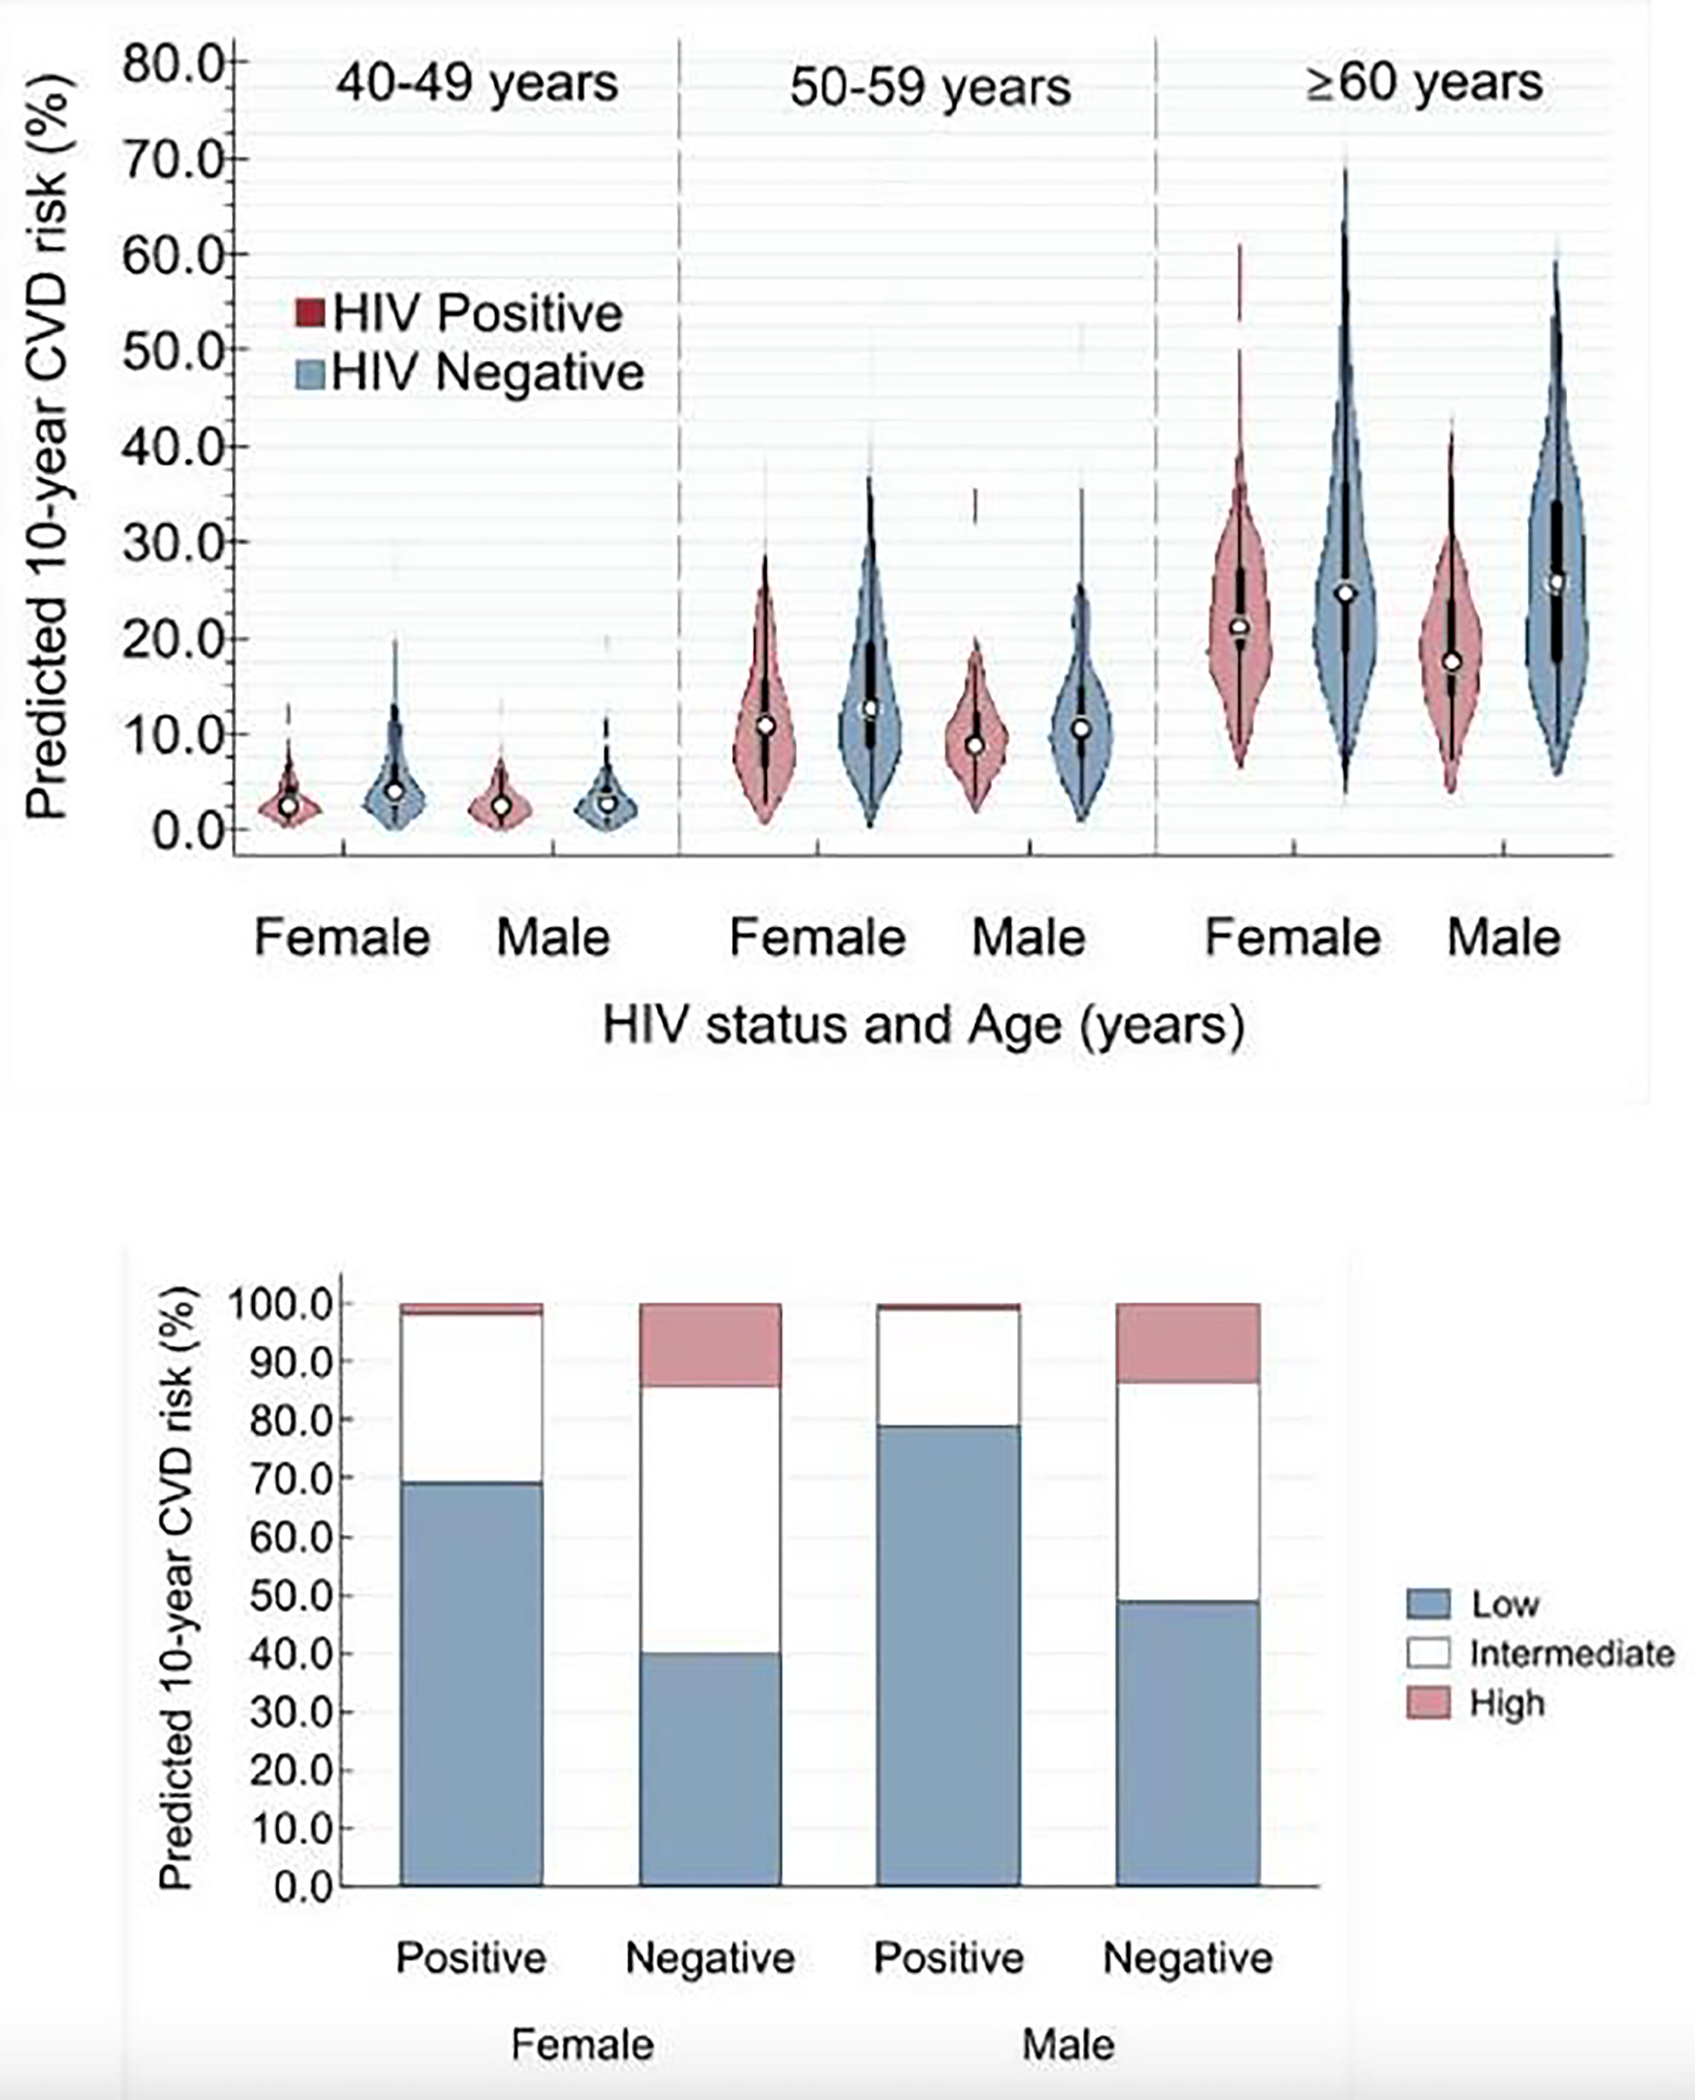
*All within same sex HIV-positive versus HIV-negative comparisons were statistically significant (P <0.010) across all three age groups. 2b. 10-year predicted cardiovascular diseases (CVD) risk categories weighted population of South African adults (≥40 years old) South Africans according to sex and HIV infection status.
*All within same sex HIV-positive versus HIV-negative comparisons were statistically significant (P <0.001 for the comparison of the three categories of CVD risk).
Predicted 10-year CVD risk categorized as low risk (<10%), intermediate risk (10%–30%), and high risk (≥30%).
Discussion
Using a nationally representative sample, we found little evidence associating HIV with increased prevalence of either hypertension or diabetes or their comorbidity among South African adults. Only among adults younger than 30 years was HIV infection significantly associated with higher prevalence of hypertension (males: 40 0% vs. 22 6%; and females: 30 3% vs. 17 7%). Similarly, HIV was not associated with other CVD risk factors including overweight and obesity. Indeed, PLWH in South Africa, in contrast to observations in HICs, may have better cardiometabolic risk profiles than their HIV negative peers as indicated by their much lower predicted 10-year CVD risk. Our results suggest that social determinants and behavioral risk factors such as self-reported race, and marital status and tobacco use, rather than HIV infection, may have greater influence on prevalence of diabetes and hypertension in South Africa. This implies that designating PLWH as a high-risk group for cardiometabolic disease in settings like South Africa may needlessly fragment public health focus and policy resources.
HIV care in South Africa, as in many SSA countries, is a very successful chronic disease care program with over 85% of PLWH being diagnosed, of whom 71% are receiving ART, and 87% of ART patients are virally suppressed.(Marinda et al., 2020) This is in the context of persisting health and socioeconomic inequalities post-apartheid,(Gordon et al., 2020) wherein, for example, among South Africans with a chronic illness, 1 in 10 persons self-identifying as black have private health insurance compared to 7 in 10 of people who identify as white. PLWH enrolled in ART, on the other hand, have regular contact with healthcare services, with increased opportunities for health education, screening and promotion irrespective of their race. This has probable secondary health gains including the prevention and/or early diagnosis and treatment of common NCDs, including cardiometabolic diseases. In fact, limited reports(Mỳambo Magodoro et al., 2019), (Manne-Goehler et al., 2017) in South Africa indicate that PLWH enrolled in ART care have improved rates of hypertension and diabetes diagnosis, treatment and control compared to the general population. Our study examined neither ART linkage nor NCD care cascade indicators. Nonetheless, we hypothesize that the observed favorable cardiometabolic profiles among South African adult PLWH in spite of their greater social disadvantage might be related to improved healthcare access, albeit ART-linked.
The lower systolic BP and less severe hypertension among PLWH in South Africa compared to the general population are consistent with previous reports from across SSA.(Okello et al., 2017), (Vos et al., 2020), (Kwarisiima et al., 2016), This lower SBP among PLWH versus HIV negative peers may also account for their significantly lower 10-year CVD risk estimated using Globorisk equations. The latter are strongly weighted for SBP. Notably, the lack of association between HIV and prevalent hypertension has been described in other African populations(Okello et al., 2017),(Kwarisiima et al., 2016), including a meta-analysis of 29,755 participants.(Dillon et al., 2013) These observations are variously attributed to autonomic cardiovascular dysfunction (autonomia) in chronic HIV infection.(Carod-Artal, 2018), (Chow et al., 2015), (Compostella et al., 2008), (Robinson-Papp and Sharma, 2013), (Rogstad et al., 1999) Autonomia is characterized by increased resting heart rate, reduced heart rate variability and blunted blood pressure responses to stress. While case definitions vary, Nzuobontane et. al. (2002)(Nzuobontane et al., 2002) found autonomia to be more common among ART naïve Cameroonian PLWH than uninfected controls and Lebech et. al. (2007)(Lebech et al., 2007) noted its persistence in treated virally suppressed PLWH in Denmark. We did not formally test for autonomic dysfunction in our study but did observe resting tachycardia among PLWH relative to their HIV negative peers. This warrants further investigations as autonomic dysfunction, whether associated with increased or decreased BP, independently predicts adverse outcomes.(Robinson-Papp and Sharma, 2013), (Beijers et al., 2009)
Cardiometabolic diseases are degenerative disorders and their lower burden among PLWH versus controls likely reflects the relatively younger age of the South African HIV infected population. Mitigating against this, however, might be the fact that HIV infection has been shown in South Africa (Pathai et al., 2013) and elsewhere(High et al., 2012), (Hunt, 2014) to be associated with precocious and accelerated biological ageing. For example, compared to HIV negative patients, HIV infected persons presenting with incident cardiovascular disease or stroke in South Africa (Sliwa et al., 2008), (Sliwa et al., 2012) and Malawi(Benjamin et al., 2016) were found to be up to 14 years younger. Data also suggest that concurrent obesity and HIV/ART may be synergistically detrimental from a cardiometabolic standpoint.(Koethe et al., 2016), (Shah et al., 2014), (Scherzer et al., 2011), (Armah et al., 2014) Of note, our understanding of these relationships derives almost exclusively from studies in HICs. We observed similar (if not lower) diabetes prevalence among PLWH and marginally better HbA1c profiles than HIV negative peers notwithstanding the comparable rates of overweight/obesity between the two groups. This is in keeping with the two prior meta-analyses(Dillon et al., 2013), (Prioreschi et al., 2017) that included only SSA participants. Neither did we find evidence of effect modification between HIV and obesity on diabetes.
Unexpected, however, was our observation of a nearly 2-fold increased risk of hypertension associated with HIV among young adults (15–30 years old) irrespective of sex. A population-based survey in Uganda among similarly aged young adults found lower hypertension prevalence among PLWH compared with their uninfected peers,(Kayima et al., 2015) while perinatally HIV infected young adults (18–29 years old) in the USA were found to have 4.7 times increased risk for hypertension than their HIV uninfected peers.(Ryscavage et al., 2019) The extent to which this age group in South Africa includes perinatally HIV infected persons is unknown. Regardless, if our observations are replicated, this subgroup may be of public health importance as young African PLWH continue to live longer on ART and will warrant detailed cardiovascular phenotyping. Put together, our observations, at variance with data from HIC HIV care settings, further highlight SSA`s need for prospective clinical events data to answer some of these urgent questions.
Strengths
Our study is among the first to report on the HIV/NCD relationship in SSA using a nationally representative sample, and thus achieving wider generalizability of results than the relatively small studies that are currently available in the field. The large sample size allowed detailed explorations of important (age and sex) subgroups for better risk stratification and more precise targeting of interventions and policies. As a population-based study we likely minimized biases arising from differential health-seeking behaviors associated with facility-based studies. Data collection and reporting, including blood pressure, followed standardized protocols allowing the comparison of our findings across at least 90 countries that undertake demographic health surveys.
Limitations
Conversely, the lack of data on HIV disease markers and ART means we could not examine NCD profiles according to important HIV-related characteristics, such as linkage to care and viral suppression. Notable too, BP readings were completed in a single study visit. Thus, the lack of repeat BP measurements, which are recommended by most clinical practice guidelines, means we could not account for potential outcome misclassification due to masked hypertension especially among the young participants. However, this would mean that our results are an underestimation. Our use of Globorisk equations to estimate CVD risk in PLWH warrants cautious interpretation of these results since these equations remain to be validated in the HIV infected population. Lastly, our definition of NCDs was narrow, being limited to only hypertension, diabetes and obesity.
Conclusions
In summary, excerpt among young adults (15–30 years old), we did not find evidence associating HIV infection with increased hypertension, diabetes, their comorbidity or 10-year predicted CVD risk in this nationally representative study of adult South Africans. Further investigations, especially with prospective cohorts and including deeply phenotyped young adult PLWH, are warranted to ascertain the long-term consequences of treated HIV. Notwithstanding, our findings highlight the potential limitations of designating PLWH as a CVD at-high risk group with its implications of fragmenting public health and policy focus in South Africa and possibly in SSA in light of our observation that CVD risk is substantially lower among PLWH.
Supplementary Material
Acknowledgements
Authors would like to thank Dr. Tom Pullum, PhD., and Dr. Mahmoud Elkasabi, PhD, at The DHS Program, ICF International, for their ongoing support.
Sources of Funding Support
IMM is supported by a career development grant from the Fogarty International Center and National Institute of Mental Health of the National Institutes of Health (D43 TW010543). SO is supported by a career development grant from the Fogarty International Institute of the National Institutes of Health (K43TW010715). ACC is supported by career development grants from the Fogarty International Center (D43 TW010543) and the National Institute of Allergy and Infectious Diseases (T32 AI007433) of the National Institutes of Health.
Footnotes
Declaration of interests
All other authors declare no competing interests.
Data sharing
All the data reported in this analysis are freely accessible from the Demographic Health Survey (DHS) Program. https://dhsprogram.com/
References
- Ahmad O, Bosch-Pinto C, Lopez A. Age Standardization of Rates: A New World Standard. EIP/GPR. GPE Discussion Paper Series. [Google Scholar]
- Alkire S, Kanagaratnam U, Suppa N. The Global Multidimensional Poverty Index (MPI) 2020. OPHI MPI Methodological Notes 2020;49. [Google Scholar]
- American Diabetes A. Standards of medical care in diabetes−-2012. Diabetes Care 2012;35 Suppl 1(1):S11–63. [DOI] [PMC free article] [PubMed] [Google Scholar]
- Armah KA, Chang CC, Baker JV, Ramachandran VS, Budoff MJ, Crane HM, et al. Prehypertension, hypertension, and the risk of acute myocardial infarction in HIV-infected and -uninfected veterans. Clin Infect Dis 2014;58(1):121–9. [DOI] [PMC free article] [PubMed] [Google Scholar]
- Beijers HJ, Ferreira I, Bravenboer B, Dekker JM, Nijpels G, Heine RJ, et al. Microalbuminuria and cardiovascular autonomic dysfunction are independently associated with cardiovascular mortality: evidence for distinct pathways: the Hoorn Study. Diabetes Care 2009;32(9):1698–703. [DOI] [PMC free article] [PubMed] [Google Scholar]
- Benjamin LA, Corbett EL, Connor MD, Mzinganjira H, Kampondeni S, Choko A, et al. HIV, antiretroviral treatment, hypertension, and stroke in Malawian adults: A case-control study. Neurology 2016;86(4):324–33. [DOI] [PMC free article] [PubMed] [Google Scholar]
- Carod-Artal FJ. Infectious diseases causing autonomic dysfunction. Clin Auton Res 2018;28(1):67–81. [DOI] [PubMed] [Google Scholar]
- Chow D, Nakamoto BK, Sullivan K, Sletten DM, Fujii S, Umekawa S, et al. Symptoms of autonomic dysfunction in human immunodeficiency virus. Open forum infectious diseases: Oxford University Press; 2015. [DOI] [PMC free article] [PubMed] [Google Scholar]
- Compostella C, Compostella L, D’Elia R. The symptoms of autonomic dysfunction in HIV-positive Africans. Clin Auton Res 2008;18(1):6–12. [DOI] [PubMed] [Google Scholar]
- de Onis M, Onyango AW, Borghi E, Siyam A, Nishida C, Siekmann J. Development of a WHO growth reference for school-aged children and adolescents. Bull World Health Organ 2007;85(9):660–7. [DOI] [PMC free article] [PubMed] [Google Scholar]
- Dillon DG, Gurdasani D, Riha J, Ekoru K, Asiki G, Mayanja BN, et al. Association of HIV and ART with cardiometabolic traits in sub-Saharan Africa: a systematic review and meta-analysis. Int J Epidemiol 2013;42(6):1754–71. [DOI] [PMC free article] [PubMed] [Google Scholar]
- Ewing JA. Detecting alcoholism. The CAGE questionnaire. JAMA 1984;252(14):1905–7. [DOI] [PubMed] [Google Scholar]
- Gordon T, Booysen F, Mbonigaba J. Socio-economic inequalities in the multiple dimensions of access to healthcare: the case of South Africa. BMC Public Health 2020;20(1):289. [DOI] [PMC free article] [PubMed] [Google Scholar]
- Hajifathalian K, Ueda P, Lu Y, Woodward M, Ahmadvand A, Aguilar-Salinas CA, et al. A novel risk score to predict cardiovascular disease risk in national populations (Globorisk): a pooled analysis of prospective cohorts and health examination surveys. Lancet Diabetes Endocrinol 2015;3(5):339–55. [DOI] [PMC free article] [PubMed] [Google Scholar]
- High KP, Brennan-Ing M, Clifford DB, Cohen MH, Currier J, Deeks SG, et al. HIV and aging: state of knowledge and areas of critical need for research. A report to the NIH Office of AIDS Research by the HIV and Aging Working Group. J Acquir Immune Defic Syndr 2012;60 Suppl 1:S1–18. [DOI] [PMC free article] [PubMed] [Google Scholar]
- Hunt PW. HIV and ageing: emerging research issues. Current opinion in HIV and AIDS 2014;9(4):302. [DOI] [PMC free article] [PubMed] [Google Scholar]
- Hypertension guideline working g, Seedat YK, Rayner BL, Veriava Y. South African hypertension practice guideline 2014. Cardiovasc J Afr 2014;25(6):288–94. [DOI] [PMC free article] [PubMed] [Google Scholar]
- Kayima J, Nankabirwa J, Sinabulya I, Nakibuuka J, Zhu X, Rahman M, et al. Determinants of hypertension in a young adult Ugandan population in epidemiological transition-the MEPI-CVD survey. BMC Public Health 2015;15(1):830. [DOI] [PMC free article] [PubMed] [Google Scholar]
- Koethe JR, Grome H, Jenkins CA, Kalams SA, Sterling TR. The metabolic and cardiovascular consequences of obesity in persons with HIV on long-term antiretroviral therapy. AIDS 2016;30(1):83–91. [DOI] [PMC free article] [PubMed] [Google Scholar]
- Kwarisiima D, Balzer L, Heller D, Kotwani P, Chamie G, Clark T, et al. Population-based assessment of hypertension epidemiology and risk factors among HIV-positive and general populations in rural Uganda. PloS one 2016;11(5):e0156309. [DOI] [PMC free article] [PubMed] [Google Scholar]
- Lebech AM, Kristoffersen US, Mehlsen J, Wiinberg N, Petersen CL, Hesse B, et al. Autonomic dysfunction in HIV patients on antiretroviral therapy: studies of heart rate variability. Clin Physiol Funct Imaging 2007;27(6):363–7. [DOI] [PubMed] [Google Scholar]
- Levitt NS, Steyn K, Dave J, Bradshaw D. Chronic noncommunicable diseases and HIV-AIDS on a collision course: relevance for health care delivery, particularly in low-resource settings--insights from South Africa. Am J Clin Nutr 2011;94(6):1690S–6S. [DOI] [PMC free article] [PubMed] [Google Scholar]
- Mỳambo Magodoro I, Oliver S, Gareta D, Modise TH, Koole O, Herbst K, et al. 844. Engagement in HIV Care as an Avenue to Primary Care in Rural South Africa: Results from the Vukuzazi Population Health Platform. Open Forum Infectious Diseases 2019;6(Supplement_2):S13–S4. [Google Scholar]
- Magodoro IM, Esterhuizen TM, Chivese T. A cross-sectional, facility based study of comorbid non-communicable diseases among adults living with HIV infection in Zimbabwe. BMC Res Notes 2016;9:379. [DOI] [PMC free article] [PubMed] [Google Scholar]
- Magodoro IM, Feng M, North CM, Vorechovska D, Kraemer JD, Kakuhikire B, et al. Female sex and cardiovascular disease risk in rural Uganda: a cross-sectional, population-based study. BMC Cardiovasc Disord 2019;19(1):96. [DOI] [PMC free article] [PubMed] [Google Scholar]
- Manne-Goehler J, Montana L, Gómez-Olivé FX, Rohr J, Harling G, Wagner RG, et al. The ART advantage: healthcare utilization for diabetes and hypertension in rural South Africa. Journal of acquired immune deficiency syndromes (1999) 2017;75(5):561. [DOI] [PMC free article] [PubMed] [Google Scholar]
- Marinda E, Simbayi L, Zuma K, Zungu N, Moyo S, Kondlo L, et al. Towards achieving the 90–90-90 HIV targets: results from the south African 2017 national HIV survey. BMC Public Health 2020;20(1):1375. [DOI] [PMC free article] [PubMed] [Google Scholar]
- Mensah GA, Roth GA, Sampson UK, Moran AE, Feigin VL, Forouzanfar MH, et al. Mortality from cardiovascular diseases in sub-Saharan Africa, 1990–2013: a systematic analysis of data from the Global Burden of Disease Study 2013. Cardiovasc J Afr 2015;26(2 Suppl 1):S6–10. [DOI] [PMC free article] [PubMed] [Google Scholar]
- National Department of Health SSA, South African Medical Research Council,, ICF. South Africa demographic and health survey 2016. NDoH, Stats SA, SAMRC, & ICF; 2019. [Google Scholar]
- Nsanzimana S, Remera E, Kanters S, Chan K, Forrest JI, Ford N, et al. Life expectancy among HIV-positive patients in Rwanda: a retrospective observational cohort study. The Lancet Global Health 2015;3(3):e169–e77. [DOI] [PubMed] [Google Scholar]
- Nzuobontane D, Ngu BK, Christopher K. Cardiovascular autonomic dysfunction in Africans infected with human immunodeficiency virus. J R Soc Med 2002;95(9):445–7. [DOI] [PMC free article] [PubMed] [Google Scholar]
- Okello S, Ueda P, Kanyesigye M, Byaruhanga E, Kiyimba A, Amanyire G, et al. Association between HIV and blood pressure in adults and role of body weight as a mediator: Cross-sectional study in Uganda. J Clin Hypertens (Greenwich) 2017;19(11):1181–91. [DOI] [PMC free article] [PubMed] [Google Scholar]
- Organization WH. Hearts: technical package for cardiovascular disease management in primary health care. 2020.
- Pathai S, Lawn SD, Gilbert CE, McGuinness D, McGlynn L, Weiss HA, et al. Accelerated biological ageing in HIV-infected individuals in South Africa: a case-control study. AIDS 2013;27(15):2375–84. [DOI] [PMC free article] [PubMed] [Google Scholar]
- Petersen M, Yiannoutsos CT, Justice A, Egger M. Observational research on NCDs in HIV-positive populations: conceptual and methodological considerations. J Acquir Immune Defic Syndr 2014;67 Suppl 1(0 1):S8–16. [DOI] [PMC free article] [PubMed] [Google Scholar]
- Prioreschi A, Munthali RJ, Soepnel L, Goldstein JA, Micklesfield LK, Aronoff DM, et al. Incidence and prevalence of type 2 diabetes mellitus with HIV infection in Africa: a systematic review and meta-analysis. BMJ Open 2017;7(3):e013953. [DOI] [PMC free article] [PubMed] [Google Scholar]
- Robinson-Papp J, Sharma SK. Autonomic neuropathy in HIV is unrecognized and associated with medical morbidity. AIDS patient care and STDs 2013;27(10):539–43. [DOI] [PMC free article] [PubMed] [Google Scholar]
- Rogstad KE, Shah R, Tesfaladet G, Abdullah M, Ahmed-Jushuf I. Cardiovascular autonomic neuropathy in HIV infected patients. Sex Transm Infect 1999;75(4):264–7. [DOI] [PMC free article] [PubMed] [Google Scholar]
- Ryscavage P, Still W, Nyemba V, Stafford K. Prevalence of Systemic Hypertension Among HIV-Infected and HIV-Uninfected Young Adults in Baltimore, Maryland. Southern medical journal 2019;112(7):387–91. [DOI] [PubMed] [Google Scholar]
- Scherzer R, Heymsfield SB, Lee D, Powderly WG, Tien PC, Bacchetti P, et al. Decreased limb muscle and increased central adiposity are associated with 5-year all-cause mortality in HIV infection. AIDS 2011;25(11):1405–14. [DOI] [PMC free article] [PubMed] [Google Scholar]
- Shah ASV, Stelzle D, Lee KK, Beck EJ, Alam S, Clifford S, et al. Global Burden of Atherosclerotic Cardiovascular Disease in People Living With HIV: Systematic Review and Meta-Analysis. Circulation 2018;138(11):1100–12. [DOI] [PMC free article] [PubMed] [Google Scholar]
- Shah RV, Murthy VL, Abbasi SA, Blankstein R, Kwong RY, Goldfine AB, et al. Visceral adiposity and the risk of metabolic syndrome across body mass index: the MESA Study. JACC Cardiovasc Imaging 2014;7(12):1221–35. [DOI] [PMC free article] [PubMed] [Google Scholar]
- Sliwa K, Carrington MJ, Becker A, Thienemann F, Ntsekhe M, Stewart S. Contribution of the human immunodeficiency virus/acquired immunodeficiency syndrome epidemic to de novo presentations of heart disease in the Heart of Soweto Study cohort. Eur Heart J 2012;33(7):866–74. [DOI] [PMC free article] [PubMed] [Google Scholar]
- Sliwa K, Wilkinson D, Hansen C, Ntyintyane L, Tibazarwa K, Becker A, et al. Spectrum of heart disease and risk factors in a black urban population in South Africa (the Heart of Soweto Study): a cohort study. Lancet 2008;371(9616):915–22. [DOI] [PubMed] [Google Scholar]
- Smit M, Olney J, Ford NP, Vitoria M, Gregson S, Vassall A, et al. The growing burden of noncommunicable disease among persons living with HIV in Zimbabwe. 2018;32(6):773. [DOI] [PMC free article] [PubMed] [Google Scholar]
- Teeraananchai S, Kerr SJ, Amin J, Ruxrungtham K, Law MG. Life expectancy of HIV-positive people after starting combination antiretroviral therapy: a meta-analysis. HIV Med 2017;18(4):256–66. [DOI] [PubMed] [Google Scholar]
- Vos AG, Barth RE, Klipstein-Grobusch K, Tempelman HA, Deville WLJ, Dodd C, et al. Cardiovascular Disease Burden in Rural Africa: Does HIV and Antiretroviral Treatment Play a Role?: Baseline Analysis of the Ndlovu Cohort Study. J Am Heart Assoc 2020;9(7):e013466. [DOI] [PMC free article] [PubMed] [Google Scholar]
Associated Data
This section collects any data citations, data availability statements, or supplementary materials included in this article.
Supplementary Materials
Data Availability Statement
All the data reported in this analysis are freely accessible from the Demographic Health Survey (DHS) Program. https://dhsprogram.com/