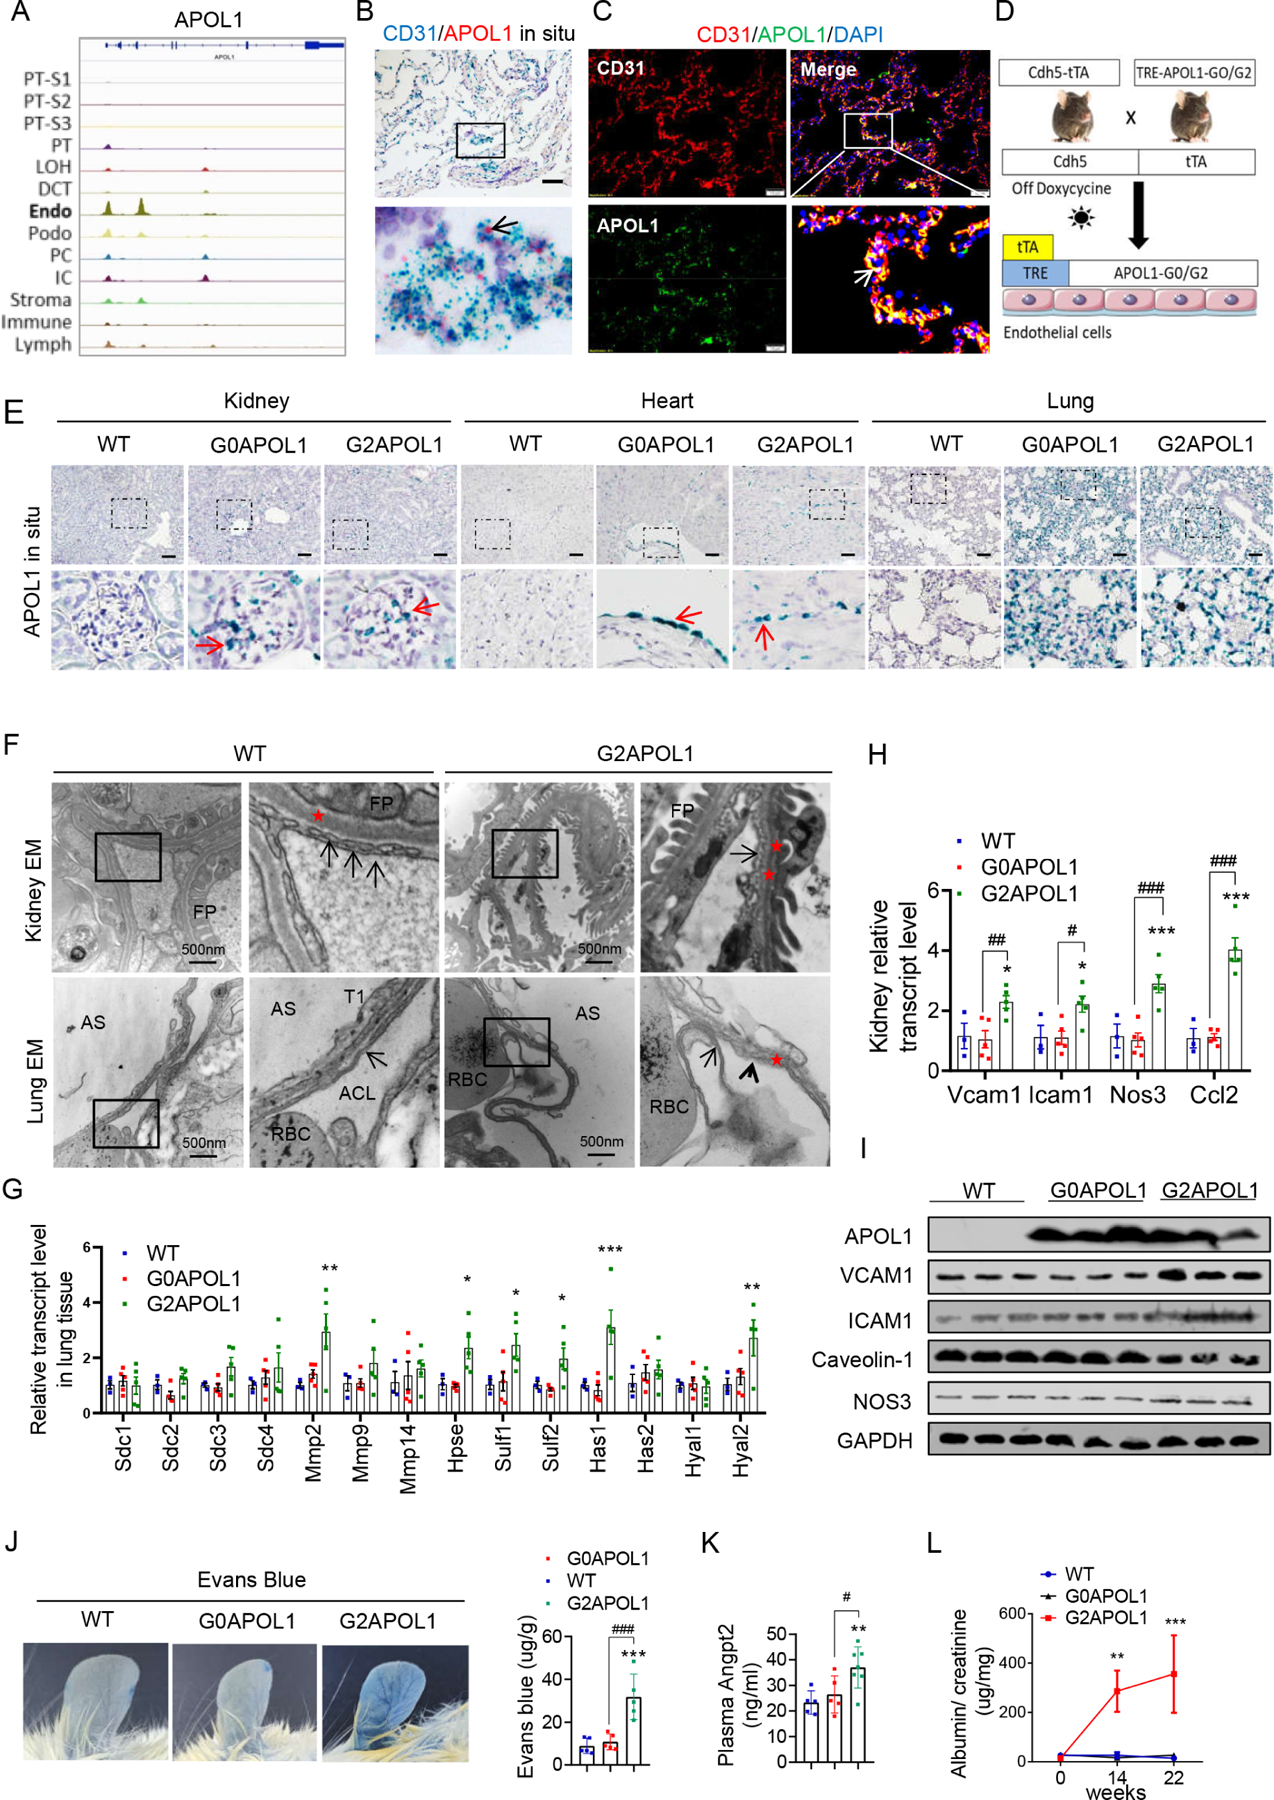
Figure 2. Endothelial-specific expression of RV APOL1 in mice induced vascular leakage and inflammation.

A. Genome browser view of read density in snATAC-seq clusters in human kidney cells at APOL1 locus, endo (endothelial cells).
B. Representative images of CD31 (blue) and APOL1 (red) in situ hybridization in a healthy human lung sample. Black arrows indicate co-localizations of APOL1 with CD31. Scale bar=20μm.
C. Representative images of double immunofluorescence staining of a healthy human lung sample with CD31 (red) and APOL1 (green). White arrows indicate the co-localization of APOL1 with CD31. Scale bar=10μm.
D. Experimental design for the generation of Cdh5-tTA/TREG0APOL1-GFP (EC/G0APOL1) and Cdh5-rtTA/TREG2APOL1-GFP (EC/G2APOL1) mice.
E. Representative images of APOL1 in situ hybridization in kidneys, hearts, and lungs of wild-type (WT), EC/G0APOL1 and EC/G2APOL1 mice. The red arrows indicate the expression of APOL1 mRNA. Scale bar=40μm
F. (Upper panel) Representative kidney transmission electron micrographs (TEM) of WT and EC/G2APOL1 mice reveal endothelial cells with loss of glomerular capillary cell fenestrations (arrows), and asterisks show the basement membrane, FP, podocyte foot process. (Lower panel) Representative Lung TEM from EC/G2APOL1 mice show capillary endothelial cell membrane loss (arrowheads) and delamination compared to WT mice. Arrows show the capillary endothelial cell membrane, and asterisks show the basement membrane. RBCs within the alveolar capillary lumen (ACL) are shown. AS, alveolar space; T1, alveolar type 1 epithelial cell. Scale bars, 500 nm.
G. Relative mRNA levels of glycoproteins; Syndecan 1 (Sdc1), Syndecan 2 (Sdc2), Syndecan 3 (Sdc3), Syndecan 4 (Sdc4), Metalloproteinase-2 (Mmp2), Metalloproteinase-9 (Mmp9), and Metalloproteinase-14 (Mmp14); Heparin sulfate genes Heparanase (Hpse), Sulfatase 1 (Sulf1), Sulfatase 2 (Sulf2); Hyaluronan genes Hyaluronan Synthase 1 (Has1), Hyaluronan Synthase 2 (Has2), Hyaluronidase 1 (Hyal1), and Hyaluronidase 2 (Hyal2) were evaluated in the lung of WT (N = 3), EC/G0APOL1 (N = 5) and EC/G2APOL1 (N = 5) mice. ; *p < 0.05, **p<0.01, ***p<0.001 vs WT.
H. Relative mRNA levels of vascular cell adhesion molecule 1 (Vcam1), intercellular adhesion molecule 1 (Icam1), nitric oxide synthase 3 (Nos3), and monocyte chemoattractant protein-1 (Ccl2) were evaluated in kidneys of WT (N = 3), EC/G0APOL1 (N = 5) and EC/G2APOL1 (N = 5) mice. Gapdh was used for normalization. *p < 0.05, ***p<0.001 vs WT; #p < 0.05, ##p < 0.01, ###p < 0.001 vs. indicated group.
I. Representative western blots from lung lysates of WT, EC/G0APOL1 and EC/G2APOL1 mice showing levels of APOL1, ICAM1, VCAM1, Caveolin-1, eNOS, and GAPDH.
J. Representative ear photographs of Evan’s blue dye leakage after Evan’s blue injection into WT, EC/G0APOL1, and EC/G2APOL1 mice. Right panel, spectrophotometric analysis of the amount of extravasated Evans blue dye (N=5). ***p < 0.001, vs WT; ###p < 0.001 vs. indicated group.
K. Plasma Angiopoietin 2 (Angpt2) level in WT (N=5), EC/G0APOL1 (N=5), and EC/G2APOL1 (N=6) mice. **p<0.01 vs WT; #p < 0.05 vs. indicated group.
L. Urinary albumin/creatinine ratio (ACR) of EC/G0APOL1 and EC/G2APOL1 at baseline, 1, 14 and 22 weeks off doxycycline diet. Single transgenic littermates served as controls (WT) (N = 5, 6, 6 for WT, G0 and G2, respectively). **p<0.01, ***p<0.001, compares WT mice at the same time points.
