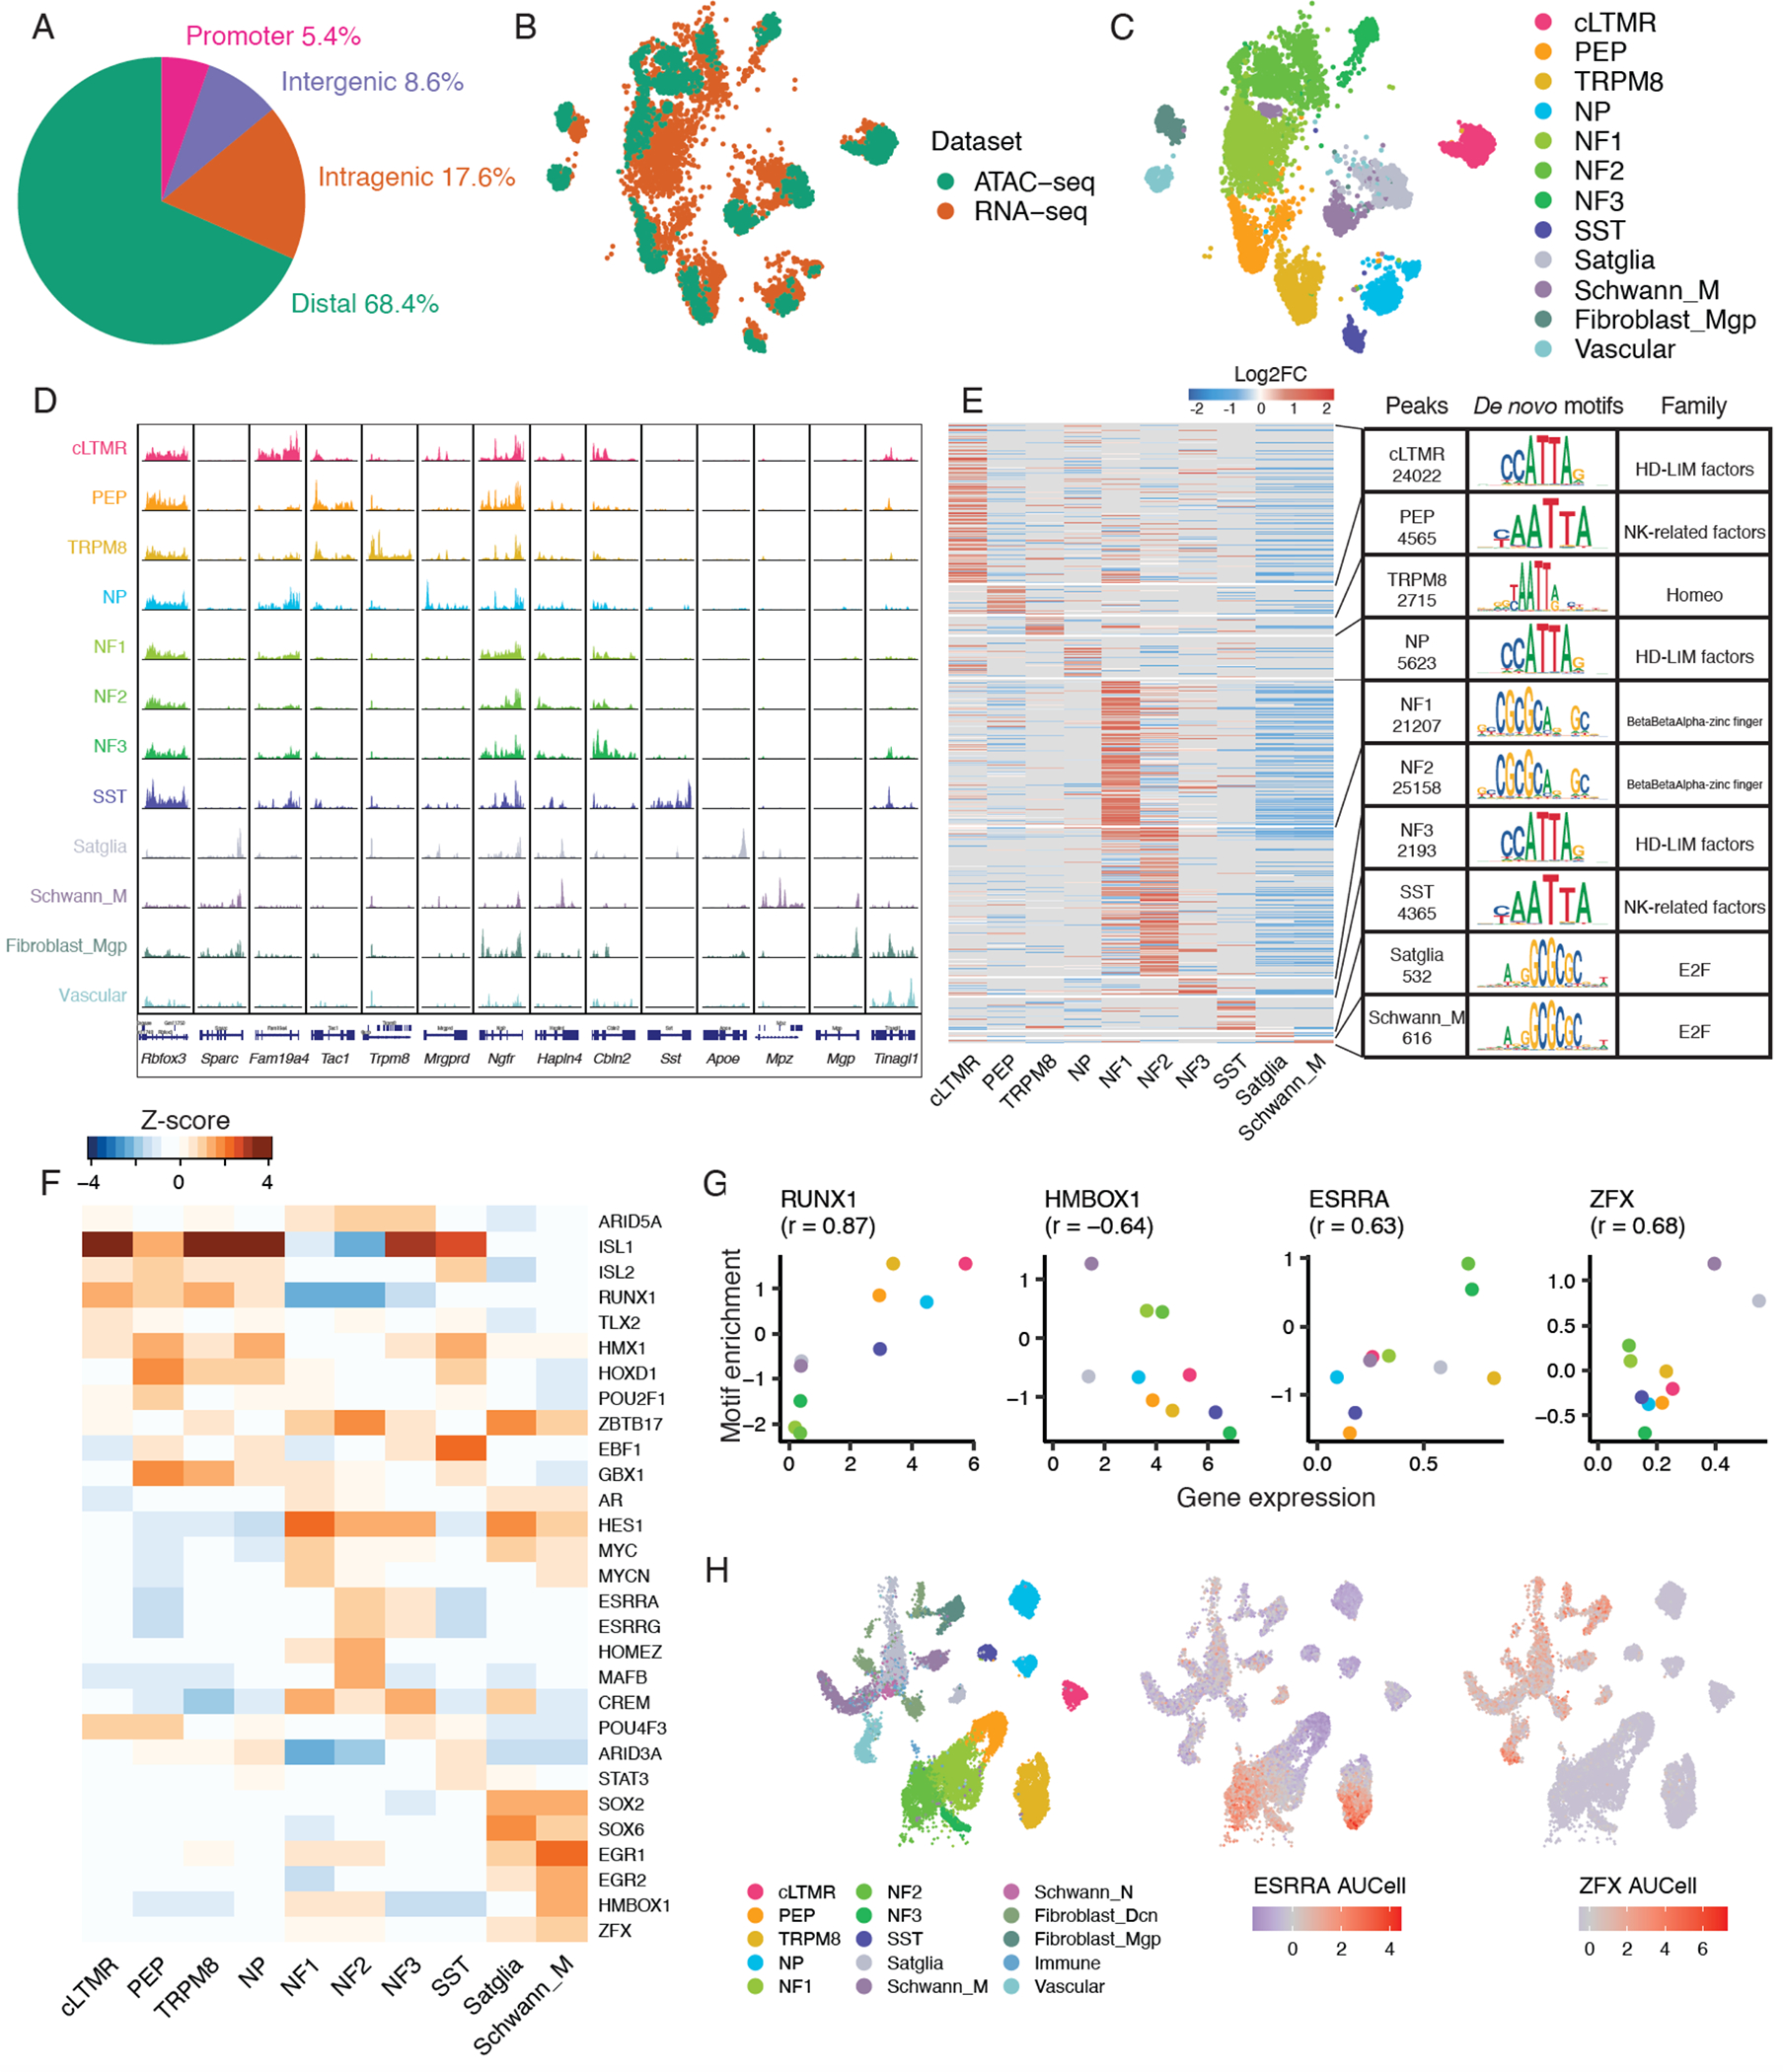
Figure 5. Single-nucleus epigenomic analysis of mouse trigeminal ganglion.

A. Fraction of peaks in snATAC-seq data that map to promoter regions (−1,000bp to +100bp of transcription start site [TSS]), intragenic regions (within gene body excluding promoter region), distal regions (<200 kb upstream or downstream of TSS excluding promoter and intragenic regions), and intergenic regions (>200kb upstream or downstream of TSS) across 3 biological replicates of Vglut2-cre;Sun1-GFP+ TG nuclei.
B-C. UMAP plots of 3,519 mouse TG nuclei profiled by snATAC-seq anchored to 5,584 male naive mouse TG nuclei profiled by snRNA-seq. Nuclei are colored by B) single-nucleus profiling technique or C) cell type classification. Cell types that are present in snRNA-seq data but not in snATAC-seq data are not shown.
D. For each TG cell type (rows), chromatin accessibility is displayed at cell-type-specific genes (columns). snATAC-seq data is displayed as the average frequency of sequenced DNA fragments per cell for each cell type, grouped by 50 bins per displayed genomic region; Y-axis is scaled for each gene (column).
E. Differential chromatin accessibility analysis of 90,996 cell-type-specific peaks in each TG cell type compared to all other TG cell types (Log2FC > 0.5, FDR < 0.05, Table S8). Heatmap displays log2FC for each peak (rows) in the respective TG cell type (columns). Transcription factor (TF) DNA binding motifs that are most significantly enriched within each cell type’s differentially accessible peaks (Log2FC > 0, FDR < 0.05) compared to randomly selected peaks (Table S9) are shown. The most enriched motif and its TF family are displayed for each cell type. Cell types with ≤ 500 differentially accessible peaks are not shown.
F. Heatmap of TFs whose DNA binding motifs are significantly enriched (Log2FC > 0, FDR < 0.05) within each cell type’s differentially accessible peaks compared to randomly selected peaks (see methods). Top 5 TFs by motif enrichment per cell type are included in the heatmap. Heatmap shows the Z-score (column-scaled) of motif fold enrichment.
G. Scatter plots of average normalized expression of cell-type-specific TF mRNA and its TF motif fold enrichment (Z-score as in Figure 5F) in each mouse TG cell type. Pearson’s r between gene expression and motif enrichment in each cell type is displayed.
H. UMAP plots of 59,921 naive mouse TG nuclei profiled by snRNA-seq downsampled to display 28,000 nuclei (as in Figure 1A). Nuclei are colored by cell type (left) or by AUCell regulon scores of ESRRA (middle) and ZFX (right) using SCENIC (see methods).
