



Abstract
Objective:
Depression in adolescence is linked to risk for type 2 diabetes (T2D). In this secondary data analysis of a randomized controlled trial comparing cognitive-behavioral therapy (CBT) to a control program to ameliorate insulin resistance via reducing depression symptoms, we examine which CBT change mechanisms (e.g., behavioral activation, cognitive restructuring) contributed to decreased depression and subsequent improvements in body mass index (BMI), percent body fat, and insulin resistance.
Methods:
Girls 12–17y with overweight/obesity and family history of T2D were randomized to six-week group CBT (n=61) or health education (HealthEd; n=58). At baseline and post-treatment, adolescents completed questionnaires assessing activities, thoughts, and depression symptoms. At baseline, post-treatment, and one- year, BMI was calculated and insulin outcomes were derived from two-hour oral glucose tolerance testing. At baseline and one-year, percent body fat was assessed with dual-energy x-ray absorptiometry. Indirect effects of CBT components were tested on one-year changes in BMI, percent body fat, and insulin indices through decreases in depression symptoms during treatment. Intervention was tested as a moderator.
Results:
In CBT, but not HealthEd, there was an indirect effect of increased physical activity during treatment on decreased one-year BMI via reductions in depression symptoms during treatment. Also, there were conditional indirect effects in CBT of increased pleasantness of physical and social activity during treatment on decreased one-year BMI via decreased depression symptoms during treatment.
Conclusion:
Behavioral activation may be a useful intervention to decrease depression and reduce excess weight gain in the targeted prevention of T2D in at-risk adolescent girls. NCT01425905, clinicaltrials.gov
Keywords: adolescent psychotherapy, depression (emotion), metabolic syndrome, obesity, randomized controlled trials
Depression in adolescents is associated with obesity and risk for cardiometabolic health problems, such as type 2 diabetes (T2D), and these associations are strongest in girls.1,2 Longitudinal studies have demonstrated that depression symptoms in adolescents predict future obesity onset,3 as well as the worsening of insulin resistance, the physiological precursor to T2D, even after accounting for body mass index (BMI; kg/m2) and change in BMI over time.4 Given the significant rise in obesity and T2D among adolescents,5,6 addressing depression may offer a targeted approach to prevent BMI gain and its adverse health complications, including insulin resistance and T2D.
Cognitive-behavioral therapy (CBT) is an evidence-based behavioral intervention that has shown significant effects for decreasing depression in the general population of adolescents, when compared to active control conditions, at post-treatment and follow-up (i.e., 17–39 weeks).7 However, there are limited studies testing CBT for depression in the specific subpopulation of adolescents with overweight and obesity, who are at increased risk for T2D. As one example of these studies, adolescents with overweight (BMI percentile ≥ 85th) and current major depressive disorder (MDD) assigned to either individual CBT or individual CBT plus a healthy lifestyle intervention demonstrated decreased depression symptoms from the clinical to non-clinical range at post-treatment, and depression symptoms remained in the non-clinical range at 6-month follow-up.8 Although preliminary findings suggest that traditional CBT may be efficacious for decreasing depression and excess weight gain in adolescents, a “one-size-fits-all” approach may be suboptimal for addressing the unique mechanisms by which depression contributes to obesity and risk for T2D. In line with a precision medicine approach to addressing pediatric obesity,9 targeted interventions warrant testing.
We conducted a parallel-group randomized controlled trial comparing a brief, group- based CBT program to a group-based health education control program (HealthEd) for the prevention of worsening insulin resistance in adolescent girls with overweight/obesity, a family history of T2D, and mildly elevated depression symptoms (Center for Epidemiological Studies – Depression Scale [CES-D] ≥16).10 Among adolescents with moderately elevated depression symptoms at baseline (CES-D >20), those in CBT had a greater reduction in depression symptoms at post-treatment than adolescents in HealthEd.11 Moreover, in this subgroup, reduction in depression symptoms during treatment was the explanatory mechanism by which CBT, but not HealthEd, led to improvements in BMI, percent body fat, fasting insulin, and insulin sensitivity one-year later.12 These results tentatively suggest that CBT may be a promising intervention to address depression, and subsequently, obesity and worsening insulin resistance, among adolescents at risk for T2D.
One logical next step in this line of research involves elucidating which cognitive- behavioral change mechanisms of CBT drive its efficacy for decreasing depression and improving longer-term health outcomes, which can inform the tailoring of future interventions to enhance effectiveness in this particular pediatric group. Among the common change mechanisms of CBT, participants’ reported behavioral activation and cognitive restructuring have are most consistently correlated with improvements in depression among adolescents.7 Behavioral activation involves increasing engagement in activities that bring about positive reinforcement, especially physical and social activities.7,13 Cognitive restructuring involves challenging negative thoughts to generate more realistic and positive thoughts.7 However, it is unclear how changes in behavioral activation and cognitive restructuring among adolescents at risk for T2D and with depression symptoms may be related to changes in depression symptoms and health outcomes.
The current study utilized mediational models to test the hypothesis that changes in specific cognitive-behavioral mechanisms during treatment would contribute to one-year changes in BMI, percent body fat, and insulin outcomes through decreases in depression symptoms during treatment among adolescents at risk for T2D. Intervention condition (CBT versus HealthEd) was tested as a moderator of mediation to test the hypothesis that such indirect effects would emerge only among adolescents randomized to CBT, versus the control condition.14,15
Method
Participants
Participants were N = 119 adolescent girls selected to be at risk for T2D and to have mildly elevated depression symptoms, but to otherwise be in good general health. Inclusion criteria were: female; age 12–17 years; overweight or obesity (BMI ≥85th percentile); family history of T2D, prediabetes, or gestational diabetes in one or more first-degree or second-degree relative; and evidence of elevated depression symptoms, documented by a total score ≥16 on the CES-D.10 Exclusion criteria were: current psychiatric symptoms that necessitated treatment (e.g., MDD); major medical problem (e.g., T2D, fasting glucose >126 mg/dL or 2-hour glucose >200 mg/dL); medication affecting insulin, weight, or mood (e.g., insulin sensitizers, stimulants, antidepressants); recent significant weight loss; current participation in structured weight loss intervention or psychotherapy; and pregnancy. Procedures took place in an outpatient pediatric clinic at the National Institutes of Health Clinical Research Center in Bethesda, Maryland. The Eunice Kennedy Shriver National Institute of Child Health and Human Development Institutional Review Board approved all procedures. After having the study described in detail, parents/guardians provided informed written consent and adolescents provided informed written assent. Adolescents were compensated for participation.
Procedures
Measures of demographics, anthropometrics (BMI, percent body fat), depression, cognitive-behavioral mechanisms, and insulin sensitivity were collected at baseline. After determining eligibility, a study coordinator randomized adolescents to either a CBT or HealthEd group program (1:1 allocation); randomization was stratified by age and race/ethnicity, and randomization strings were generated by an electronic program with permuted blocks, as previously described.11 Each group program met for one-hour sessions, once per week, for six weeks. Adolescents completed an immediate post-treatment assessment and a one-year follow- up assessment. BMI, depression, cognitive-behavioral mechanisms, and insulin sensitivity were re-assessed at post-treatment. BMI, percent body fat, and insulin sensitivity were re-assessed again at one-year.
Measures
Anthropometrics
Weight was measured with a digital scale in a fasted state without shoes and outer clothing. Height was averaged from three measurements with a calibrated wall-mounted stadiometer. BMI (kg/m2) was calculated and standard scores were estimated from CDC 2000 standards.16 At baseline and one-year, percent body fat (fat mass/total mass) was derived from dual-energy X-ray absorptiometry (iDXA, GE Healthcare, Madison, WI).
Depression Symptoms
The 20-item CES-D10 was administered at baseline and post-treatment assessment. A total score, ranging from 0 to 60, is generated by summing responses across all items; higher scores reflect higher depression symptoms. The CES-D total score has been shown to be reliable and valid in adolescents.17 In the current study, the CES-D showed good internal reliability consistency (Cronbach αs ≥ .80).
Behavioral Activation
The Pleasant Events Schedule (PES) is a 29-item questionnaire assessing frequency and the subjective pleasantness of engaging in pleasant activities.18 The PES was administered at baseline and post-treatment assessment. PES items have shown sound test-retest reliability, internal consistency, and convergent and discriminant validity in adolescents.19 Consistent with previous research,18 the PES was separated into four subscales measuring frequency and pleasantness of physical and social activities. In the current study, the PES showed adequate internal reliability for the physical pleasantness subscale (baseline α = 0.83; post-treatment α = 0.88), physical frequency subscale (baseline α = 0.70; post-treatment α = 0.79), and social pleasantness subscale (baseline α = 0.71; post-treatment α = 0.78). The social frequency subscale internal reliability was adequate at post-treatment (α = 0.71) but suboptimal at baseline (α = 0.64).
Cognitive Restructuring
The Automatic Thoughts Questionnaire (ATQ) is a 60-item questionnaire designed to assess the frequency of positive and negative self-statements associated with depression.20 The ATQ was administered at baseline and post-treatment assessment. The ATQ is appropriate for use in adolescents.21 In the current study, the ATQ showed internal consistency for both positive and negative self-statements (baseline and post-treatment α’s ≥ 0.90).
Oral Glucose Tolerance Testing
At all assessments, an oral glucose tolerance test (OGTT) was administered to ascertain whole body insulin sensitivity index (WBISI) and fasting data were used to calculate the homeostasis model assessment of insulin resistance (HOMA-IR). The OGTT was conducted in the morning following a 10-hour overnight fast. Participants received 1.75g/kg of dextrose (maximum 75g). Blood was sampled for serum insulin and glucose at fasting and 30, 60, 90, and 120 min after dextrose. WBISI and HOMA-IR were calculated according to established formulas validated in adolescents with overweight/obesity.22,23
Interventions
CBT was a manualized depression prevention group program selected because it has demonstrated efficacy for decreasing depression symptoms and reducing incidence of MDD, particularly in adolescents with elevated depression symptoms.24,25 CBT includes psychoeducation and activities on the interconnectedness of feelings, thoughts, and behaviors; self-monitoring; cognitive restructuring; behavioral activation; and problem-solving to cope with daily hassles and major stressful life events.24 The median of expert ratings of CBT facilitator competence was 7.8 (1 = poor to 10 = superior) and fidelity was 7.7 (1 = none to 10 = perfect match).11
HealthEd was a manualized, attention-matched control group adapted from a didactic middle and high school health curriculum.26 HealthEd includes presentations, handouts, and videos on topics including alcohol and drug use, nutrition and body image, domestic violence, sun safety, exercise, and identifying depression and suicide risk.26
Each CBT and HealthEd group session ranged in size from 4–8 adolescents. The groups met during non-school hours and were co-facilitated by a psychologist and psychology graduate student. The median expert rating of HealthEd sessions for overlap with CBT content was 1.0 (1 = none to 10 = perfect match), confirming independence between interventions.11
Data Analysis
Data were analyzed using SPSS for Windows, version 26 (IBM Corporation, Armonk, NY) and significance was determined as p < .05. Single imputation using Expectation Maximization (EM) method in SPSS was used to handle missing data (13% of all data points). Following current guidelines for evaluating intervening variables, indirect effects were tested using Hayes’ (v 3.4) PROCESS SPSS macro.27 Five thousand bootstrap resamples were collected to generate a bias-corrected 95% confidence interval.28
In this secondary data analysis, we tested moderated mediation models to examine whether change in depression symptoms from baseline to post-treatment was an intervening variable in the relationship between change in cognitive-behavioral mechanisms from baseline to post-treatment and change in outcome from post-treatment to one-year, as well as whether intervention condition (CBT versus HealthEd) moderated these relationships. Evidence of significant moderated mediation with a dichotomous moderator that codes intervention condition implies that the indirect effect differs between the two conditions.14,15 Outcome measures included post-treatment to one-year changes in BMI, insulin sensitivity, and insulin resistance, and baseline to one-year change in percent body fat, as body fat was not assessed at post- treatment.
Analyses were adjusted for baseline age, race/ethnicity, baseline depression symptoms, baseline level of the independent variable, as well as the baseline level and post-treatment level of the outcome change score.29 Analysis for percent body fat was adjusted for baseline, as opposed to post-treatment percent body fat, because the latter was not obtained. For the outcomes of insulin sensitivity and insulin resistance, analyses also were adjusted for baseline percent body fat and one-year change in percent body fat to determine if observed effects on one- year insulin were independent of body fat.
We examined the following pathways in each of the models (Figure 1).30 The a1-path represents the correlation between changes in cognitive-behavioral mechanisms from baseline to post-treatment and change in depression symptoms from baseline to post-treatment. The a3-path represents the moderation of the a1-path by intervention condition (CBT vs HealthEd). A significant a3-path suggests that the association between change in cognitive-behavioral mechanisms and change in depression symptoms in the two intervention conditions are significantly different from each other. The b-path is the correlation of baseline to post-treatment change in depression symptoms and change in the dependent variable from post-treatment to one-year (BMI, insulin sensitivity/resistance) or baseline to post-treatment (body fat). The indirect effect, ab-path, is the portion of the total effect of change in cognitive-behavioral mechanisms and the dependent variable that occurs through change in depression. The a3b-path, also referred to as the index of moderated mediation, represents the moderation of the ab-path by intervention condition (CBT vs HealthEd). A significant a3b-path suggests that the indirect effects in the two intervention conditions are significantly different from each other. The direct effect, c’-path, reflects the relation between change in cognitive-behavioral mechanisms and change in the dependent variable that is independent of the change that occurs indirectly through depression. In line with current recommendations for testing and interpreting moderated mediation models, we probed all models and reported conditional effects for each intervention condition (i.e., CBT and HealthEd), even in the absence of significant moderation. A significant conditional effect in one intervention condition means that the effect differs from zero, even if the effects in the two interventions do not significantly differ from one another. Hayes (2015) suggests that reporting significant conditional effects, even in the absence of significant moderation, still provides useful supplementary information about mechanisms.31
Figure 1.
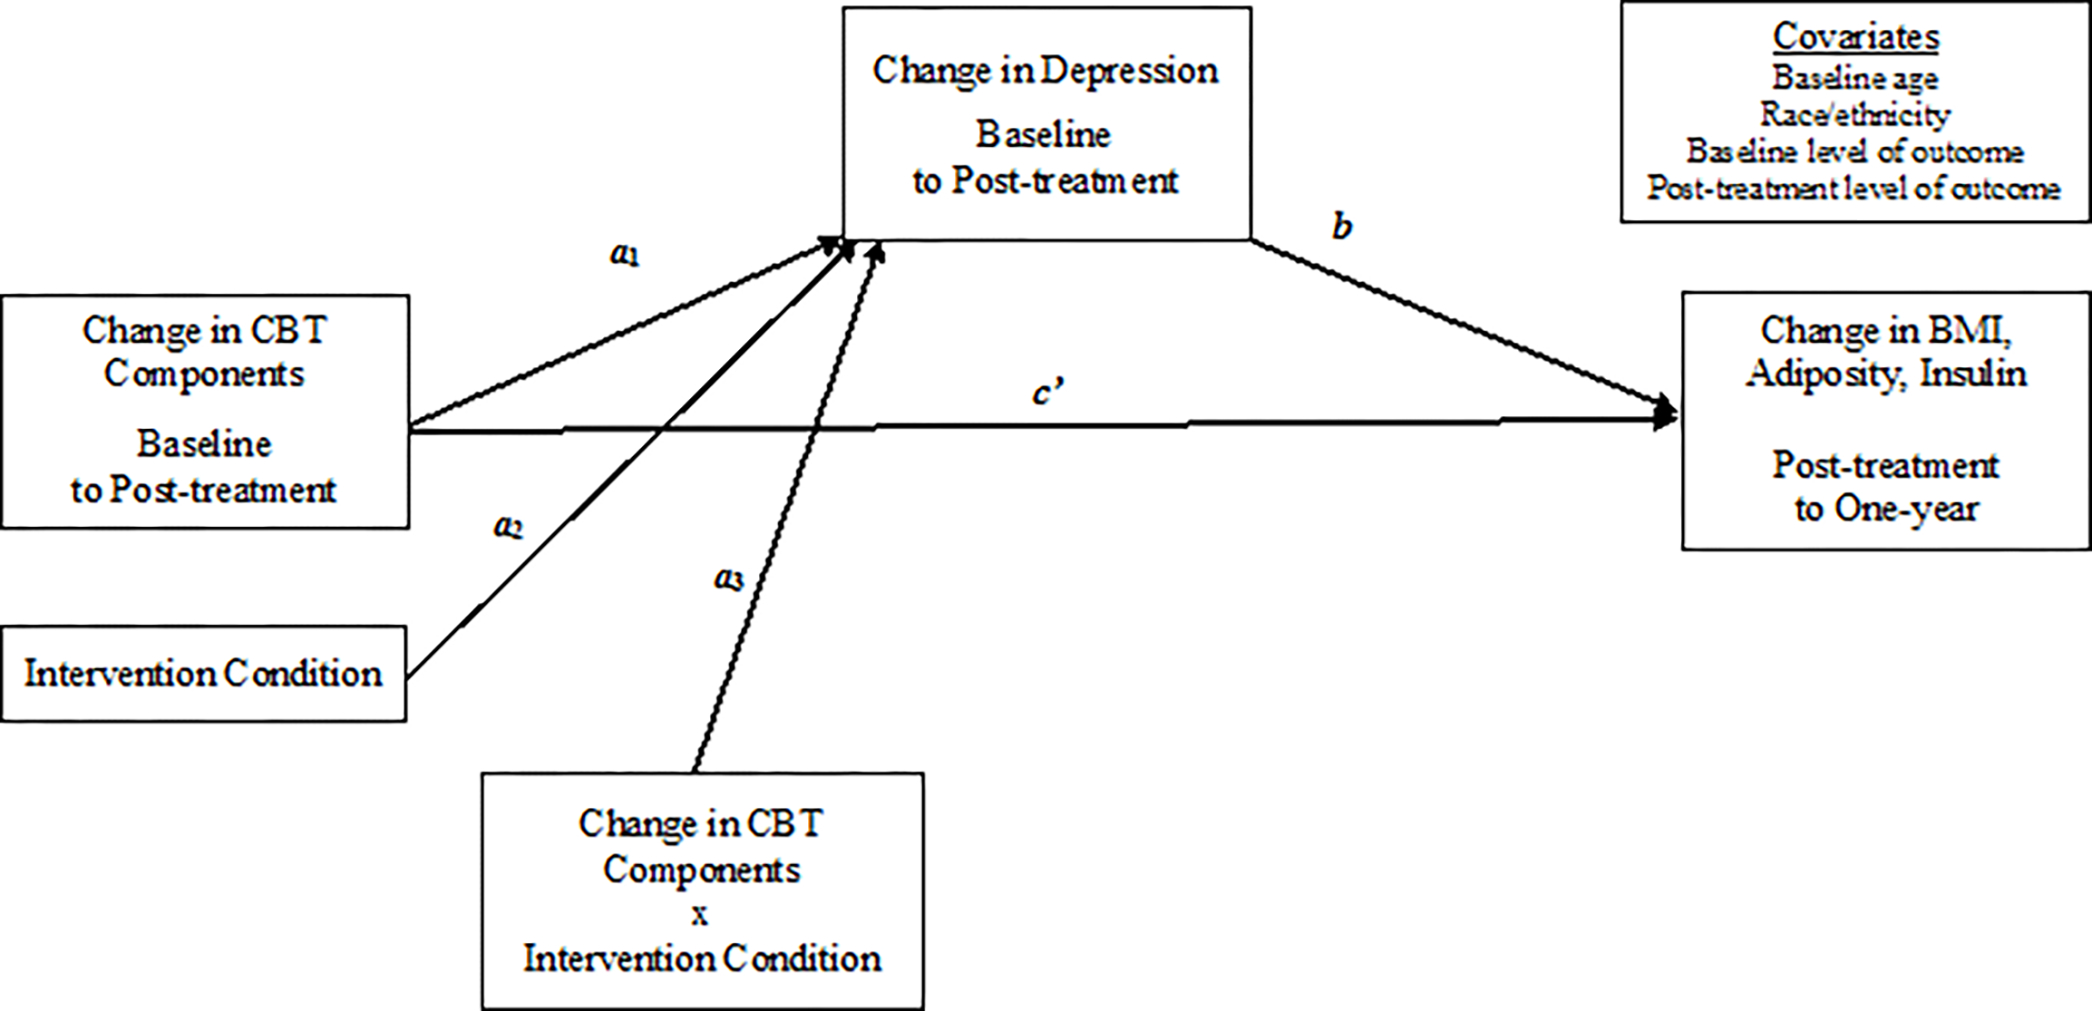
Path diagrams of the moderated mediation model
Results
Baseline descriptive statistics are displayed in Table 1. At baseline, participants randomized to CBT had a lower BMI (kg/m2) compared to participants randomized to HealthEd (t (117) = 2.14, p = 0.03). There were no other significant differences in baseline characteristics by group condition (CBT versus HealthEd; Table 1), including depression symptoms, pleasant activities, positive and negative thoughts, percent body fat, insulin sensitivity, and insulin resistance.
Table 1.
Descriptive baseline information by intervention assignment
| Characteristic | CBT (n = 61) | HE (n = 58) | p value |
|---|---|---|---|
|
| |||
| Age, y+ | 15.0 ± 1.6 | 15.1 ± 1.6 | 0.81 |
| Race, n (%) | 0.69 | ||
| Non-Hispanic Black | 39 (65) | 35 (61) | |
| Non-Hispanic White | 8 (13) | 11 (19) | |
| Hispanic | 7 (11) | 5 (10) | |
| Other | 7 (11) | 6 (10) | |
| Family History of Type 2 Diabetes, n (%) | 0.13 | ||
| First-degree relative | 20 (33) | 27 (47) | |
| Second-degree relative | 41 (67) | 31 (53) | |
| Tanner breast pubertal stage, n (%) | 0.44 | ||
| 1–2 | 2 (4) | 2 (4) | |
| 3 | 7 (11) | 4 (7) | |
| 4 | 7 (11) | 13 (22) | |
| 5 | 45 (74) | 39 (67) | |
| Depression symptoms+ | 25 ± 7 | 24 ± 7 | 0.54 |
| Physical activity frequency+ | 5 ± 3 | 4 ± 2 | 0.17 |
| Physical activity pleasantness+ | 12 ± 7 | 12 ± 6 | 0.78 |
| Social activity frequency+ | 7 ± 3 | 6 ± 3 | 0.22 |
| Social activity pleasantness+ | 12 ± 4 | 12 ± 4 | 0.75 |
| Positive thought frequency+ | 58 ± 20 | 64 ± 21 | 0.13 |
| Negative thought frequency+ | 35 ± 21 | 30 ± 71 | 0.10 |
| BMI, kg/m2+ | 31.7 ± 6.1 | 34.3 ± 6.9 | 0.03 |
| BMI z score+ | 1.9 ± 0.5 | 2.1 ± 0.5 | 0.05 |
| Elevated BMI z > 1.00, n (%) | 61 (100) | 58 (100) | 0.99 |
| % Adiposity+ | 40.8 ± 5.4 | 42.5 ± 6.0 | 0.10 |
| Elevated % adiposity (≥36.7%), n (%) | 47 (77) | 49 (85) | 0.31 |
| WBISI+ | 2.70 ± 1.47 | 2.34 ± 1.40 | 0.17 |
| HOMA-IR+ | 4.93 ± 2.92 | 5.80 ± 3.30 | 0.13 |
| Elevated insulin resistance (≥3.16), n (%) | 43 (71) | 45 (78) | 0.38 |
Mean (standard deviation). CBT is cognitive-behavioral group. HE is health education group. BMI is body mass index. WBISI is whole body insulin sensitivity index, with higher values reflecting better insulin sensitivity and lower values poorer insulin sensitivity. HOMA-IR is homeostasis model assessment of insulin resistance, with higher values representing greater insulin resistance and lower values little to no insulin resistance.
Moderated mediation models and conditional effects are described by cognitive- behavioral mechanism. For behavioral activation, changes in frequency and pleasantness of physical and social activity are described. For cognitive restructuring, changes in frequency of positive and negative thoughts are described.
Change in Frequency and Pleasantness of Physical Activity
A summary of moderated mediation models for frequency and pleasantness of physical activity is provided in Table 2.
Table 2.
Moderated mediation analyses testing change in depression symptoms from baseline to post-treatment as an intervening variable underlying the effect of change in a) frequency or b) pleasantness of physical activity on one-year change in body composition and insulin outcomes, moderated by intervention condition (i.e., HealthEd, CBT).
| a. Frequency of Physical Activity | ||||
|
| ||||
| BMI, kg/m2 | % Adiposity | WBISI | HOMA-IR | |
|
| ||||
| B, SE (95% CI) | B, SE (95% CI) | B, SE (95% CI) | B, SE (95% CI) | |
|
| ||||
| Path a1 | 0.33, 0.42 (−0.51, 1.18) | 0.36, 0.42 (−0.47, 1.20) | 0.48, 0.42 (−0.35, 1.30) | 0.44, 0.43 (−0.41, 1.28) |
| Path a2 | −1.38, 1.12 (−3.60, 0.85) | −1.39, 1.10 (−3.58, 0.79) | −1.29, 1.07 (−3.41, 0.84) | −1.31, 1.08 (−3.46, 0.83) |
| Path a3 (Moderation of a1) | −1.18, 0.56 (−2.30, −0.07) | −1.19, 0.56 (−2.29, −0.08) | −0.98, −0.55 (−2.07, 0.11) | −1.03, 0.56 (−2.14, 0.07) |
| Path b | 0.12, 0.03 (0.06, 0.17) | 0.001, 0.00 (0.0003, 0.002) | 0.01, 0.02 (−0.03, 0.05) | 0.03, 0.04 (−0.05, 0.10) |
| Index of Moderated Mediation (a3b) | −0.14 (−0.29, −0.001) | 0.00 (−0.00, 0.00) | −0.01 (−0.08, 0.03) | −0.03 (−0.14, 0.08) |
| Direct Effect (c’) | 0.03, 0.08 (−0.13, 0.19) | 0.00, 0.00 (0.00, 0.00) | 0.06, 0.06 (−0.07, 0.19) | 0.06, 0.12 (−0.19, 0.30) |
| Conditional a3-path at M ± SD | ||||
| HealthEd | 0.33, 0.43 (−0.51, 1.18) | 0.36, 0.42 (−0.47, 1.20) | 0.48, 0.42 (−0.35, 1.30) | 0.44, 0.43 (−0.41, 1.28) |
| CBT | −0.85, 0.38 (−1.59, −0.19) | −0.83, 0.37 (−1.56, −0.09) | −0.50, 0.38 (−1.25, 0.24) | −0.60, 0.38 (−1.34, 0.15) |
| Conditional a3b-path at M ± SD | ||||
| HealthEd | 0.03, 0.06 (−0.08, 0.16) | 0.00, 0.00 (0.00, 0.00) | 0.00, 0.02 (−0.02, 0.05) | 0.01, 0.03 (−0.05, 0.08) |
| CBT | −0.10, 0.05 (−0.20, −0.01) | 0.00, 0.00 (0.00, 0.00) | 0.00, 0.01 (−0.04, 0.02) | −0.02, 0.03 (−0.09, 0.05) |
|
| ||||
| b. Pleasantness of Physical Activity | ||||
|
| ||||
| BMI, kg/m2 | % Adiposity | WBISI | HOMA-IR | |
|
| ||||
| B, SE (95% CI) | B, SE (95% CI) | B, SE (95% CI) | B, SE (95% CI) | |
|
| ||||
| Path a1 | −0.20, 0.16 (−0.51, 0.12) | −0.21, 0.16 (−0.52, 0.11) | −0.19, 0.15 (−0.49, 0.11) | −0.18, 0.15 (−0.49, 0.12) |
| Path a2 | −1.20, 1.11 (0.28, −3.39) | −1.21, 0.16 (−3.36, 0.94) | −1.22, 1.06 (−3.31, 0.88) | −1.19, 1.07 (−3.32, 0.93) |
| Path a3 (Moderation of a1) | −0.18, 0.21 (0.41, −0.60) | −0.16, 0.21 (−0.58, 0.25) | −0.12, 0.21 (−0.53, 0.29) | −0.12, 0.21 (−0.54, 0.29) |
| Path b | 0.11, 0.03 (0.06, 0.17) | 0.001, 0.00 (0.0002, 0.002) | 0.00, 0.02 (−0.04, 0.05) | 0.04, 0.04 (−0.04, 0.12) |
| Index of Moderated Mediation (a3b) | −0.02 (−0.06, 0.03) | 0.00 (0.00, 0.00) | 0.00 (−0.01, 0.01) | −0.01 (−0.04, 0.02) |
| Direct Effect (c’) | −0.03, 0.03 (−0.08, 0.04) | −0.00, 0.00 (0.00, 0.00) | −0.03, 0.03 (−0.08, 0.02) | 0.05, 0.05 (−0.04, 0.15) |
| Conditional a3-path at M ± SD | ||||
| HealthEd | −0.19, 0.16 (−0.51, 0.12) | −0.21, 0.16 (−0.52, 0.11) | −0.19, 0.15 (−0.49, 0.11) | −0.18, 0.15 (−0.49, 0.12) |
| CBT | −0.38, 0.15 (−0.67, −0.09) | −0.37, 0.14 (−0.66, −0.08) | −0.31, 0.14 (−0.59, −0.02) | −0.30, 0.15 (−0.60, −0.12) |
| Conditional a3b-path at M ± SD | ||||
| HealthEd | −0.02, 0.02 (−0.06, 0.01) | 0.00, 0.00 (0.00, 0.00) | 0.00, 0.01 (−0.01, 0.01) | −0.01, 0.02 (−0.04, 0.01) |
| CBT | −0.04, 0.02 (−0.08, −0.01) | 0.00, 0.00 (0.00, 0.00) | 0.00, 0.01 (−0.02, 0.02) | −0.01, 0.02 (−0.05, 0.02) |
BMI is body mass index. WBISI is whole body insulin sensitivity index, with higher values reflecting better insulin sensitivity and lower values reflecting poorer insulin sensitivity. HOMA-IR is homeostasis model assessment of insulin resistance, with higher values representing greater insulin resistance and lower values representing little to no insulin resistance. Path a1 indicates the directional path from change in frequency or pleasantness of physical activity to change in depression symptoms during treatment; Path a2 represents the directional path of intervention condition (HealthEd vs CBT) to change in depression symptoms during treatment; Path a3 represents the moderation of the a1-path by intervention condition (HealthEd vs CBT); Path b indicates the directional path from change in depression symptoms during treatment to one-year change in the outcome; Path a3b tests whether the ab-path is conditional on the interaction between change in frequency or pleasantness of physical activity during treatment and intervention condition; Path c’ indicates the direct path from change in frequency or pleasantness of physical activity during treatment to one-year change in the outcome, independently of change in depression symptoms during treatment. Significant paths presented in bolded font.
BMI and body fat
Physical activity frequency.
Intervention (CBT versus HealthEd) moderated the effect of change in physical activity frequency on change in depression symptoms (a3-paths: ΔR2 = 0.02, p’s < 0.05). For participants assigned to CBT, but not HealthEd, increased physical activity frequency was associated with a greater decrease in depression symptoms (conditional a3 path at CBT). The index of moderated mediation was significant when examining one-year change in BMI (a3b path: B = −0.14, 95% CI = [−0.29, −0.001]). More specifically, for participants assigned to CBT, but not HealthEd, every one unit increase in physical activity frequency was indirectly associated with a 0.10 unit greater decrease in one-year BMI, through decreased depression (conditional a3b path at CBT: B = −0.10, SE = 0.05, 95% CI = [−0.20, −0.01]). Intervention did not moderate the indirect effect of increased physical activity frequency on change in body fat through change in depression, and there were no conditional indirect effects for body fat.
Physical activity pleasantness.
Intervention did not moderate the effect of change in physical activity pleasantness on change in depression symptoms; however, there was a significant conditional a3-path in CBT, meaning the effect in CBT differed significantly from zero, but did not differ from the effect in HealthEd. In CBT, increased pleasantness of physical activity was associated with a greater decrease in depression (conditional a3 path at CBT). The index of moderated mediation was not significant (a3b-path); yet, there was a significant conditional effect within CBT. In CBT, increased pleasantness of physical activity was indirectly associated with a decrease in one-year BMI through decreases in depression (conditional a3b path at CBT: B = −0.04, SE = 0.02, 95% CI = [−0.08, −0.01]). Intervention did not moderate the indirect effect of increased pleasantness of physical activity on change in body fat through change in depression, and there were no conditional indirect effects for body fat.
Insulin sensitivity and insulin resistance
Physical activity frequency.
Intervention did not moderate the effect of change in frequency of physical activity on changes in insulin sensitivity (WBISI) or insulin resistance (HOMA-IR) through decreases in depression. There were no conditional indirect effects.
Physical activity pleasantness.
Intervention did not moderate the effect of change in physical activity pleasantness on change in depression; however, there was a significant conditional a3-path in CBT. In CBT, increased pleasantness of physical activity was associated with a decrease in depression (conditional a3 path at CBT). Intervention did not moderate the effect of change in pleasantness of physical activity on changes in insulin sensitivity or insulin resistance through decreases in depression. There were no conditional indirect effects.
Change in Frequency and Pleasantness of Social Activity
A summary of moderated mediation models for frequency and pleasantness of social activity is provided in Table 3.
Table 3.
Moderated mediation analyses testing change in depression symptoms from baseline to post-treatment as an intervening variable underlying the effect of change in a) frequency or b) pleasantness of social activity on one-year change in body composition and insulin outcomes, moderated by intervention condition (i.e., HealthEd, CBT)
| a. Frequency of Social Activity | ||||
|
| ||||
| BMI, kg/m2 | % Adiposity | WBISI | HOMA-IR | |
|
| ||||
| B, SE (95% CI) | B, SE (95% CI) | B, SE (95% CI) | B, SE (95% CI) | |
|
| ||||
| Path a1 | 0.24, 0.35 (−0.46, 0.94) | 0.24, 0.35, (−0.45, 0.93) | 0.32, 0.33 (−0.34, 0.97) | 0.35, 0.34 (−0.33, 1.02) |
| Path a2 | −1.07, 1.15 (−3.35, 1.22) | −1.08, 1.13 (−3.31, 1.16) | −0.98, 1.08 (−3.13, 1.17) | −0.99, 1.10 (−3.16, 1.19) |
| Path a3 (Moderation of a1) | −0.26, 0.43 (−1.12, 0.59) | −0.24, 0.43 ((−1.08, 0.61) | −0.16, 0.41 (−0.97, 0.66) | −0.19, 0.42 (−1.02, 0.64) |
| Path b | 0.12, 0.03 (0.07, 0.17) | 0.001, 0.00 (0.0004, 0.002) | 0.00, 0.02 (−0.04, 0.05) | 0.02, 0.04 (−0.06, 0.10) |
| Index of Moderated Mediation (a3b) | −0.03 (−0.15, 0.10) | 0.00 (0.00, 0.00) | 0.00 (−0.03, 0.02) | −0.01 (−0.06, 0.06) |
| Direct Effect (c’) | −0.12 (−0.25, 0.01) | 0.00, 0.00 (0.00, 0.00) | 0.14, 0.05 (0.04, 0.24) | 0.03, 0.10 (−0.16, 0.22) |
| Conditional a3-path at M ± SD | ||||
| HealthEd | 0.24, 0.35 (−0.45, 0.94) | 0.24, 0.35 (−0.45, 0.93) | 0.32, 0.33 (−0.34, 0.99) | 0.35, 0.34 (−0.33, 1.02) |
| CBT | −0.02, 0.29 (−0.60, 0.56) | 0.01, 0.03 (−0.57, 0.58) | 0.17, 0.28 (−0.39, 0.72) | 0.15, 0.29 (−0.42, 0.72) |
| Conditional a3b-path at M ± SD | ||||
| HealthEd | 0.03, 0.05 (−0.07, 0.14) | 0.00, 0.00 (0.00, 0.00) | 0.00, 0.01 (−0.02, 0.03) | 0.01, 0.03 (−0.04, 0.07) |
| CBT | 0.00, 0.04 (−0.07, 0.10) | 0.00, 0.00 (0.00, 0.00) | 0.00, 0.01 (−0.02, 0.02) | 0.00, 0.02 (−0.03, 0.07) |
|
| ||||
| b. Pleasantness of Social Activity | ||||
|
| ||||
| BMI, kg/m2 | % Adiposity | WBISI | HOMA-IR | |
|
| ||||
| B, SE (95% CI) | B, SE (95% CI) | B, SE (95% CI) | B, SE (95% CI) | |
|
| ||||
| Path a1 | −0.19, 0.22 (−0.62, 0.24) | −0.02, 0.21 (−0.62, 0.22) | −0.17, 0.21 (−0.58, 0.24) | −0.18, 0.21 (−0.59, 0.24) |
| Path a2 | −1.31, 1.13 (−3.54, 0.93) | −1.33, 1.11 (−3.53, 0.85) | −1.31, 1.07 (−3.43, 0.82) | −1.28, 1.09 (−3.43, 0.88) |
| Path a3 (Moderation of a1) | −0.23, 0.30 (−0.82, 0.37) | −0.21, 0.29 (−0.80, 0.38) | −0.13, 0.29 (−0.71, 0.44) | −0.12, 0.29 (−0.71, 0.46) |
| Path b | 0.11, 0.03 (0.06, 0.17) | 0.001, 0.00 (0.0003, 0.002) | 0.00, 0.02 (−0.04, 0.05) | 0.04, 0.04 (−0.04, 0.11) |
| Index of Moderated Mediation (a3b) | −0.03 (−0.09, 0.04) | 0.00 (0.00, 0.00) | 0.00 (−0.02, 0.01) | 0.00 (−0.04, 0.03) |
| Direct Effect (c’) | −0.03, 0.05 (−0.12, 0.06) | 0.00, 0.00 (0.00, 0.00) | −0.06, 0.04 (−0.13, 0.01) | 0.12, 0.06 (−0.01, 0.25) |
| Conditional a3-path at M ± SD | ||||
| HealthEd | −0.19, 0.22 (−0.62, 0.24) | −0.20, 0.21 (−0.62, 0.22) | −0.17, 0.21 (−0.58, 0.24) | −0.18, 0.21 (−0.60, 0.24) |
| CBT | −0.42, 0.22 (−0.86, 0.02) | −0.41, 0.22 (−0.85, 0.03) | −0.30, 0.22 (−0.84, 0.13) | −0.30, 0.22 (−0.74, 0.14) |
| Conditional a3b-path at M ± SD | ||||
| HealthEd | −0.02, 0.02 (−0.07, 0.02) | 0.00, 0.00 (0.00, 0.00) | 0.00, 0.01 (−0.01, 0.01) | −0.01, 0.02 (−0.05, 0.01) |
| CBT | −0.05, 0.03 (−0.11, −0.0001) | 0.00, 0.00 (0.00, 0.00) | 0.00, 0.01 (−0.02, 0.02) | −0.01, 0.02 (−0.06, 0.02) |
BMI is body mass index. WBISI is whole body insulin sensitivity index, with higher values reflecting better insulin sensitivity and lower values reflecting poorer insulin sensitivity. HOMA-IR is homeostasis model assessment of insulin resistance, with higher values representing greater insulin resistance and lower values representing little to no insulin resistance. Path a1 indicates the directional path from change in frequency or pleasantness of social activity to change in depression symptoms during treatment; Path a2 represents the directional path of intervention condition (HealthEd vs CBT) to change in depression symptoms during treatment; Path a3 represents the moderation of the a1-path by intervention condition (HealthEd vs CBT); Path b indicates the directional path from change in depression symptoms during treatment to one-year change in the outcome; Path a3b tests whether the ab-path is conditional on the interaction between change in frequency or pleasantness of social activity during treatment and intervention condition; Path c’ indicates the direct path from change in frequency or pleasantness of social activity during treatment to one-year change in the outcome, independently of change in depression symptoms during treatment. Significant paths presented in bolded font.
BMI and body fat
Social activity frequency.
Intervention did not moderate the effect of change in social activity frequency on change in depression. Intervention also did not moderate the effect of change in social activity frequency on changes in BMI or body fat, through decreases in depression. There were no conditional effects.
Social activity pleasantness.
Intervention did not moderate the effect of change in social activity pleasantness on change in depression. The index of moderated mediation was not significant (a3b-path); yet, there was a significant conditional effect in CBT. In CBT, increased pleasantness of social activity was indirectly associated with greater decreases in one-year BMI through decreases in depression (conditional a3b path at CBT: B = −0.05, SE = 0.03, 95% CI = [−0.11, −0.0001]). Intervention did not moderate the indirect effect of increased pleasantness of social activity on change in body fat through change in depression, and there were no conditional indirect effects.
Insulin sensitivity and insulin resistance
Social activity frequency.
Intervention did not moderate the effect of change in frequency of social activity on change in depression. Intervention also did not moderate the indirect effect of change in frequency of social activity on changes in insulin sensitivity and insulin resistance through decreases in depression. There were no conditional effects. However, increased social activity frequency had a direct effect on increased one-year insulin sensitivity (c’-path B = 0.14, SE = 0.05, 95% CI = [0.04, 0.24]), suggesting that regardless of intervention or change in depression symptoms, increased social activity during the intervention period was related to increases in one-year insulin sensitivity.
Social activity pleasantness.
Intervention did not moderate the effect of change in pleasantness of social activity on change in depression. Intervention also did not moderate the indirect effect of change in pleasantness of social activity on changes in insulin sensitivity and insulin resistance through decreases in depression. There were no conditional indirect effects.
Change in Positive Thoughts
A summary of moderated mediation models for frequency of positive thoughts is provided in Table 4.
Table 4.
Moderated mediation analyses testing change in depression symptoms from baseline to post-treatment as an intervening variable underlying the effect of change in frequency of positive thoughts on one-year change in body composition and insulin outcomes, moderated by intervention condition (i.e., HealthEd, CBT)
| BMI, kg/m2 | % Adiposity | WBISI | HOMA-IR | |
|---|---|---|---|---|
|
| ||||
| B, SE (95% CI) | B, SE (95% CI) | B, SE (95% CI) | B, SE (95% CI) | |
|
| ||||
| Path a1 | −0.13, 0.04 (−0.21, −0.04) | −0.13, 0.04 (−0.21, −0.04) | −0.13, 0.04 (−0.21, −0.05) | −0.13, 0.04 (−0.21, −0.05) |
| Path a2 | −1.07, 1.09 (−3.23, 1.08) | −1.13, 1.08 (−3.27, 1.00) | −1.56, 1.04 (−3.22, 0.91) | −1.17, 1.04 (−3.23, −0.90) |
| Path a3 (Moderation of a1) | −0.03, 0.06 (−0.14, 0.09) | −0.03, 0.06 (−0.14, 0.09) | −0.02, 0.06 (−0.13, 0.10) | −0.02, 0.06 (−0.13, 0.09) |
| Path b | 0.13, 0.03 (0.07, 0.19) | 0.002, 0.00 (0.0006, 0.002) | 0.02, 0.03 (−0.03, 0.07) | 0.06, 0.05 (−0.03, 0.14) |
| Index of Moderated Mediation (a3b) | 0.00 (−0.02, 0.01) | 0.00, (0.00, 0.00) | 0.00 (−0.01, 0.00) | 0.00 (−0.01, 0.01) |
| Direct Effect (c’) | 0.01, 0.01 (−0.01, 0.03) | 0.00, 0.00 (0.00, 0.00) | 0.01, 0.01 (−0.01, 0.03) | 0.01, 0.01 (−0.02, 0.04) |
| Conditional a3-path at M ± SD | ||||
| HealthEd | −0.13, 0.04 (−0.21, −0.04) | −0.13, 0.04 (−0.21, −0.04) | −0.13, 0.04 (−0.21, −0.05) | −0.13, 0.04 (−0.21, −0.05) |
| CBT | −0.16, 0.04 (−0.23, −0.08) | −0.15, 0.04 (−0.23, −0.08) | −0.14, 0.04 (−0.22, −0.07) | −0.15, 0.04 (−0.22, −0.07) |
| Conditional a3b-path at M ± SD | ||||
| HealthEd | −0.02, 0.01 (−0.03, −0.01) | −0.0002, 0.0001 (−0.0004, −0.0001) | 0.00, 0.00 (−0.01, 0.00) | −0.01, 0.01 (−0.02, 0.00) |
| CBT | −0.02, 0.01 (−0.04, −0.01) | −0.0002, 0.0001 (−0.0004, −0.0001) | 0.00, 0.00 (−0.01, 0.00) | −0.01, 0.01 (−0.03, 0.01) |
BMI is body mass index. WBISI is whole body insulin sensitivity index, with higher values reflecting better insulin sensitivity and lower values reflecting poorer insulin sensitivity. HOMA-IR is homeostasis model assessment of insulin resistance, with higher values representing greater insulin resistance and lower values representing little to no insulin resistance. Path a1 indicates the directional path from change in frequency of positive thoughts to change in depression symptoms during treatment; Path a2 represents the directional path of intervention condition (HealthEd vs CBT) to change in depression symptoms during treatment; Path a3 represents the moderation of the a1-path by intervention condition (HealthEd vs CBT); Path b indicates the directional path from change in depression symptoms during treatment to one-year change in the outcome; Path a3b tests whether the ab-path is conditional on the interaction between change in frequency of positive thoughts during treatment and intervention condition; Path c’ indicates the direct path from change in frequency of positive thoughts during treatment to one-year change in the outcome, independently of change in depression symptoms during treatment. Significant paths presented in bolded font.
BMI and body fat
Intervention did not moderate the effect of change in positive thoughts on change in depression; however, there were significant conditional a3-paths in both intervention conditions, meaning the effects in each intervention differed significantly from zero, but did not differ significantly from one another.31 In both CBT and HealthEd, increased positive thoughts were associated with a decrease in depression (conditional a3 paths). The index of moderated mediation was not significant (a3b-path); yet, there were significant conditional a3b-paths in both intervention conditions.31 In both CBT and HealthEd, increased positive thoughts were indirectly associated with decreases in one-year BMI (conditional a3b paths: B = −0.02, SE = 0.01, 95% CI = [−0.03, −0.01]) and body fat (conditional a3b paths: B = −0.0002, SE = 0.0001, 95% CI = [−0.0004, −0.00001]) through decreases in depression (conditional a3b paths).
Insulin sensitivity and insulin resistance
Intervention did not moderate the effect of change in positive thoughts on change in depression; however, there were significant conditional a3-paths in both intervention conditions. In both CBT and HealthEd, increased positive thoughts were associated with a decrease in depression (conditional a3 paths). Intervention did not moderate the indirect effects of change in positive thoughts on changes in insulin sensitivity and insulin resistance through decreases in depression. There were no conditional indirect effects.
Change in Negative Thoughts
A summary of moderated mediation models for frequency of negative thoughts is provided in Table 5.
Table 5.
Moderated mediation analyses testing change in depression symptoms from baseline to post-treatment as an intervening variable underlying the effect of change in frequency of negative thoughts on one-year change in body composition and insulin outcomes, moderated by intervention condition (i.e., HealthEd, CBT).
| BMI, kg/m2 | % Adiposity | WBISI | HOMA-IR | |
|---|---|---|---|---|
|
| ||||
| B, SE (95% CI) | B, SE (95% CI) | B, SE (95% CI) | B, SE (95% CI) | |
|
| ||||
| Path a1 | 0.22, 0.05 (0.13, 0.31) | 0.21, 0.05 (0.12, 0.30) | 0.20, 0.05 (0.11, 0.29) | 0.20, 0.05 (0.11, 0.30) |
| Path a2 | −1.15, 1.14 (−3.41, 1.12) | −0.91, 1.13 (−3.16, 1.32) | −0.37, 1.08 (−2.52, 1.78) | −0.45, 1.11(−2.65, 1.74) |
| Path a3 (Moderation of a1) | 0.04, 0.06 (−0.08, 0.15) | 0.05, 0.06 (−0.07, 0.16) | 0.08, 0.06 (−0.03, 0.20) | 0.08, 0.06 (−0.04, 0.19) |
| Path b | 0.13, 0.03 (0.07, 0.19) | 0.002, 0.00 (0.001, 0.002) | −0.02, 0.03 (−0.07, 0.04) | 0.07, 0.05 (−0.03, 0.17) |
| Index of Moderated Mediation (a3b) | 0.01 (−0.01, 0.02) | 0.00 (0.00, 0.00) | 0.00 (−0.01, 0.00) | 0.01 (0.00, 0.03) |
| Direct Effect (c’) | −0.03, 0.01 (−0.06, −0.003) | 0.00, 0.00 (0.00, 0.00) | 0.01, 0.01 (−0.02, 0.03) | −0.02, 0.02 (−0.06, 0.02) |
| Conditional a3-path at M ± SD | ||||
| HealthEd | 0.22, 0.05 (0.13, 0.31) | 0.21, 0.05 (0.12, 0.30) | 0.20, 0.05 (0.11, 0.29) | 0.20, 0.05 (0.11, 0.30) |
| CBT | 0.26, 0.04 (0.17, 0.34) | 0.26, 0.04 (0.17, 0.34) | 0.29, 0.04 (0.20, 0.37) | 0.28, 0.04 (0.20, 0.36) |
| Conditional a3b-path at M ± SD | ||||
| HealthEd | 0.03, 0.01 (0.01, 0.05) | 0.0003, 0.0001 (0.0001, 0.0006) | 0.00, 0.00 (−0.02, 0.01) | 0.02, 0.01 (−0.01, 0.04) |
| CBT | 0.03, 0.01 (0.02, 0.05) | 0.0004, 0.0001 (0.0001, 0.0006) | 0.01, 0.01 (−0.02, 0.01) | 0.02, 0.02 (−0.01, 0.06) |
BMI is body mass index. WBISI is whole body insulin sensitivity index, with higher values reflecting better insulin sensitivity and lower values reflecting poorer insulin sensitivity. HOMA-IR is homeostasis model assessment of insulin resistance, with higher values representing greater insulin resistance and lower values representing little to no insulin resistance. Path a1 indicates the directional path from change in frequency of negative thoughts to change in depression symptoms during treatment; Path a2 represents the directional path of intervention condition (HealthEd vs CBT) to change in depression symptoms during treatment; Path a3 represents the moderation of the a1-path by intervention condition (HealthEd vs CBT); Path b indicates the directional path from change in depression symptoms during treatment to one-year change in the outcome; Path a3b tests whether the ab-path is conditional on the interaction between change in frequency of negative thoughts during treatment and intervention condition; Path c’ indicates the direct path from change in frequency of negative thoughts during treatment to one-year change in the outcome, independently of change in depression symptoms during treatment. Significant paths presented in bolded font.
BMI and body fat
Intervention did not moderate the effect of change in negative thoughts on change in depression; however, there were significant conditional a3-paths in both intervention conditions. In both CBT and HealthEd, decreased negative thoughts were associated with a decrease in depression (conditional a3 paths). The index of moderated mediation was not significant (a3b- path); yet, were significant conditional a3b-paths in both intervention conditions. In both CBT and HealthEd, decreased negative thoughts were indirectly associated with a decrease in one- year BMI (conditional a3b paths: B = 0.03, SE = 0.01, 95% CI = [0.01, 0.05]) and body fat (conditional a3b paths: B = 0.0003, SE = 0.0001, 95% CI = [0.0001, 0.0006]) through decreases in depression (conditional a3b paths).
Insulin sensitivity and insulin resistance
Intervention did not moderate the effect of change in negative thoughts on change in depression; however, there were significant conditional a3-paths in both intervention conditions. In both CBT and HealthEd, decreased negative thoughts were associated with a decrease in depression (conditional a3 paths). Intervention did not moderate the indirect effects of change in negative thoughts on changes in insulin sensitivity and insulin resistance through decreases in depression. There were no conditional indirect effects.
Discussion
Brief, group-based CBT may contribute to decreases in depression symptoms and subsequent improvements in BMI, body fat, and insulin sensitivity outcomes for adolescent girls with overweight/obesity and elevated depression symptoms.12 However, it is unknown which specific cognitive-behavioral change mechanisms are the drivers of decreases in depression in this population at risk for both mental and physical health concerns. The current study sought to address this gap in understanding by conducting a series of moderated mediational analyses using secondary data from a randomized controlled trial comparing brief, group-based CBT to anattention-matched control for the prevention of depression and insulin resistance in adolescent girls at risk for T2D.11,32
In CBT, but not HealthEd, increased physical activity frequency from baseline to post- treatment was related to decreased depression symptoms from baseline to post-treatment, and in turn, decreased depression was related to decreased BMI one-year later. Similarly, although moderated mediation did not reach the threshold for statistical significance for other cognitive- behavioral change mechanisms, we did find evidence of significant conditional indirect effects in CBT. Specifically, in CBT, increased pleasantness of physical and social activity from baseline to post-treatment both were related indirectly to decreased BMI one-year later via decreased depression from baseline to post-treatment. In addition, increased frequency of social activity during treatment was directly related to increased insulin sensitivity one-year later, independent of condition or changes in depression. Finally, increased positive thoughts and decreased negative thoughts during treatment were related to decreased BMI and body fat one-year later through decreased depression in both conditions.
Our findings regarding the unique effects of physical activity on depression and subsequent BMI in CBT fit with literature testing the effect of physical activity interventions on depression in adolescents.33 Previous randomized controlled trials testing treatment effects of physical activity in adolescents have been both time-intensive (e.g., 30–60 minutes per day, 2–3 days per week) and resource-intensive (e.g., supervised by a qualified instructor).33 Brief, group- based CBT, in contrast, may offer a more cost-effective and feasible alternative. In the CBT curriculum used in the current study, increasing physical activity is only a portion of the overall 6-hour psychosocial intervention.24 Moreover, CBT’s approach to increasing physical activity is incorporated within a behavioral activation strategy to improve mood called, “Having More Fun.” It is possible that the unique framing of physical activity as a way to increase fun may contribute to its effectiveness for decreasing depression and BMI over time. Taken together, increased physical activity in response to very brief modules within an overall psychosocial intervention may contribute to decreases in depression, and ultimately, decreases in BMI, potentially with less time and resources as compared to physical activity interventions.
Our findings regarding the effect of increased pleasantness of physical activity and social activity in CBT on decreasing depression and subsequent BMI are consistent with behavioral activation approaches to decreasing depression. A meta-analysis of randomized controlled trials of behavioral activation in the general population of adults suggests large effect sizes comparable to standard-of-care cognitive therapy.34 A more recent meta-analysis in children and adolescents also suggests effectiveness of behavioral activation.35 Behavioral activation purports that improving mood is not only contingent on increasing the frequency of pleasant and mastery activities, but, more importantly, is contingent on the positive reinforcement and reward that is experienced in the context of those activities.13,36 In line with this two-part theoretical model of behavioral activation, a study examining a behavioral activation intervention with young adults with elevated depression showed that increased activities did not have a direct effect on decreased depression symptoms.37 Rather, increased activities were associated with depression symptoms, indirectly, through increased positive reinforcement.37 The current study builds upon these previous findings by also demonstrating that increased pleasantness in the context of physical and social activities in CBT can contribute to decreases in depression, and ultimately, decreased BMI, for adolescent girls at risk for T2D.
Changes in social activity frequency were not related to changes in depression and subsequent one-year BMI, body fat, or insulin outcomes, despite previous findings demonstrating that social support is related to lower levels of depression symptoms in adolescents.38 The suboptimal internal reliability of this subscale is a limitation and might have affected these results. We did find a direct effect of increased social activity frequency on increased insulin sensitivity at one-year, which was independent of change in depression symptoms, baseline and change in body fat, and condition. Social isolation and loneliness are risk factors for T2D.39,40 Studies in animal models suggest that social isolation is related to worse metabolic outcomes, such as increased fasting glucose.41 Given the value of approaches to ameliorate metabolic outcomes that are non-dependent on weight loss, future studies should determine the distinctive behavioral and/or physiological mechanisms by which increasing social activity in adolescents at risk for T2D improves insulin sensitivity.
In both conditions, increases in positive thoughts and decreases in negative thoughts were related to decreases in depression, and, in turn, subsequent decreases in one-year BMI and body fat. According to cognitive theories of depression, changing one’s thoughts to be more positive and less negative would be anticipated to lead to decreased depression symptoms in CBT, as compared to a non-specific attention condition like HealthEd.24,42 Although there was no overlap in CBT content with HealthEd, there were likely nonspecific factors of both group-based interventions that brought about increases in positive thoughts and decreases in negative thoughts, such as increased social interaction and attention from same-aged peers or group leaders.43 It has been recommended that future studies investigating mechanisms use measures assessing cognitive skill utilization, as opposed to prevalence of negative or positive thoughts.44
One limitation of the current study is the inability to tease apart the dynamic, and likely bidirectional, associations between changes in cognitive-behavioral mechanisms and changes in depression symptoms over the course of treatment, because the current study utilized measures of pleasant events, positive/negative thoughts, and depression at baseline and post-treatment only.44 It may be the case that initial changes in cognitive-behavioral mechanisms led to decreases in depression early on in treatment. Alternatively, initial decreases in depression could have facilitated changes in these mechanisms. Yet another possibility is that these factors interacted reciprocally. Future studies using more fine grained assessment approaches, such as ecological momentary assessments,45 would be better able test the sequence of effects over time. Furthermore, the trial was also not designed to tease apart the therapeutic components of CBT, as is done in dismantling approaches. Such studies isolate therapeutic components of interventions into discrete modules, which are sequenced, and then examine changes in outcomes, such as depression symptoms, before and after each module.46 Finally, although groups were balanced in most baseline characteristics, including depression symptoms, pleasant activities, positive and negative thoughts, percent body fat, insulin sensitivity, and insulin resistance, participants randomized to CBT had lower BMI compared to participants randomized to HealthEd.
Another potential limitation is that the current study is a secondary data analysis. It was expected that we might be adequately powered to test some, but not all moderated mediation models, as the study was not originally powered to test moderated mediation. A sample that was inadequately powered to test for moderated mediation may have increased the likelihood of Type II error, namely preventing the detection of statistically significant indirect effects. Moreover, an inadequately powered sample may explain why we found multiple significant conditional indirect effects without significant moderated mediation. In addition, multiple statistical tests may increase the likelihood of Type I error. Taken together, these secondary analyses require replication in a larger sample that is designed with adequate power to detect effects of mediation models. For example, an estimated statistical power is at least 80% for detecting the hypothesized indirect effects of the current study. This estimated total sample size is based on Monte Carlo power analysis simulation, the recommended practice for determining power and sample size in mediation models.47
Nevertheless, given the paucity of data investigating the relative efficacy of cognitive-behavioral mechanisms in adolescents with elevated depression symptoms, the significant conditional indirect effects in the current study offer valuable preliminary information regarding theorized mechanisms of behavioral intervention effectiveness in this pediatric population.
Findings and conclusions may not generalize to adolescent boys at risk for developing T2D. Overall, CBT has been found to be efficacious for adolescent boys in decreasing depression24 and BMI,8 but future randomized controlled trials that are explicitly designed to test the relative effectiveness of behavioral intervention components should recruit a large sample with sufficient statistical power to examine potential gender differences in effectiveness.
The current study examined mechanisms by which CBT contributed to decreased depression; future directions of this line of research include investigating mechanisms by which decreased depression led to subsequent changes in BMI and body fat one-year later. Decreased depression may contribute to changes in energy balance through healthy eating or additional increased or maintenance of physical activity.48,49 Decreasing depression during treatment also may lead to subsequent changes in BMI and body fat through alternate mechanisms, such as sleep or stress physiology.48 These are also likely mechanisms that may elucidate the effect of CBT on subsequent changes in insulin sensitivity and insulin resistance.49
In conclusion, the current study advances understanding of how components of a brief, evidence-based CBT intervention contribute to changes in depression symptoms, and ultimately, reduce BMI gain and risk for T2D in adolescents. Understanding how components of CBT might contribute to decreased depression in this specific at-risk population has the potential to maximize intervention effectiveness and reduce adverse psychosocial and physical health outcomes in adolescence and adulthood.
Highlights.
Increased physical activity related to decreased depression in overweight girls
Increased pleasantness of activities correlated with decreased depression
Decreased depression correlated with decreased body mass index, one year later
Pleasant activities may help decrease depression and prevent excess weight gain
Acknowledgements:
This work was supported by the Eunice Kennedy Shriver National Institute of Child Health and Human Development (NICHD) (Grant # K99HD069516 and R00HD069516); the National Institute of Health (NIH) Intramural Research Program Grant from NICHD (Grant # 1ZIAHD000641) to JAY, with supplemental funding from the NIH Bench to Bedside Program to LBS, MT-K, and JAY; Office of Behavioral & Social Sciences Research to JAY; and NIH Office of Disease Prevention to JAY.
Footnotes
Competing Interest Statement: All authors have completed the Unified Competing Interest form at http://www.icmje.org/coi_disclosure.pdf. J. A. Yanovski is a Commissioned Officer in the United States Public Health Service (PHS). J.A. Yanovski reports his institution (NIH) has received grants to support clinical trials for which he is Principal Investigator unrelated to this research from Rhythm Pharmaceuticals, Zafgen Inc., and Soleno Therapeutics. No other authors have any financial or personal relationships to declare.
Disclaimer: The opinions and assertions expressed herein are those of the authors and are not to be construed as reflecting the views of the PHS, USUHS, or the United States Department of Defense.
Research data for this article: Data are available upon request.
Clinical trial reg. no: NCT01425905, clinicaltrials.gov
References
- 1.Marmorstein NR, Iacono WG, Legrand L. Obesity and depression in adolescence and beyond: reciprocal risks. Int J Obes (Lond). 2014;38(7):906–911. [DOI] [PMC free article] [PubMed] [Google Scholar]
- 2.Hannon TS, Rofey DL, Lee S, Arslanian SA. Depressive symptoms and metabolic markers of risk for type 2 diabetes in obese adolescents. Pediatric Diabetes. 2013;14(7):497–503. [DOI] [PMC free article] [PubMed] [Google Scholar]
- 3.Mannan M, Mamun A, Doi S, Clavarino A. Prospective associations between depression and obesity for adolescent males and females: a systematic review and meta-analysis of longitudinal studies. PLoS One. 2016;11(6):e0157240. [DOI] [PMC free article] [PubMed] [Google Scholar]
- 4.Shomaker LB, Tanofsky-Kraff M, Stern EA, et al. Longitudinal study of depressive symptoms and progression of insulin resistance in youth at risk for adult obesity. Diabetes Care. 2011;34(11):2458–2463. [DOI] [PMC free article] [PubMed] [Google Scholar]
- 5.Mayer-Davis EJ, Lawrence JM, Dabelea D, et al. Incidence Trends of Type 1 and Type 2 Diabetes among Youths, 2002–2012. N Engl J Med. 2017;376(15):1419–1429. [DOI] [PMC free article] [PubMed] [Google Scholar]
- 6.Hales CM, Fryar CD, Carroll MD, Freedman DS, Ogden CL. Trends in obesity and severe obesity prevalence in US youth and adults by sex and age, 2007–2008 to 2015– 2016. JAMA. 2018;319(16):1723–1725. [DOI] [PMC free article] [PubMed] [Google Scholar]
- 7.Oud M, de Winter L, Vermeulen-Smit E, et al. Effectiveness of CBT for children and adolescents with depression: A systematic review and meta-regression analysis. Eur Psychiatry. 2019;57:33–45. [DOI] [PubMed] [Google Scholar]
- 8.Jelalian E, Jandasek B, Wolff JC, Seaboyer LM, Jones RN, Spirito A. Cognitive- Behavioral Therapy Plus Healthy Lifestyle Enhancement for Depressed, Overweight/Obese Adolescents: Results of a Pilot Trial. J Clin Child Adolesc Psychol. 2019;48(sup1):S24–S33. [DOI] [PMC free article] [PubMed] [Google Scholar]
- 9.Kelly AS, Marcus MD, Yanovski JA, Yanovski SZ, Osganian SK. Working toward precision medicine approaches to treat severe obesity in adolescents: report of an NIH workshop. Int J Obes (Lond). 2018;42(11):1834–1844. [DOI] [PMC free article] [PubMed] [Google Scholar]
- 10.Radloff L The CES-D scale: a self report depression scale for research in the general population. Appl Psychol Meas. 1977;1(3):385–401. [Google Scholar]
- 11.Shomaker LB, Kelly NR, Pickworth CK, et al. A randomized controlled trial to prevent depression and ameliorate insulin resistance in adolescent girls at risk for type 2 diabetes. Annals of Behavior Medicine. 2016;50(5):762–774. [DOI] [PMC free article] [PubMed] [Google Scholar]
- 12.Gulley LD, Shomaker LB, Kelly NR, et al. Indirect Effects of a Cognitive-Behavioral Intervention on Adolescent Weight and Insulin Resistance Through Decreasing Depression in a Randomized Controlled Trial. J Pediatr Psychol. 2019. [DOI] [PMC free article] [PubMed] [Google Scholar]
- 13.McCauley E, Gudmundsen G, Schloredt K, et al. The Adolescent Behavioral Activation Program: Adapting Behavioral Activation as a Treatment for Depression in Adolescence. J Clin Child Adolesc Psychol. 2016;45(3):291–304. [DOI] [PMC free article] [PubMed] [Google Scholar]
- 14.Hayes AF, Rockwood NJ. Regression-based statistical mediation and moderation analysis in clinical research: Observations, recommendations, and implementation. Behav Res Ther. 2017;98:39–57. [DOI] [PubMed] [Google Scholar]
- 15.Hayes AF, Rockwood NJ. Conditional Process Analysis: Concepts, Computation, and Advances in the Modeling of the Contingencies of Mechanisms. Am Behav Sci. 2020;64(1):19–54. [Google Scholar]
- 16.Ogden CL, Kuczmarski RJ, Flegal KM, et al. Centers for Disease Control and Prevention 2000 growth charts for the United States: Improvements to the 1977 National Center for Health Statistics version. Pediatrics. 2002;109(1):45–60. [DOI] [PubMed] [Google Scholar]
- 17.Phillips GA, Shadish WR, Murray DM, Kubik M, Lytle LA, Birnbaum AS. The Center for Epidemiologic Studies Depression Scale with a young adolescent population: a confirmatory factor analysis. Multivariate Behav Res. 2006;41(2):147–163. [DOI] [PubMed] [Google Scholar]
- 18.MacPhillamy DJ, Lewinsohn PM. The Pleasant Events Schedule: Studies on reliability, validity, and scale intercorrelation. J Consult Clin Psychol. 1982;50:363–380. [Google Scholar]
- 19.Stice E, Rohde P, Seeley JR, Gau JM. Testing mediators of intervention effects in randomized controlled trials: An evaluation of three depression prevention programs. J Consult Clin Psychol. 2010;78(2):273–280. [DOI] [PMC free article] [PubMed] [Google Scholar]
- 20.Hollon SD, Kendall PC. Cognitive self-statements in depression: development of an automatic thoughts questionnaire. Cogn Ther Res. 1980;4(4):383–395. [Google Scholar]
- 21.Kauth MR, Zettle RD. Validation of depression measures in adolescent populations. J Clin Psychol. 1990;46(3):291–295. [DOI] [PubMed] [Google Scholar]
- 22.Yeckel CW, Weiss R, Dziura J, et al. Validation of insulin sensitivity indices from oral glucose tolerance test parameters in obese children and adolescents. J Clin Endocrinol Metab. 2004;89(3):1096–1101. [DOI] [PubMed] [Google Scholar]
- 23.Matthews DR, Hosker JP, Rudenski AS, Naylor BA, Treacher DF, Turner RC. Homeostasis model assessment: insulin resistance and beta-cell function from fasting plasma glucose and insulin concentrations in man. Diabetologia. 1985;28(7):412–419. [DOI] [PubMed] [Google Scholar]
- 24.Stice E, Rohde P, Seeley JR, Gau JM. Brief cognitive-behavioral depression prevention program for high-risk adolescents outperforms two alternative interventions: A randomized efficacy trial. Journal of Consulting and Clinical Psychology. 2008;76(4):595–606. [DOI] [PMC free article] [PubMed] [Google Scholar]
- 25.Stice E, Rohde P, Gau JM, Wade E. Efficacy trial of a brief cognitive-behavioral depression prevention program for high-risk adolescents: Effects at 1-and 2-year follow- up. Journal of Consulting and Clinical Psychology. 2010;78(6):856–867. [DOI] [PMC free article] [PubMed] [Google Scholar]
- 26.Bravender T Health, education, and youth in Durham: HEY-Durham curricular guide. 2nd ed. Durham, NC: Duke University; 2005. [Google Scholar]
- 27.Hayes AF. Introduction to mediation, moderation, and conditional process analysis : a regression-based approach. Second edition. ed. New York: Guilford Press; 2018. [Google Scholar]
- 28.Preacher KJ, Hayes AF. SPSS and SAS procedures for estimating indirect effects in simple mediation models. Behavior Research Methods Instruments & Computers. 2004;36(4):717–731. [DOI] [PubMed] [Google Scholar]
- 29.Selig JP, Preacher KJ. Mediation Models for Longitudinal Data in Developmental Research. Res Hum Dev. 2009;6(2–3):144–164. [Google Scholar]
- 30.Hayes AF. Beyond Baron and Kenny: Statistical mediation analysis in the new millennium. Communication Monographs. 2009;76(4):408–420. [Google Scholar]
- 31.Hayes AF. An Index and Test of Linear Moderated Mediation. Multivariate Behav Res. 2015;50(1):1–22. [DOI] [PubMed] [Google Scholar]
- 32.Shomaker LB, Kelly NR, Radin RM, et al. Prevention of insulin resistance in adolescents at risk for type 2 diabetes with depressive symptoms: 1-year follow-up of a randomized trial. Depression and Anxiety. 2017;34(10):866–876. [DOI] [PMC free article] [PubMed] [Google Scholar]
- 33.Bailey AP, Hetrick SE, Rosenbaum S, Purcell R, Parker AG. Treating depression with physical activity in adolescents and young adults: a systematic review and meta-analysis of randomised controlled trials. Psychol Med. 2018;48(7):1068–1083. [DOI] [PubMed] [Google Scholar]
- 34.Cuijpers P, van Straten A, Warmerdam L. Behavioral activation treatments of depression: a meta-analysis. Clin Psychol Rev. 2007;27(3):318–326. [DOI] [PubMed] [Google Scholar]
- 35.Tindall L, Mikocka-Walus A, McMillan D, Wright B, Hewitt C, Gascoyne S. Is behavioural activation effective in the treatment of depression in young people? A systematic review and meta-analysis. Psychol Psychother. 2017;90(4):770–796. [DOI] [PMC free article] [PubMed] [Google Scholar]
- 36.Lewinsohn PM, Sullivan JM, Grosscup SJ. Changing Reinforcing Events - an Approach to the Treatment of Depression. Psychother-Theor Res. 1980;17(3):322–334. [Google Scholar]
- 37.Takagaki K, Okamoto Y, Jinnin R, et al. Mechanisms of behavioral activation for late adolescents: Positive reinforcement mediate the relationship between activation and depressive symptoms from pre-treatment to post-treatment. J Affect Disord. 2016;204:70–73. [DOI] [PubMed] [Google Scholar]
- 38.Gariepy G, Honkaniemi H, Quesnel-Vallee A. Social support and protection from depression: systematic review of current findings in Western countries. Br J Psychiatry. 2016;209(4):284–293. [DOI] [PubMed] [Google Scholar]
- 39.Whisman MA. Loneliness and the metabolic syndrome in a population-based sample of middle-aged and older adults. Health Psychol. 2010;29(5):550–554. [DOI] [PubMed] [Google Scholar]
- 40.Brinkhues S, Dukers-Muijrers N, Hoebe C, et al. Socially isolated individuals are more prone to have newly diagnosed and prevalent type 2 diabetes mellitus - the Maastricht study. BMC Public Health. 2017;17(1):955. [DOI] [PMC free article] [PubMed] [Google Scholar]
- 41.Ko CY, Liu YP. Isolation rearing impaired sensorimotor gating but increased pro- inflammatory cytokines and disrupted metabolic parameters in both sexes of rats. Psychoneuroendocrinology. 2015;55:173–183. [DOI] [PubMed] [Google Scholar]
- 42.Rush AJ, Beck AT. Cognitive therapy of depression and suicide. Am J Psychother. 1978;32(2):201–219. [DOI] [PubMed] [Google Scholar]
- 43.Stice E, Burton E, Bearman SK, Rohde P. Randomized trial of a brief depression prevention program: an elusive search for a psychosocial placebo control condition. Behav Res Ther. 2007;45(5):863–876. [DOI] [PMC free article] [PubMed] [Google Scholar]
- 44.Webb CA, Auerbach RP, DeRubeis RJ. Processes of Change in CBT of Adolescent Depression: Review and Recommendations. J Clin Child Adolesc. 2012;41(5):654–665. [DOI] [PubMed] [Google Scholar]
- 45.Armey MF, Schatten HT, Haradhvala N, Miller IW. Ecological momentary assessment (EMA) of depression-related phenomena. Curr Opin Psychol. 2015;4:21–25. [DOI] [PMC free article] [PubMed] [Google Scholar]
- 46.van den Heuvel MWH, Bodden DHM, Moerbeek M, Smit F, Engels R. Dismantling the relative effectiveness of core components of cognitive behavioural therapy in preventing depression in adolescents: protocol of a cluster randomized microtrial. BMC Psychiatry. 2019;19(1):200. [DOI] [PMC free article] [PubMed] [Google Scholar]
- 47.Schoemann AM, Boulton AJ, Short SD. Determining Power and Sample Size for Simple and Complex Mediation Models. Soc Psychol Pers Sci. 2017;8(4):379–386. [Google Scholar]
- 48.Markowitz S, Friedman MA, Arent SM. Understanding the relation between obesity and depression: Causal mechanisms and implications for treatment. Clinical Psychology: Science and Practice. 2008;15(1):1–20. [Google Scholar]
- 49.Moulton CD, Pickup JC, Ismail K. The link between depression and diabetes: the search for shared mechanisms. The Lancet Diabetes & Endocrinology. 2015;3(6):461–471. [DOI] [PubMed] [Google Scholar]