Abstract
Background:
We sought to describe trends in cardiovascular implantable electronic device (CIED) implantation over the past three decades in Olmsted county.
Methods:
The Rochester Epidemiology Project (REP) is a medical records linkage system comprising records of all residents of Olmsted County from 1966-current. CIED implantation between 1988–2018 was determined using ICD-9, ICD-10 and CPT codes. Age and gender-adjusted incidence rates, adjusted to the 2010 United States White population, were calculated. Trends in incidence over time, across age groups, and between genders are estimated using Poisson regression models.
Results:
The age and sex-adjusted incidence of device implants for the study period were as follows: overall CIED: 82.4 per 100,000 per year (95% confidence interval [CI] 79.2–85.6), Pacemaker (PPM): 62.9 (95% CI 60.0–65.7), implantable cardioverter defibrillator (ICD): 14.0 (95% CI 12.6–15.3) and cardiac resynchronization therapy (CRT): 5.6 (95% CI 4.7–6.4) per 100,000 per year. The overall incidence of CIED implantation increased between 1988–93 and 2000–05, and then decreased between 2000–05 and 2012–18 (p<.0001). PPM and ICD implantation incidence followed these trends, while the incidence of CRT implantation increased between 2000–05 and 2012–18. CIED implantation incidence increased with age (p<0.0001). CIED implantation incidence was greater in men (116.3 vs. 57.3 per 100,000 per year in males vs. females, p<.0001). The overall survival of CRT recipients improved (p=0.0044).
Conclusions:
The incidence of PPM and ICD implants is decreasing, while incidence of CRT implants is increasing. CIEDs are increasingly implanted in the elderly, males, and patients with higher comorbidities.
Keywords: Cardiovascular implantable electronic devices, pacemaker, implantable cardioverter-defibrillator, cardiac resynchronization therapy, epidemiology
Introduction:
Cardiac implantable electronic devices (CIEDs) such as the implantable cardioverter-defibrillator (ICD), permanent pacemaker (PPM), and cardiac resynchronization therapy (CRT) systems are widely utilized for alleviating a variety of cardiac diseases. (1–4). Implantation of CIEDs has been associated with increased patient quality of life, reduced length of hospital stays, and prolonged survival (5–8). Description of the temporal trends in CIED utilization in a population-based manner can inform clinicians, researchers and policymakers of the relevant changes in device implantation trends; and could guide future research projects and healthcare policies. Description of the demographics and comorbidities of CIED recipients may highlight over-utilization or under-utilization of CIEDs in specific subgroups.
Prior studies describing device implantation trends in the United States have suggested a significant increase in the use of PPMs and ICDs as their clinical indications continued to expand (1, 7, 9–11). However, the incidence of CIED utilization in the United States utilization since the mid-2000s, including PPM, ICD and CRT implantation for all indications, has not been extensively studied (12, 13). Some existing epidemiological studies on CIED incidence have relied on data from individual institutions or surveys of physicians and device manufacturers, which may not provide as accurate an estimation as a population-based study that incorporates all implantations during a given period (14–16). Hence, we conducted a retrospective population-based study of CIED implantation between 1988 and 2018. We sought to describe novel findings, beyond currently published data, focusing on the incidence, temporal trends, age and sex distribution, comorbidities and survival of patients receiving CIED implantation.
Methods:
Data source
This study was approved by the Mayo Clinic Institutional Review Board (ID 17–000371) and received proper ethical oversight. The Rochester Epidemiology Project (REP) was the data source for this study. The REP is a medical records linkage system containing medical records of all residents of Olmsted County, MN, from January 1, 1966 to present, consisting of follow up data on more than 500,000 unique individuals (17). Patient demographics, diagnostic codes such as the international classification of diseases 9th revision (ICD-9-CM) codes, and surgical procedure codes are recorded for all individuals. Paper and electronic medical records of these individuals are available for the abstraction of additional data. The REP permits collection of population-based data and has been used to define the incidence of various medical conditions. It is inclusive of two major hospital systems in Olmsted County (Mayo Clinic and Olmsted Medical Center), in addition to smaller practices.
Study population
The REP database was used to determine all patients receiving CIED implantation between 1988 and 2018. During the majority of the study period, Mayo Clinic was the only institution in Olmsted County performing CIED implantation and follow-up. Between 2015–2018, device implantation was additionally performed at Olmsted Medical Center in Rochester, MN. These patients were also included in the study. Between 1988–2015, patients receiving CIEDs were determined based on ICD-9-CM codes. Patients were classified as receiving a pacemaker (ICD-9-CM: 37.81, 37.82, 37.83), implantable cardioverter defibrillator (ICD-9-CM: 37.94) or cardiac resynchronization therapy device (ICD-9-CM: 0.50, 0.51). Data on subsequent device upgrades from PPM to ICD or CRT, or ICD to CRT were collected using ICD-9-CM codes and manually verified. Between 2015–2018, patients receiving CIEDs were based on the previously mentioned ICD-9-CM codes, ICD-10 codes and CPT codes, and then manually verified (supplementary table 1). Data regarding baseline demographics and comorbidities were obtained from the REP and abstracted from the medical records. Charlson comorbidity index was assessed as a combined index of comorbidities and was calculated according to Charlson et al (36). Individual weights assigned to comorbid conditions as part of this score are listed in supplementary table 2.
Statistical analysis
The overall incidence of CIED implantation was determined using the total number of cases divided by the population in Olmsted County in the same period. The population of Olmsted County was estimated using the census results as well as an interpolation of the populations in the years between the census years. Incidence rates were age and gender-adjusted to the 2010 United States White population. Trends in incidence over time, across age groups, and between genders are estimated using Poisson regression models. Comparisons between implant groups for categorical factors were completed using Chi-square tests. Continuous factors were compared between groups using the Analysis of Variance. Overall survival was estimated using the Kaplan-Meier method. These curves were compared between groups using log-rank tests. P-values less than 0.05 were considered significant. All analysis was completed using SAS version 9.4.
Results:
Between the years of 1988 and 2018, there were 2536 CIED initial implants in Olmsted County, including 1927 PPMs (single and dual-chamber), 440 ICDs, and 169 CRT (pacemaker N=52 and defibrillator N=117) devices (Central Illustration). The mean age at device implantation was higher for PPM recipients (76.7 years) compared to ICD (63.1 years) or CRT recipients (69.4 years). Women comprised 42.1% of all CIED recipients in the study. Baseline comorbidities of PPM, ICD and CRT patients are listed in table 1. The overall age and sex-adjusted incidence of CIED implants for the study period was 82.4 per 100,000 per year (95% CI 79.2–85.6). The age and sex-adjusted incidence of PPM, ICD, and CRT implantation were 62.9 (95% CI 60.0–65.7), 14.0 (95% CI 12.6–15.3), and 5.6 (95% CI 4.7–6.4) per 100,000 per year respectively. Among CRT recipients, the incidence of CRT-P implantation was 1.8 per 100,000 per year (95% CI 1.3–2.3), the incidence of CRT-D implantation was 3.8 per 100,000 per year (95% CI 3.1–4.5).
Central Illustration:
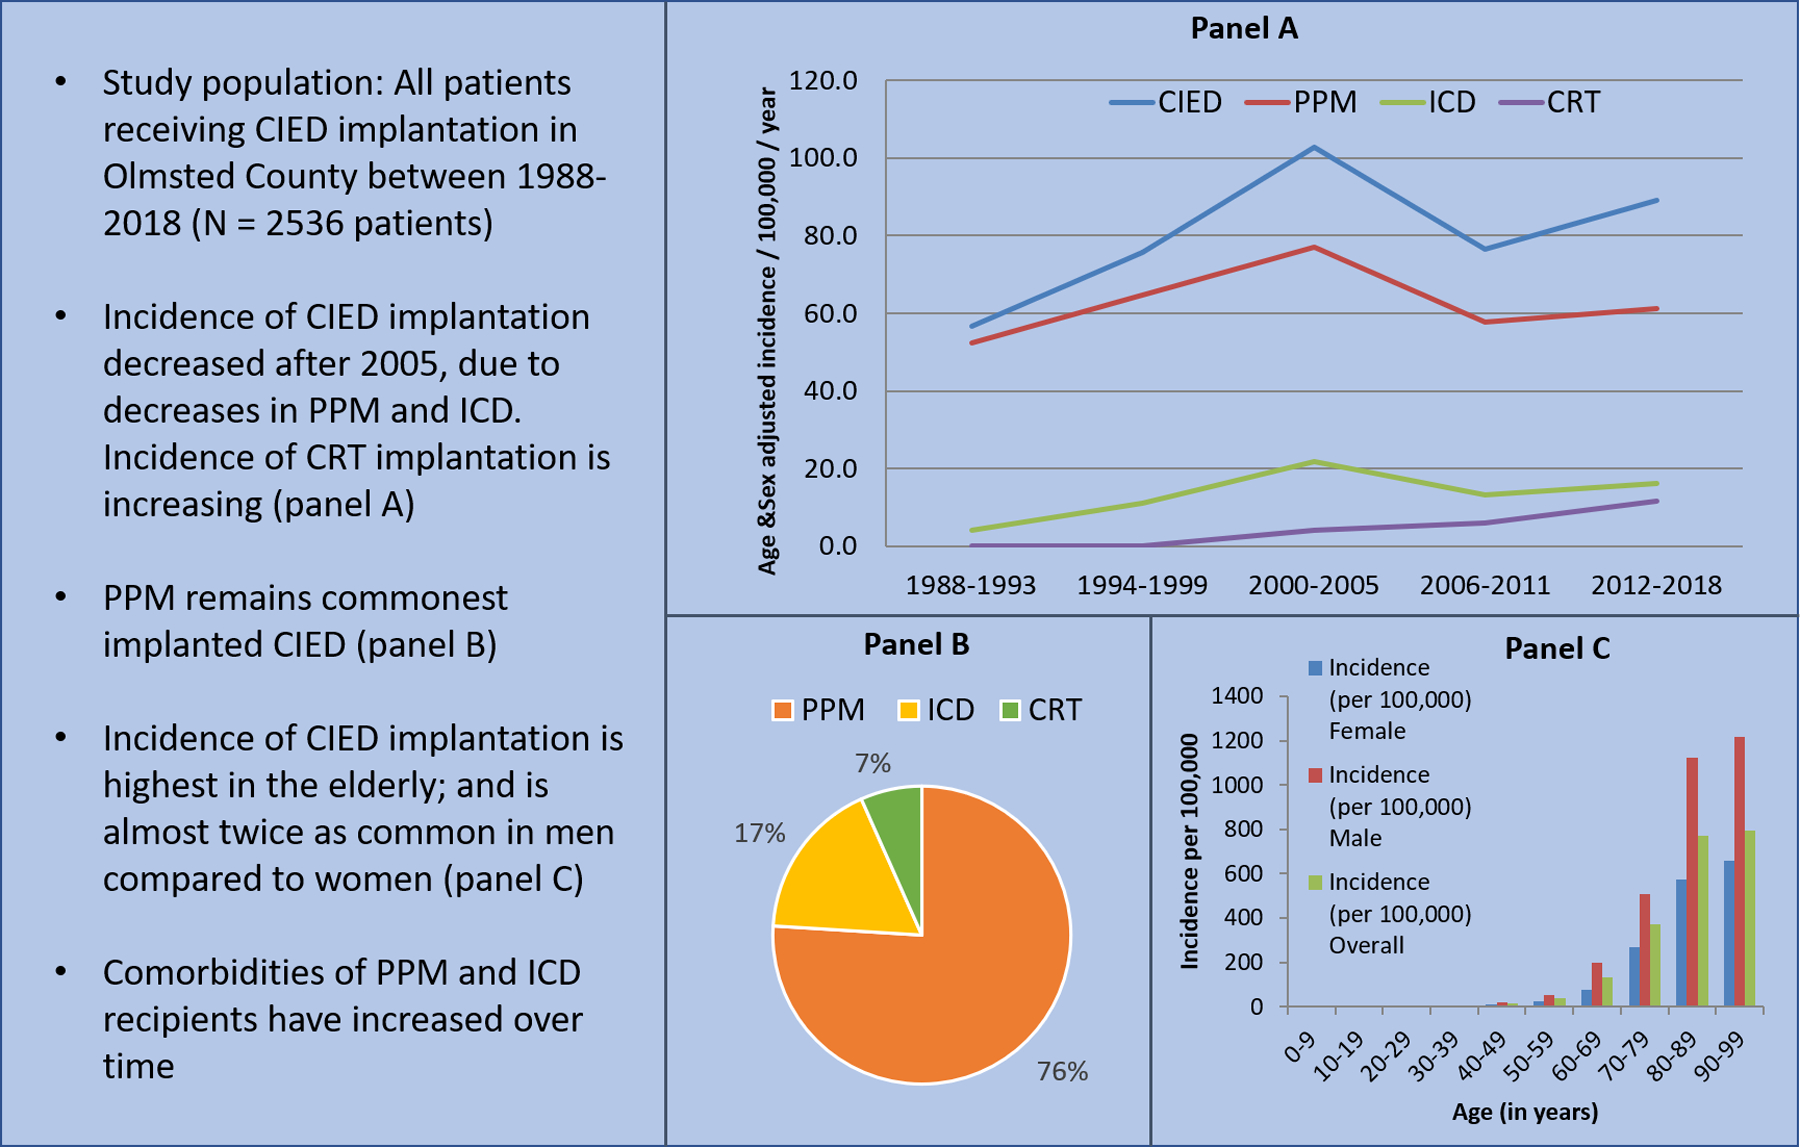
Trends in Cardiovascular Implantable Electronic Device Implantation in Olmsted County
Table 1:
Baseline demographics
| PPM (N=1927) |
ICD (N=440) |
CRT (N=169) |
Total (N=2536) |
|
|---|---|---|---|---|
| Age | ||||
| Mean (SD) | 76.7 (12.5) | 63.1 (15.8) | 69.4 (14.1) | 73.9 (14.3) |
| Range | 21.0 – 100.0 | 19.0 – 98.0 | 18.0 – 93.0 | 18.0 – 100.0 |
| Sex | ||||
| Female | 922 (47.8%) | 102 (23.2%) | 44 (26.0%) | 1068 (42.1%) |
| Male | 1005 (52.2%) | 338 (76.8%) | 125 (74.0%) | 1468 (57.9%) |
| Atrial | 1375 (71.4%) | 291 (66.1%) | 124 (73.4%) | 1790 (70.6%) |
| Fibrillation | ||||
| Coronary artery disease | 1435 (74.5%) | 365 (83.0%) | 147 (87.0%) | 1947 (76.8%) |
| Congestive heart failure | 1346 (69.8%) | 357 (81.1%) | 155 (91.7%) | 1858 (73.3%) |
| Chronic kidney disease | 956 (49.6%) | 233 (53.0%) | 98 (58.0%) | 1287 (50.7%) |
| Chronic obstructive pulmonary disease | 709 (36.8%) | 165 (37.5%) | 76 (45.0%) | 950 (37.5%) |
| Diabetes | 1170 (60.7%) | 292 (66.4%) | 118 (69.8%) | 1580 (62.3%) |
| Hypertension | 1698 (88.1%) | 361 (82.0%) | 147 (87.0%) | 2206 (87.0%) |
| Obesity | 1042 (54.1%) | 249 (56.6%) | 101 (59.8%) | 1392 (54.9%) |
| Valvular heart disease | 316 (18.3%) | 87 (22.9%) | 33 (28.0%) | 436 (19.6%) |
| Hyperlipidemia | 1216 (63.1%) | 308 (70.0%) | 91 (53.8%) | 1615 (63.7%) |
| Charlson Score | ||||
| Mean (SD) | 1.63 (1.73) | 1.88 (2.17) | 1.89 (2.08) | 1.69 (1.84) |
| Range | 0.0 – 9.0 | 0.0 – 18.0 | 0.0 – 8.0 | 0.0 – 18.0 |
Temporal trends in CIED implantation
Temporal trends were compared between five intervals: 1988–93, 94–99, 2000–2005, 2006–11, and 2012–18. There was a significant change in the age and sex-adjusted incidence of any CIED implantation over time (Figure 1A). The age and sex-adjusted incidence increased between 1988–93 to 2000–05; from 56.7 (95% CI 49.2–64.1) to 102.7 (95% CI 94.4–111.0) per 100,000 per year; and subsequently decreased to 89.0 (95% CI 82.8–95.2) per 100,000 per year in 2012–2018, p<0.001. Similar trends were noted in the PPM and ICD groups. The age and sex-adjusted incidence of PPM implantation increased between 1988–93 and 2000–05, from 52.4 (95% CI 45.3–59.6) to 76.9 (95% CI 69.8–84.1) per 100,000 per year; then decreased to 61.1 (95% CI 56.0–66.3) per 100,000 per year in 2012–2018 (p<0.001). The age and sex-adjusted incidence of ICD implantation increased between 1988–93 and 2000–05, from 4.2 (95% CI 2.2–6.2) to 21.7 (95% CI 17.8–25.5) per 100,000 per year; then decreased to 16.2 (95% CI 13.6–18.9) per 100,000 per year in 2012–2018 (p<0.001). In contrast, the age and sex-adjusted incidence of CRT implantation continued to increase significantly from 2000–05 to 2012–18, from 4.1 (95% CI 2.5–5.8) to 11.6 (95% CI 9.4–13.8) per 100,000 per year (p=0.009). These increases in implantation incidence were noted in both CRT-P (2000–05: 0.4 [95% CI 0.0–0.9], 2012–18: 5.4 [95% CI 3.8–6.9] per 100,000 per year) and CRT-D (2000–05: 1.1 [95% CI 0.3–1.9], 2012–18: 10.8 [95% CI 8.6–12.9] per 100,000 per year) populations (Figure 1B).
FIGURE 1.
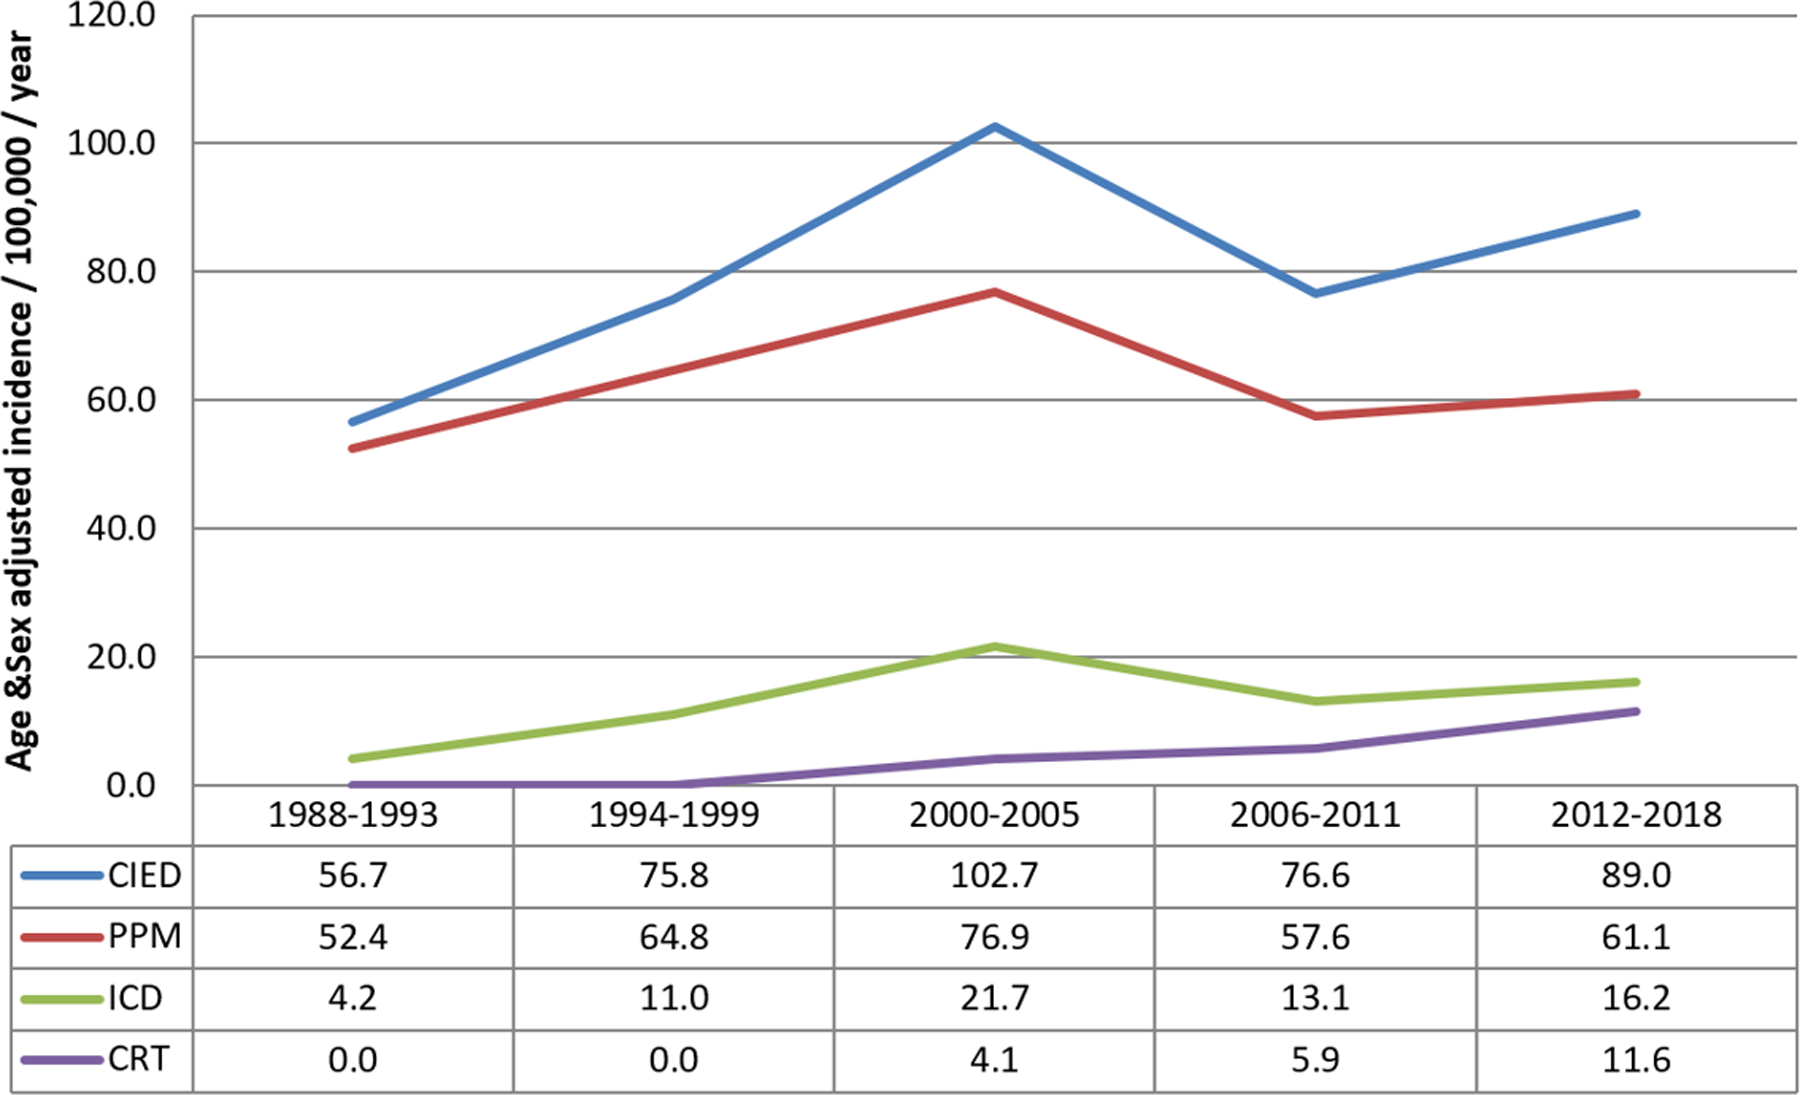
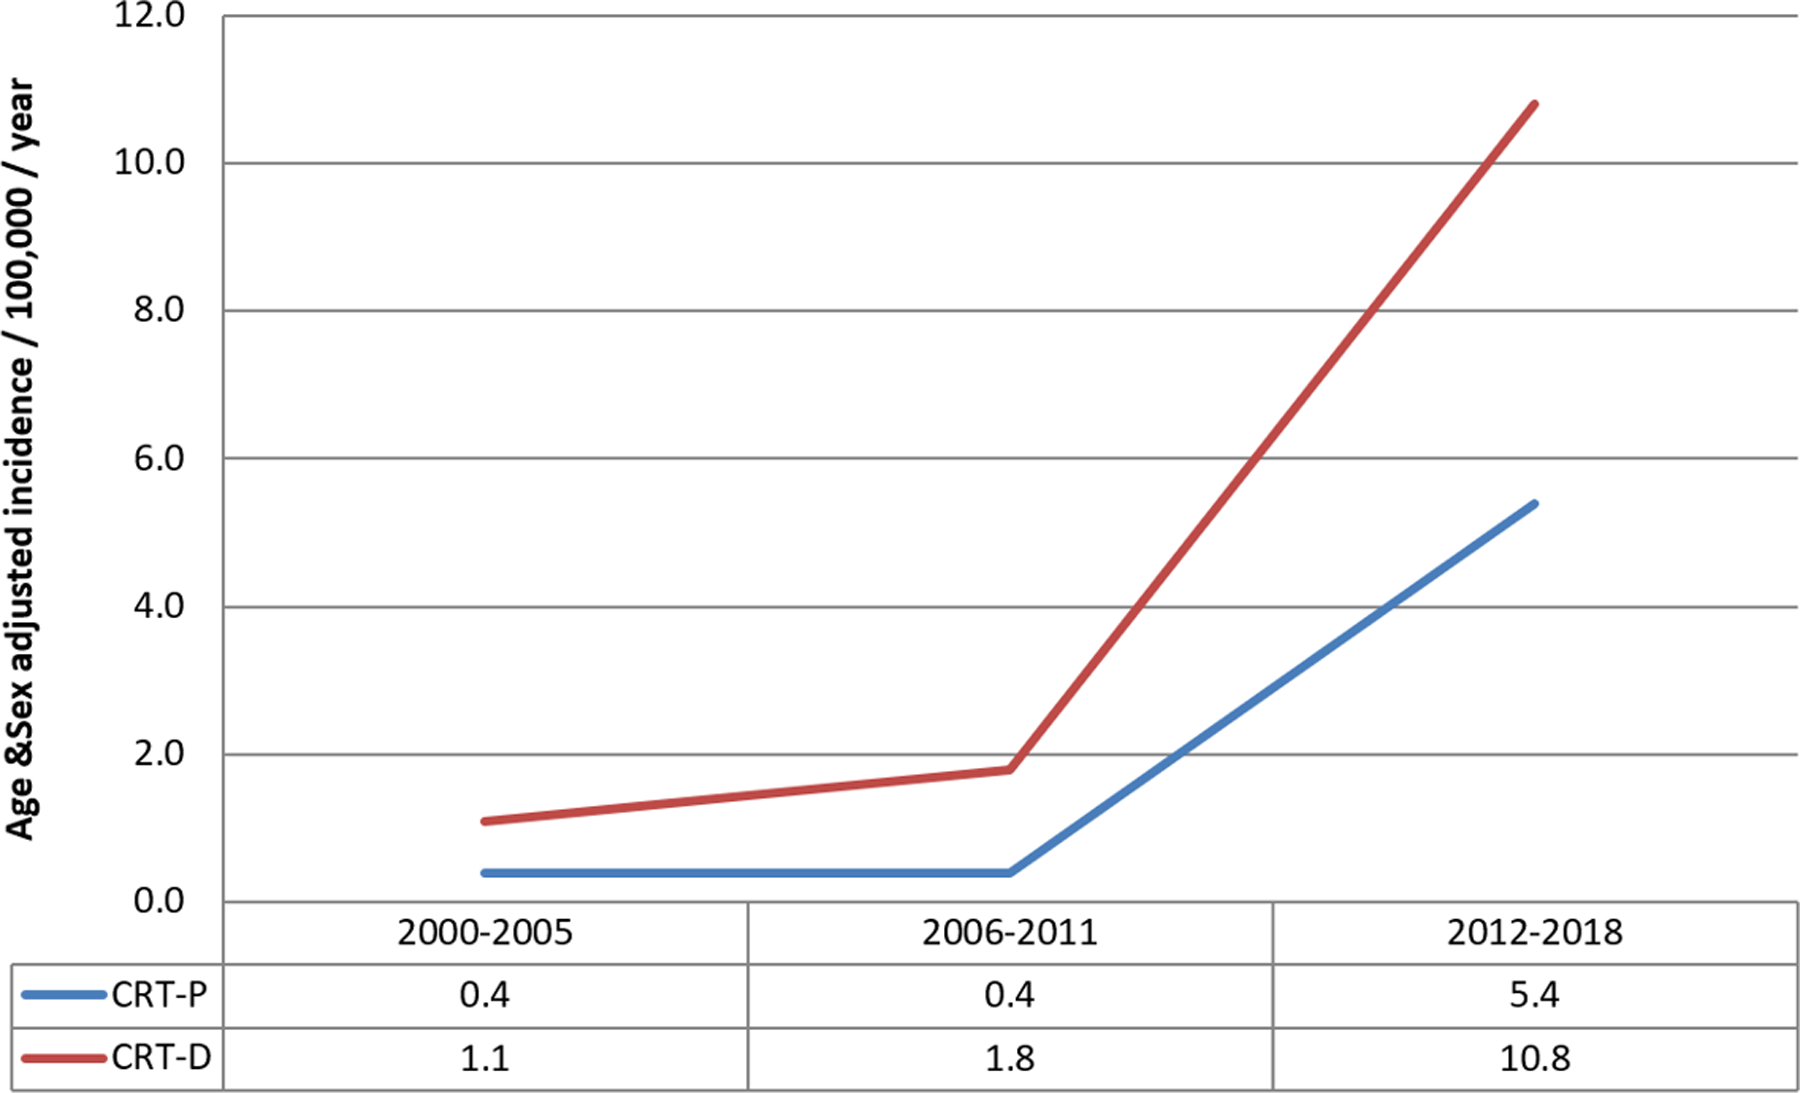
Trends in CIED Insertion in Olmsted County
CIED upgrades
Between 1988 and 2015, 88 patients underwent a device upgrade from PPM to ICD (N=24), PPM to CRT (N=39), and ICD to CRT (N=25). To examine the potential impact of device upgrades on ICD and CRT implant incidence, we included upgrades as new implants in a separate analysis. With this methodology, there was an increase in overall age and sex-adjusted ICD implantation rate to 14.5 per 100,000 per year (95% CI 13.1–15.9); and in CRT implantation rate to 6.5 per 100,000 per year (95% CI 5.6–7.5).
The inclusion of device upgrades did not change the observations of temporal trends in ICD or CRT implantation between 1988–2015 (Supplementary Figure 1).
Age and sex differences in CIED implantation
The incidence of CIED implantation increased significantly with age (p<0.001). The incidence of PPM implantation was highest in the 90–99 age group (incidence 762.5 per 100,000 per year. The incidence of ICD implantation was highest in the 70–79 age group (incidence 61.3 per 100,000 per year). The incidence of CRT implantation was highest in the 80–89 age group (incidence 34.5 per 100,000 per year). The incidence of CRT-D was highest in the 70–79 age group (20.1 per 100,000 per year), while the incidence of CRT-P was highest in the 80–89 age group (15.4 per 100,000 per year).
CIED implantation incidence was significantly greater in males compared to females (p<0.001) (Figure 2) The incidence for any CIED implant for the entire study period was 116.3 per 100,000 per year in males (95% CI 110.1–122.5) and 57.3 per 100,000 per year in females (95% CI 53.8–60.8). The incidence data for PPM, ICD, and CRT implant were consistent with these observations, with increased CIED utilization among males compared to females. The incidence of PPM implant was 82.7 per 100,000 per year in males (95% CI 77.4–88.1) and 49.2 per 100,000 per year in females (95% CI 46.0–52.4) (p<0.001). The incidence of ICD implant was 24.0 per 100,000 per year in males (95% CI 21.4–26.6) and 5.7 per 100,000 per year in females (95% CI 4.5–6.8) (p<0.001). The incidence of CRT implant was 9.5 per 100,000 per year in males (95% CI 7.8–11.2) and 2.5 per 100,000 per year in females (95% CI 1.8–3.3) (p<0.001).
FIGURE 2.
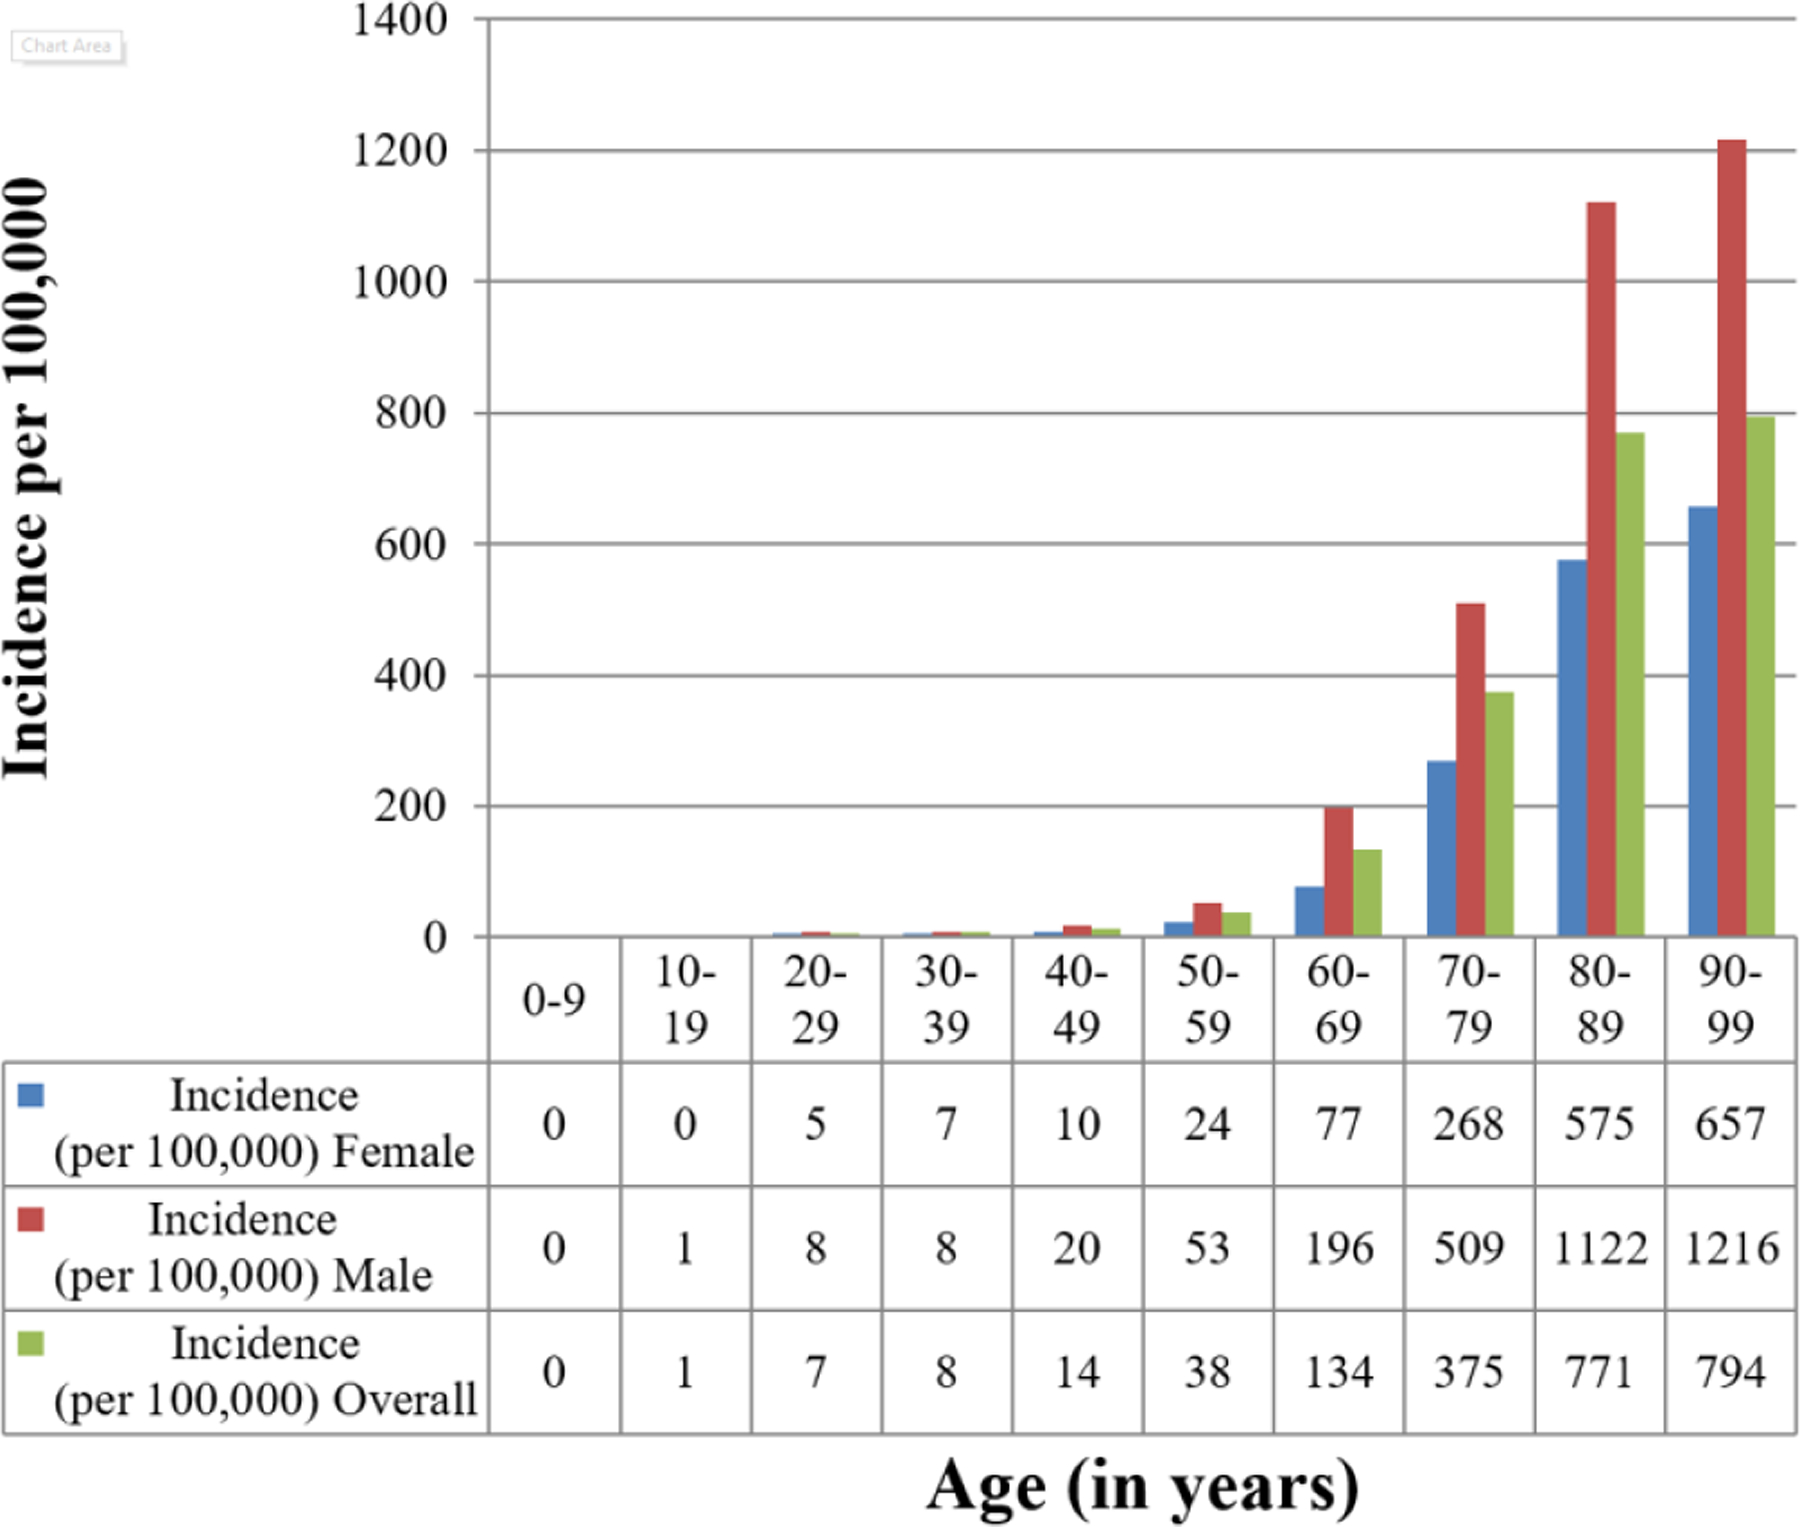
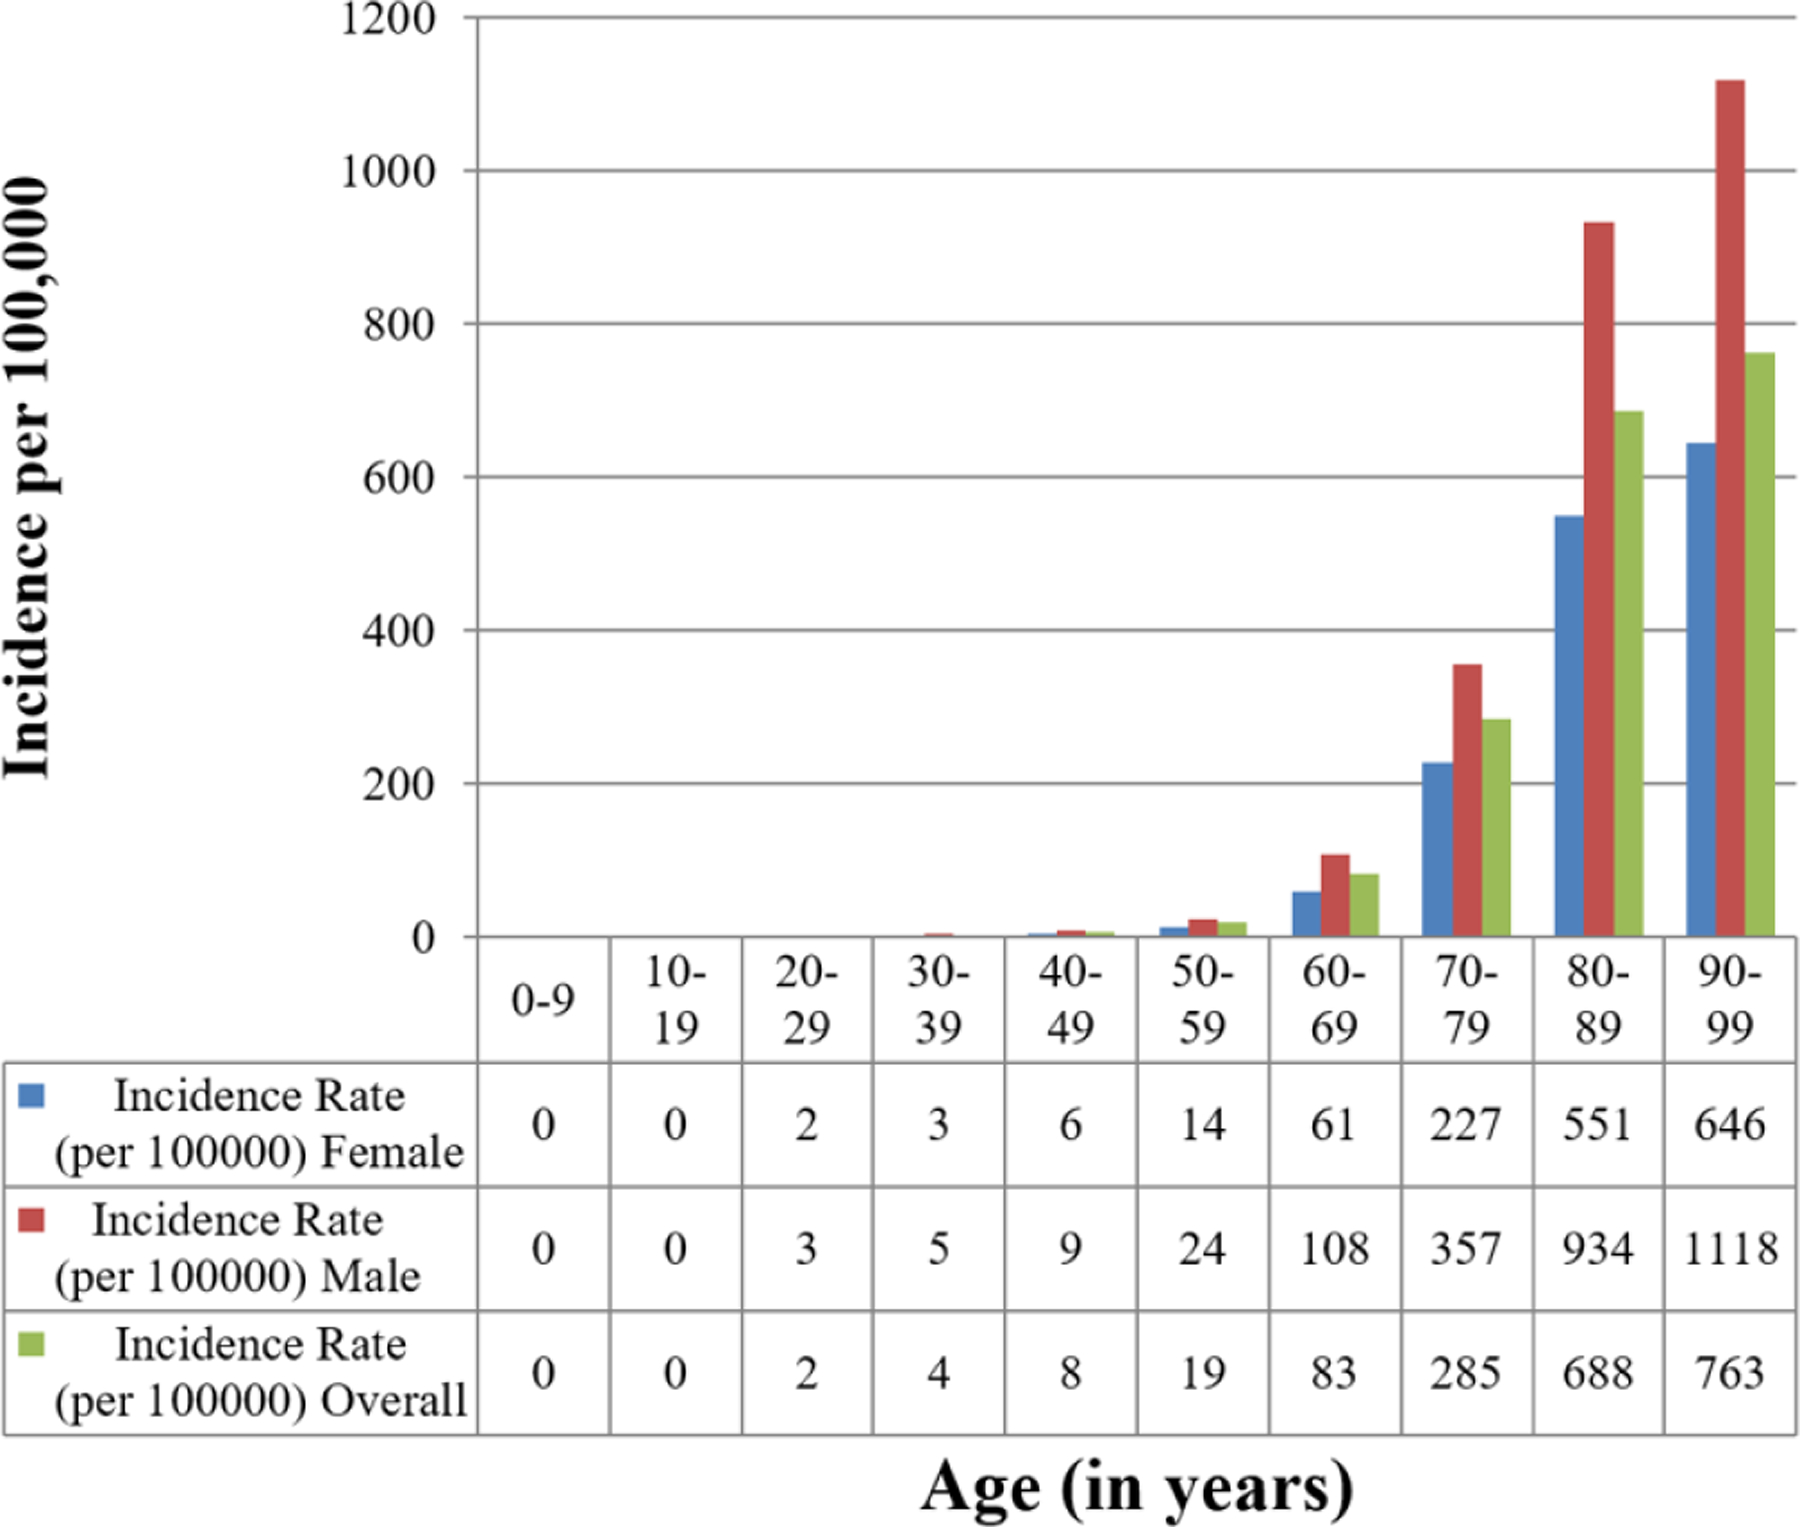
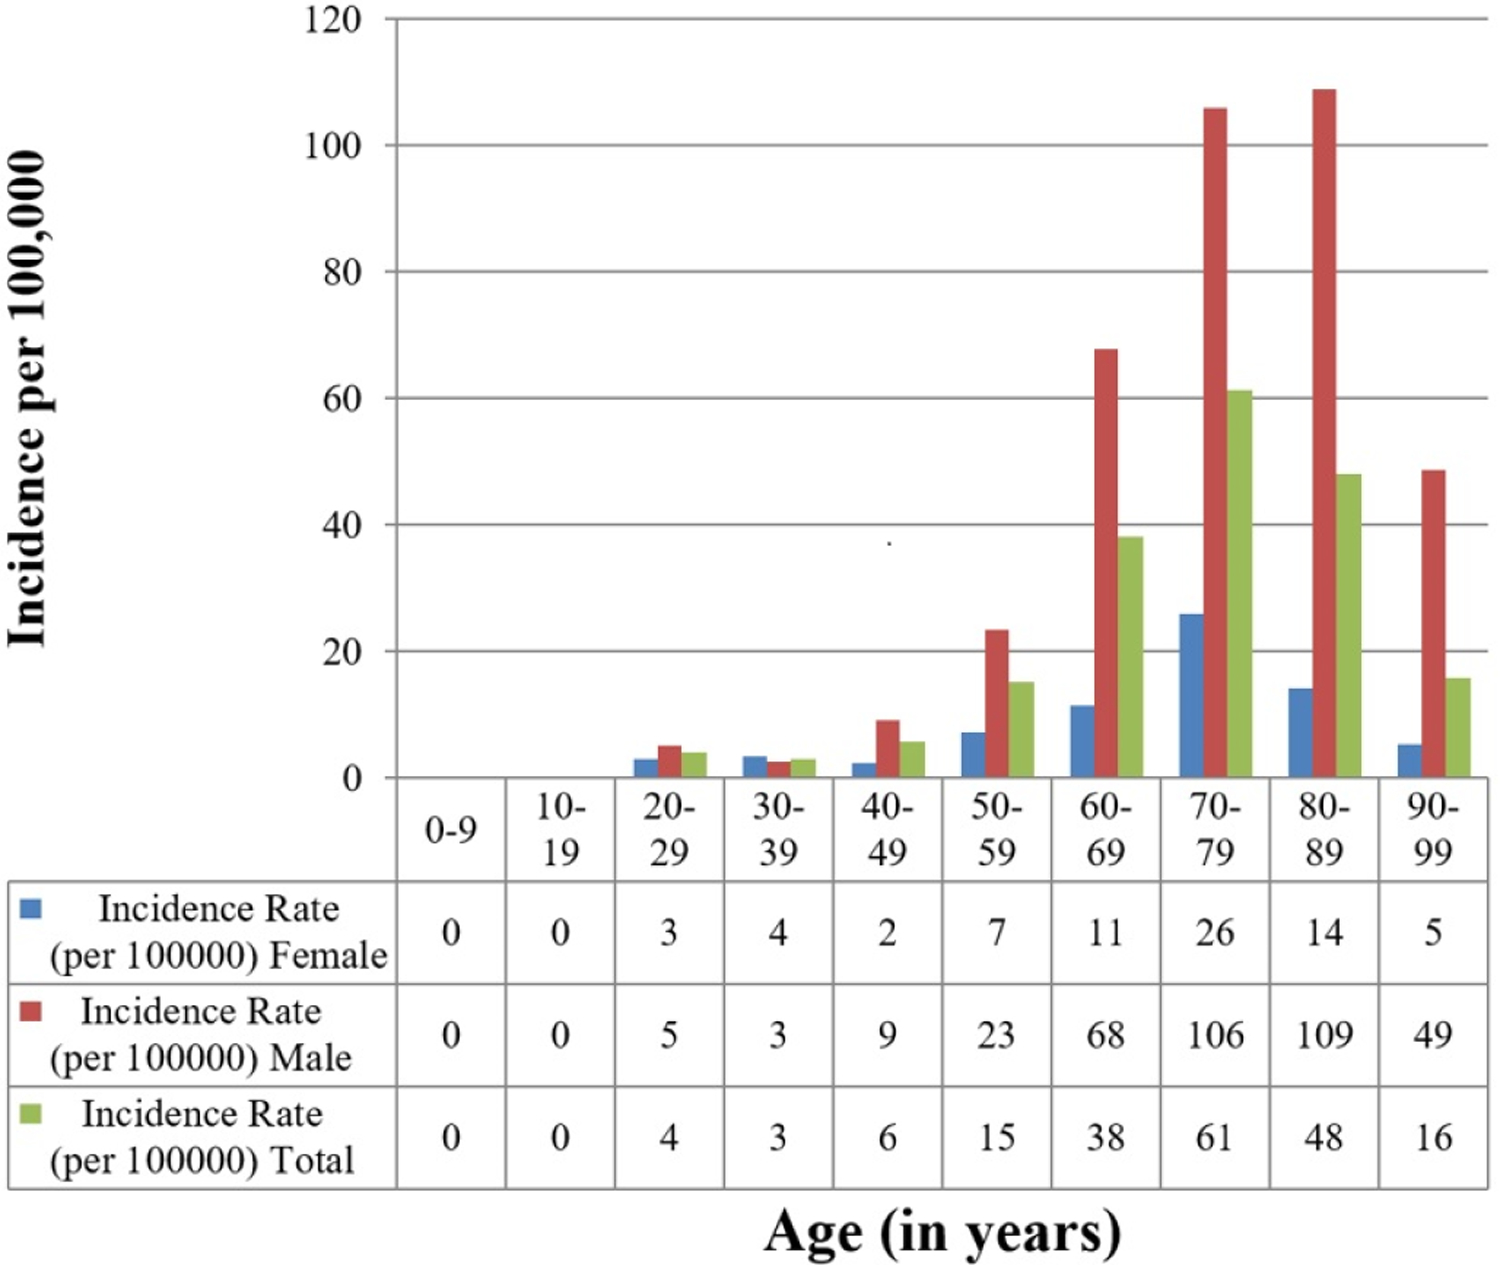
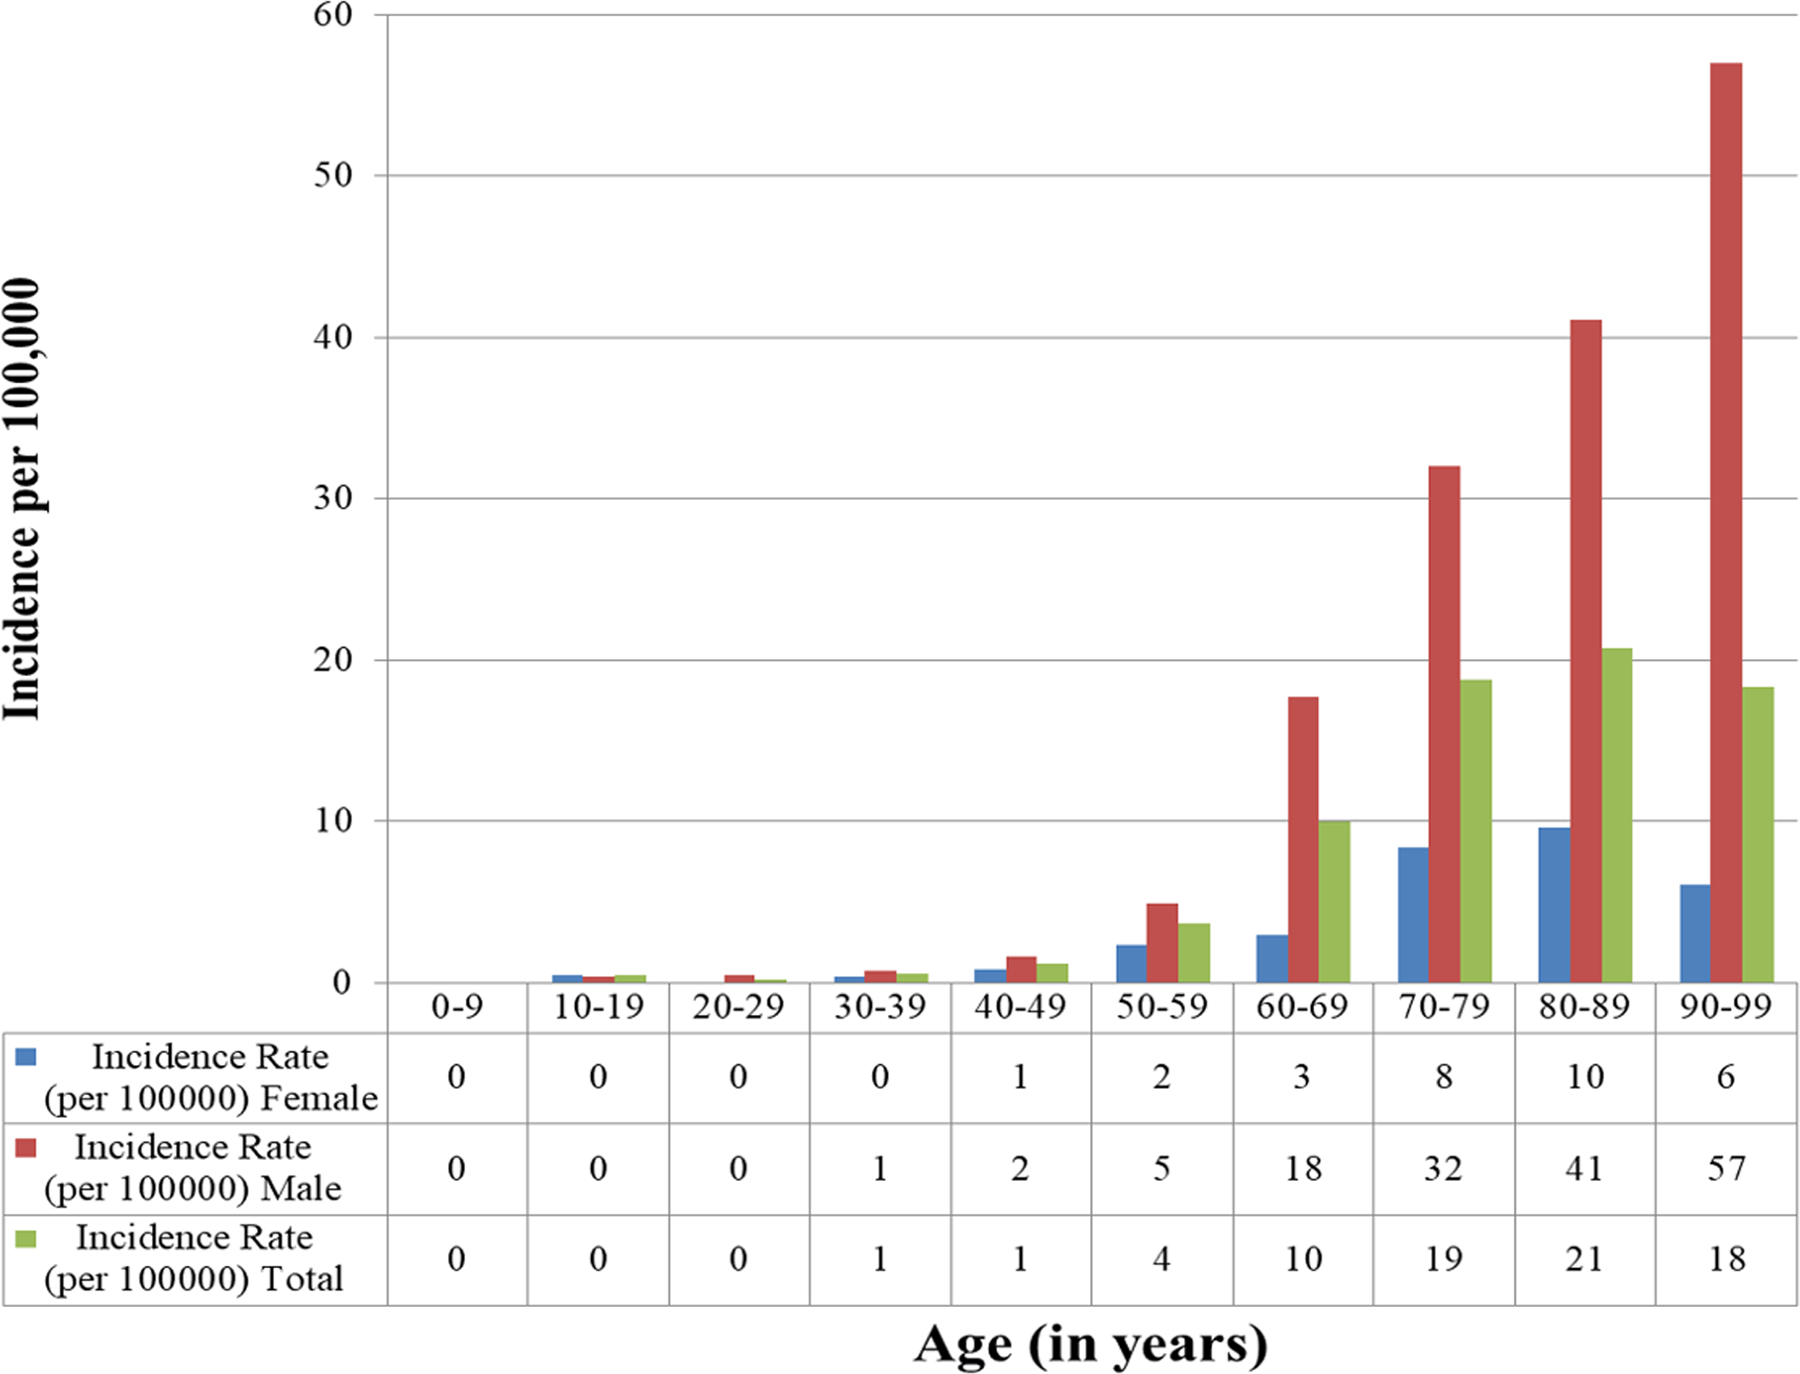
Age- and Sex-Adjusted Incidence of CIED Insertion
Trends in comorbidities of patients receiving CIEDs
The comorbidities of patients receiving CIED as assessed by the Charlson comorbidity index have increased over time.The increase in overall comorbidity is noted in the PPM and ICD groups between 1988–1993 and 2012–2018, but not in the CRT group. There is a numerical decline in the Charlson comorbidity index for the CRT group, but this change was not statistically significant. Trends in patient demographics and comorbidities for the entire population and for the PPM, ICD and CRT groups are presented in tables 2, 3, 4 and 5. Frequency of several comorbidities including atrial fibrillation, chronic kidney disease, diabetes, hypertension and hyperlipidemia increased over time.
Table 2:
Distribution of demographics and comorbidities over time for all patients
| 1988–1993 N=232) |
1994–1999 (N=369) |
2000–2005 (N=599) |
2006–2011 (N=537) |
2012–2018 (N=799) |
Total (N=2536) |
p-value⁑ | |
|---|---|---|---|---|---|---|---|
| Age | 0.95 | ||||||
| Mean (SD) | 73.9 (14.7) | 74.1 (13.8) | 74.0 (13.5) | 73.4 (15.0) | 74.0 (14.4) | 73.9 (14.3) | |
| Range | 19.0 – 97.0 | 26.0 – 100.0 | 23.0 – 99.0 | 21.0 – 100.0 | 18.0 – 99.0 | 18.0 – 100.0 | |
| Sex | 0.03 | ||||||
| Female | 109 (47.0%) | 162 (43.9%) | 274 (45.7%) | 215 (40.0%) | 308 (38.5%) | 1068 (42.1%) | |
| Male | 123 (53.0%) | 207 (56.1%) | 325 (54.3%) | 322 (60.0%) | 491 (61.5%) | 1468 (57.9%) | |
| Atrial fibrillation | 150 (64.7%) | 242 (65.6%) | 435 (72.6%) | 374 (69.6%) | 589 (73.7%) | 1790 (70.6%) | 0.009 |
| Coronary artery disease | 175 (75.4%) | 300 (81.3%) | 480 (80.1%) | 413 (76.9%) | 579 (72.5%) | 1947 (76.8%) | 0.002 |
| Congestive heart failure | 181 (78.0%) | 276 (74.8%) | 468 (78.1%) | 371 (69.1%) | 562 (70.3%) | 1858 (73.3%) | < 0.001 |
| Chronic kidney disease | 85 (36.6%) | 192 (52.0%) | 348 (58.1%) | 274 (51.0%) | 388 (48.6%) | 1287 (50.7%) | < 0.001 |
| Chronic obstructive pulmonary disease | 80 (34.5%) | 157 (42.5%) | 250 (41.7%) | 187 (34.8%) | 276 (34.5%) | 950 (37.5%) | 0.007 |
| Diabetes | 93 (40.1%) | 188 (50.9%) | 369 (61.6%) | 370 (68.9%) | 560 (70.1%) | 1580 (62.3%) | < 0.001 |
| Hypertension | 170 (73.3%) | 316 (85.6%) | 538 (89.8%) | 482 (89.8%) | 700 (87.6%) | 2206 (87.0%) | < 0.001 |
| Obesity | 111 (47.8%) | 188 (50.9%) | 298 (49.7%) | 311 (57.9%) | 484 (60.6%) | 1392 (54.9%) | < 0.001 |
| Valvular heart disease | 46 (19.8%) | 55 (14.9%) | 108 (18.0%) | 100 (18.6%) | 127 (26.0%) | 436 (19.6%) | < 0.001 |
| Hyperlipidemia | 88 (37.9%) | 234 (63.4%) | 474 (79.1%) | 461 (85.8%) | 358 (44.8%) | 1615 (63.7%) | < 0.001 |
| Any cancer* | 16 (6.9%) | 49 (13.3%) | 120 (20.0%) | 114 (21.2%) | 171 (21.4%) | 470 (18.5%) | <0.001 |
| Charlson comorbidity index | < 0.001 | ||||||
| Mean (SD) | 1.1 (1.3) | 1.5 (1.5) | 2.0 (1.8) | 2.1 (1.8) | 2.3 (1.9) |
including lymphoma, leukemia and metastatic solid organ tumors
p-value compares demographics over time groups
Table 3.
Distribution of demographics and comorbidities over time for patients receiving PPM
| Overall comparisons between groups | |||||||
|---|---|---|---|---|---|---|---|
| 1988 – 1993 (N=214) |
1994 – 1999 (N=318) |
2000 – 2005 (N=449) |
2006 – 2011 (N=401) |
2012 – 2018 (N=545) |
Total (N=1927) |
p value⁑ | |
| Age | 0.04 | ||||||
| Mean (SD) | 75.4 (13.5) | 75.4 (13.7) | 76.8 (11.8) | 76.8 (12.7) | 77.9 (11.7) | 76.7 (12.5) | |
| Range | (23.0–97.0) | (26.0–100.0) | (25.0–99.0) | (21.0–100.0) | (23.0–99.0) | (21.0–100.0) | |
| Sex | 0.005 | ||||||
| Female | 108 (50.5%) | 150 (47.2%) | 246 (54.8%) | 182 (45.4%) | 236 (43.3%) | 922 (47.8%) | |
| Male | 106 (49.5%) | 168 (52.8%) | 203 (45.2%) | 219 (54.6%) | 309 (56.7%) | 1005 (52.2%) | |
| Atrial fibrillation | 139 (65.0%) | 208 (65.4%) | 333 (74.2%) | 288 (71.8%) | 407 (74.7%) | 1375 (71.4%) | 0.005 |
| Coronary artery disease | 160 (74.8%) | 255 (80.2%) | 349 (77.7%) | 305 (76.1%) | 366 (67.2%) | 1435 (74.5%) | 0.0001 |
| Congestive heart failure | 166 (77.6%) | 236 (74.2%) | 341 (75.9%) | 263 (65.6%) | 340 (62.4%) | 1346 (69.8%) | <0.0001 |
| Chronic kidney disease | 77 (36.0%) | 160 (50.3%) | 254 (56.6%) | 202 (50.4%) | 263 (48.3%) | 956 (49.6%) | <0.0001 |
| Chronic obstructive pulmonary disease | 71 (33.2%) | 136 (42.8%) | 183 (40.8%) | 139 (34.7%) | 180 (33.0%) | 709 (36.8%) | 0.01 |
| Diabetes | 87 (40.7%) | 158 (49.7%) | 267 (59.5%) | 277 (69.1%) | 381 (69.9%) | 1170 (60.7%) | <0.0001 |
| Hypertension | 161 (75.2%) | 276 (86.8%) | 409 (91.1%) | 372 (92.8%) | 480 (88.1%) | 1698 (88.1%) | <0.0001 |
| Obesity | 106 (49.5%) | 162 (50.9%) | 224 (49.9%) | 233 (58.1%) | 317 (58.2%) | 1042 (54.1%) | 0.01 |
| Valvular heart disease | 39 (18.2%) | 43 (13.5%) | 76 (16.9%) | 68 (17.0%) | 90 (16.5%) | 316 (16.4%) | 0.62 |
| Hyperlipidemia | 79 (36.9%) | 193 (60.7%) | 346 (77.1%) | 350 (87.3%) | 471 (86.4%) | 1439 (74.7%) | <0.0001 |
| Any cancer* | 14 (6.5%) | 47 (14.8%) | 96 (21.4%) | 93 (23.2%) | 135 (24.8%) | 385 (20.0%) | <0.0001 |
| Charlson comorbidity index | |||||||
| Mean (SD) | 1.1 (1.3) | 1.6 (1.5) | 1.9 (1.6) | 2.0 (1.8) | 2.3 (1.9) | <0.001 | |
including lymphoma, leukemia and metastatic solid organ tumors
p-value compares demographics over time groups
Table 4.
Distribution of demographics and comorbidities over time for patients receiving ICD
| Overall comparisons between groups | |||||||
|---|---|---|---|---|---|---|---|
| 1988 – 1993 (N=18) |
1994 – 1999 (N=51) |
2000 – 2005 (N=126) |
2006 – 2011 (N=95) |
2012 – 2018 (N=150) |
Total (N=440) |
p value⁑ | |
| Age | 0.27 | ||||||
| Mean (SD) | 57.1 (18.1) | 66.2 (11.6) | 65.0 (14.4) | 61.6 (18.0) | 62.1 (16.3) | 63.1 (15.8) | |
| Range | (19.0–78.0) | (36.0–86.0) | (23.0–91.0) | (21.0–98.0) | (20.0–90.0) | (19.0–98.0) | |
| Sex | 0.048 | ||||||
| Female | 1 (5.6%) | 12 (23.5%) | 21 (16.7%) | 24 (25.3%) | 44 (29.3%) | 102 (23.2%) | |
| Male | 17 (94.4%) | 39 (76.5%) | 105 (83.3%) | 71 (74.7%) | 106 (70.7%) | 338 (76.8%) | |
| Atrial fibrillation | 11 (61.1%) | 34 (66.7%) | 85 (67.5%) | 58 (61.1%) | 103 (68.7%) | 291 (66.1%) | 0.76 |
| Coronary artery disease | 15 (83.3%) | 45 (88.2%) | 109 (86.5%) | 75 (78.9%) | 121 (80.7%) | 365 (83.0%) | 0.43 |
| Congestive heart failure | 15 (83.3%) | 40 (78.4%) | 103 (81.7%) | 75 (78.9%) | 124 (82.7%) | 357 (81.1%) | 0.93 |
| Chronic kidney disease | 8 (44.4%) | 32 (62.7%) | 77 (61.1%) | 48 (50.5%) | 68 (45.3%) | 233 (53.0%) | 0.048 |
| Chronic obstructive pulmonary disease | 9 (50.0%) | 21 (41.2%) | 55 (43.7%) | 33 (34.7%) | 47 (31.3%) | 165 (37.5%) | 0.17 |
| Diabetes | 6 (33.3%) | 30 (58.8%) | 85 (67.5%) | 68 (71.6%) | 103 (68.7%) | 292 (66.4%) | 0.019 |
| Hypertension | 9 (50.0%) | 40 (78.4%) | 108 (85.7%) | 78 (82.1%) | 126 (84.0%) | 361 (82.0%) | 0.005 |
| Obesity | 5 (27.8%) | 26 (51.0%) | 64 (50.8%) | 58 (61.1%) | 96 (64.0%) | 249 (56.6%) | 0.014 |
| Valvular heart disease | 7 (38.9%) | 12 (23.5%) | 29 (23.0%) | 22 (23.2%) | 17 (11.3%) | 87 (19.8%) | 0.012 |
| Hyperlipidemia | 9 (50.0%) | 41 (80.4%) | 107 (84.9%) | 79 (83.2%) | 127 (84.7%) | 363 (82.5%) | 0.006 |
| Any cancer* | 2 (11.1%) | 2 (3.9%) | 15 (11.9%) | 14 (14.7%) | 15 (10.0%) | 48 (10.9%) | 0.37 |
| Charlson comorbidity index | |||||||
| Mean (SD) | 1.4 (1.4) | 1.4 (1.7) | 2.3 (2.1) | 2.3 (1.8) | 2.0 (1.9) | 0.018 | |
including lymphoma, leukemia and metastatic solid organ tumors
p-value compares demographics over time groups
Table 5.
Distribution of demographics and comorbidities over time for patients receiving CRT
| Overall comparisons between groups | |||||
|---|---|---|---|---|---|
| 2000 – 2005 (N=24) |
2006 – 2011 (N=41) |
2012 – 2018 (N=104) |
Total (N=169) |
p value⁑ | |
| Age | 0.35 | ||||
| Mean (SD) | 69.0 (16.4) | 67.8 (12.8) | 70.1 (14.2) | 69.4 (14.1) | |
| Range | (26.0–91.0) | (37.0–90.0) | (18.0–93.0) | (18.0–93.0) | |
| Sex | 0.77 | ||||
| Female | 7 (29.2%) | 9 (22.0%) | 28 (26.9%) | 44 (26.0%) | |
| Male | 17 (70.8%) | 32 (78.0%) | 76 (73.1%) | 125 (74.0%) | |
| Atrial fibrillation | 17 (70.8%) | 28 (68.3%) | 79 (76.0%) | 124 (73.4%) | 0.61 |
| Coronary artery disease | 22 (91.7%) | 33 (80.5%) | 92 (88.5%) | 147 (87.0%) | 0.33 |
| Congestive heart failure | 24 (100.0%) | 33 (80.5%) | 98 (94.2%) | 155 (91.7%) | 0.007 |
| Chronic kidney disease | 17 (70.8%) | 24 (58.5%) | 57 (54.8%) | 98 (58.0%) | 0.36 |
| Chronic obstructive pulmonary disease | 12 (50.0%) | 15 (36.6%) | 49 (47.1%) | 76 (45.0%) | 0.45 |
| Diabetes | 17 (70.8%) | 25 (61.0%) | 76 (73.1%) | 118 (69.8%) | 0.36 |
| Hypertension | 21 (87.5%) | 32 (78.0%) | 94 (90.4%) | 147 (87.0%) | 0.14 |
| Obesity | 10 (41.7%) | 20 (48.8%) | 71 (68.3%) | 101 (59.8%) | 0.015 |
| Valvular heart disease | 3 (12.5%) | 10 (24.4%) | 20 (19.2%) | 33 (19.5%) | 0.50 |
| Hyperlipidemia | 21 (87.5%) | 32 (78.0%) | 97 (93.3%) | 150 (88.8%) | 0.03 |
| Any_cancer* | 9 (37.5%) | 7 (17.1%) | 21 (20.2%) | 37 (21.9%) | 0.13 |
| Charlson comorbidity index | |||||
| Mean (SD) | 3.3 (2.2) | 3.0 (2.0) | 2.7 (1.7) | 0.31 | |
including lymphoma, leukemia and metastatic solid organ tumors
p-value compares demographics over time groups
Overall survival after CIED implantation
The median follow-up period was 6.0 years (interquartile range 3.0–10.9 years). Survival after CIED implantation was 67.5% at 5 years (95% CI 65.7–69.4%). After PPM, ICD and CRT implantation the survival rate was 65.7% (95% CI 63.6–67.8%); 76.2% (95% CI 72.3–80.3%) and 66.7% (95% CI 60.5–73.6%) at 5 years.
Survival after PPM implantation changed significantly over time (figure 3B, p<0.0001), with most favorable survival among PPM recipients in 1988–93. Survival among patients with CRT improved over time (Figure 3A, p=0.0014). Survival among patients receiving ICD was unchanged over time, with a trend toward significance (p=0.066). Additionally, survival among those receiving initial ICD implant vs. upgrade to ICD was not different (p=0.94). Similarly, survival among those receiving initial CRT implant vs. upgrade to CRT was not different (p=0.10).
FIGURE 3.
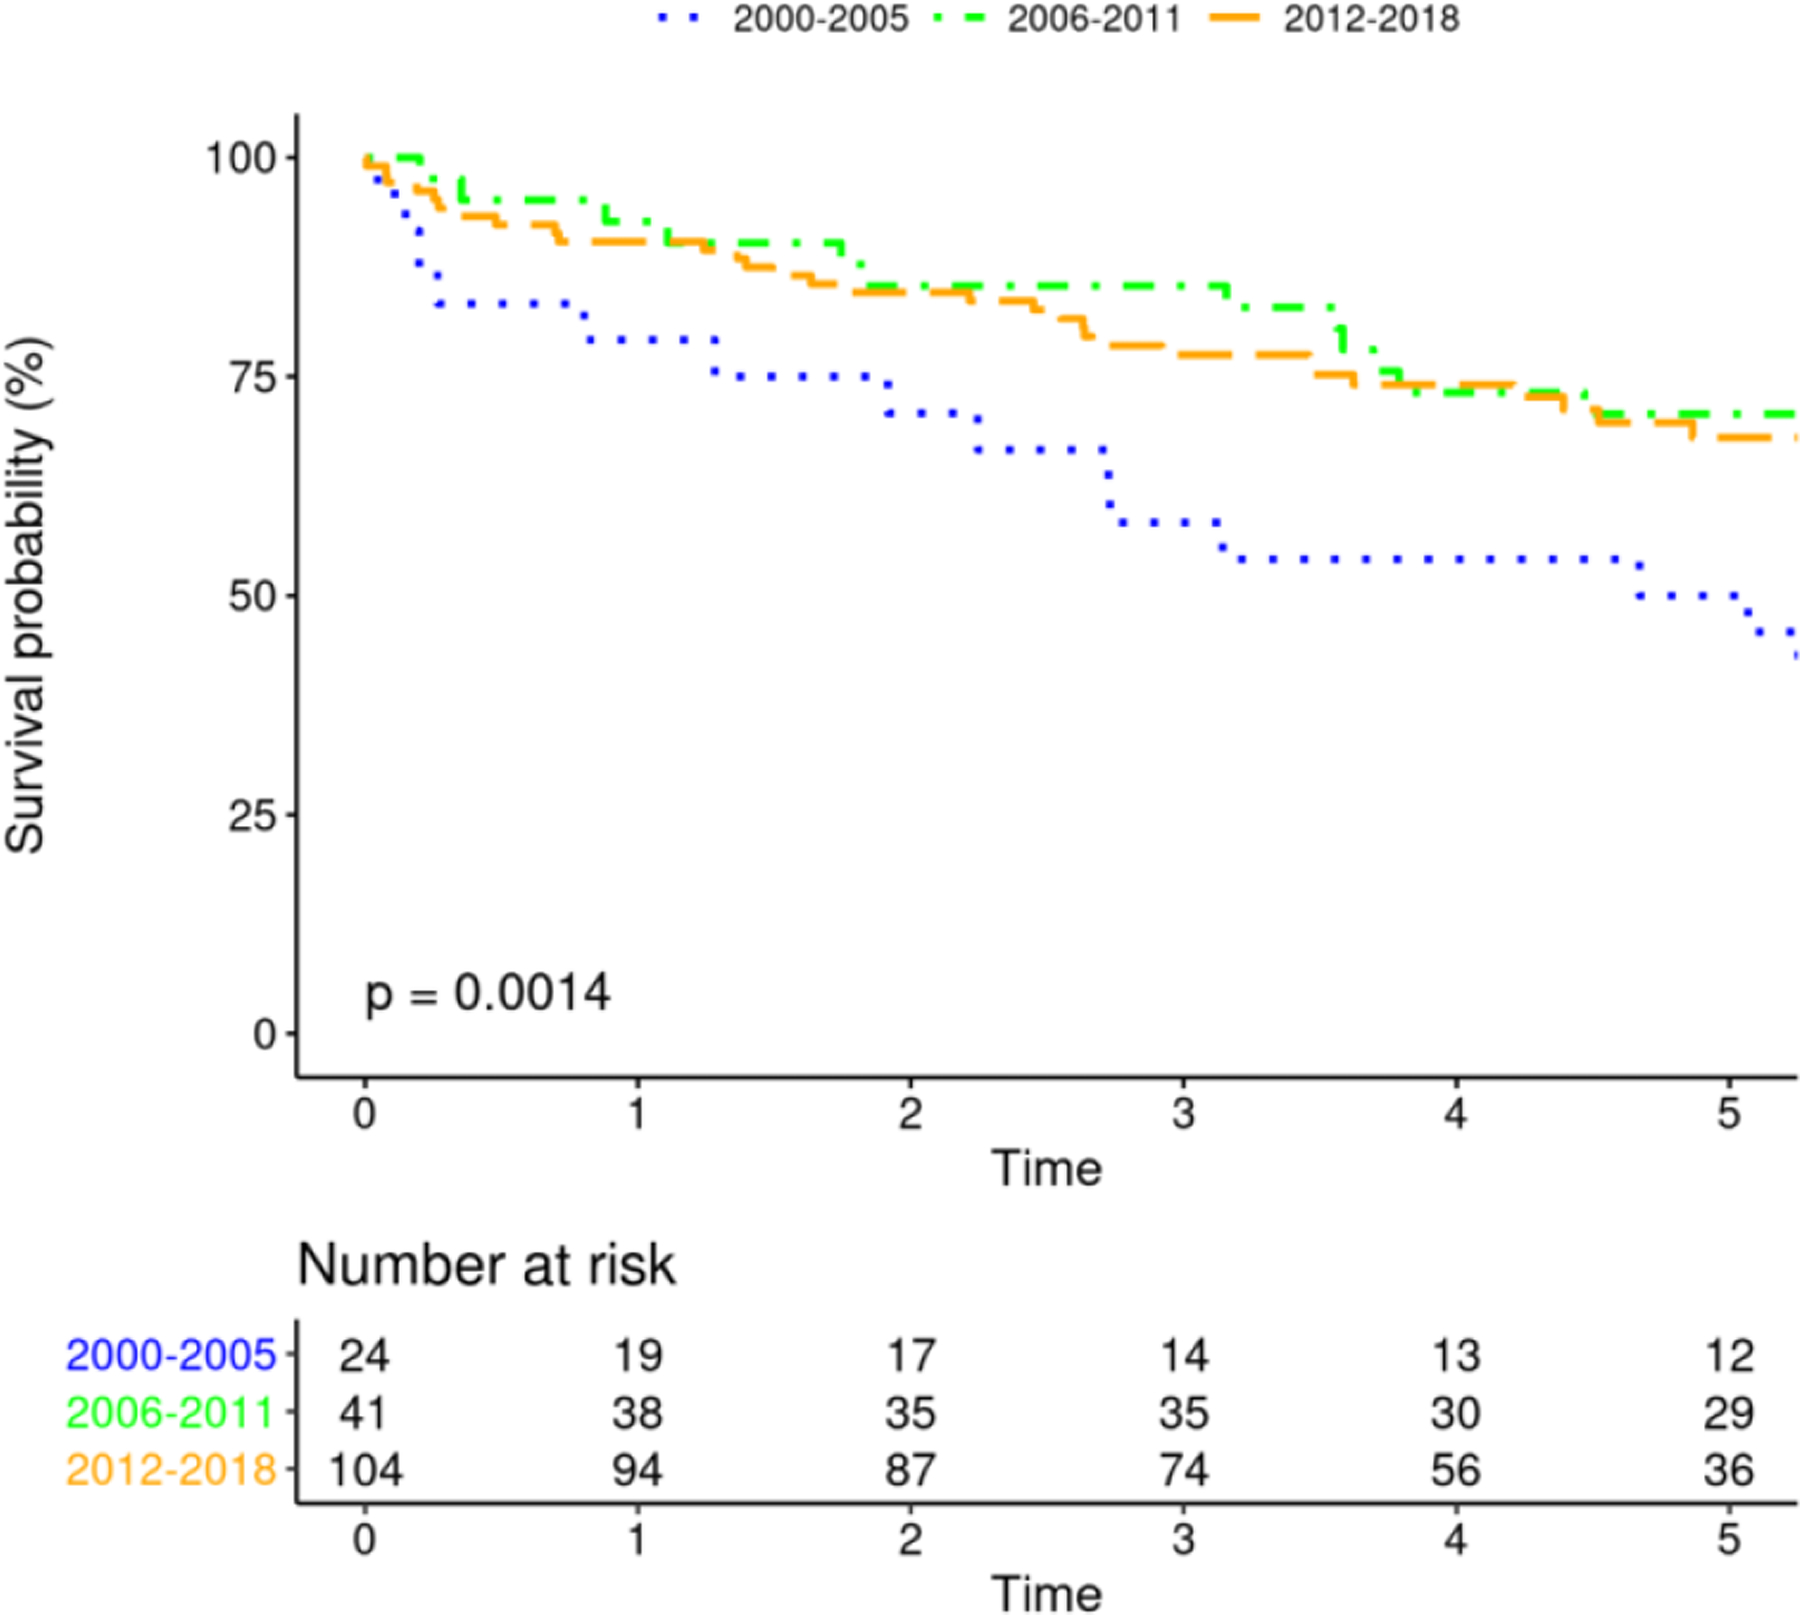
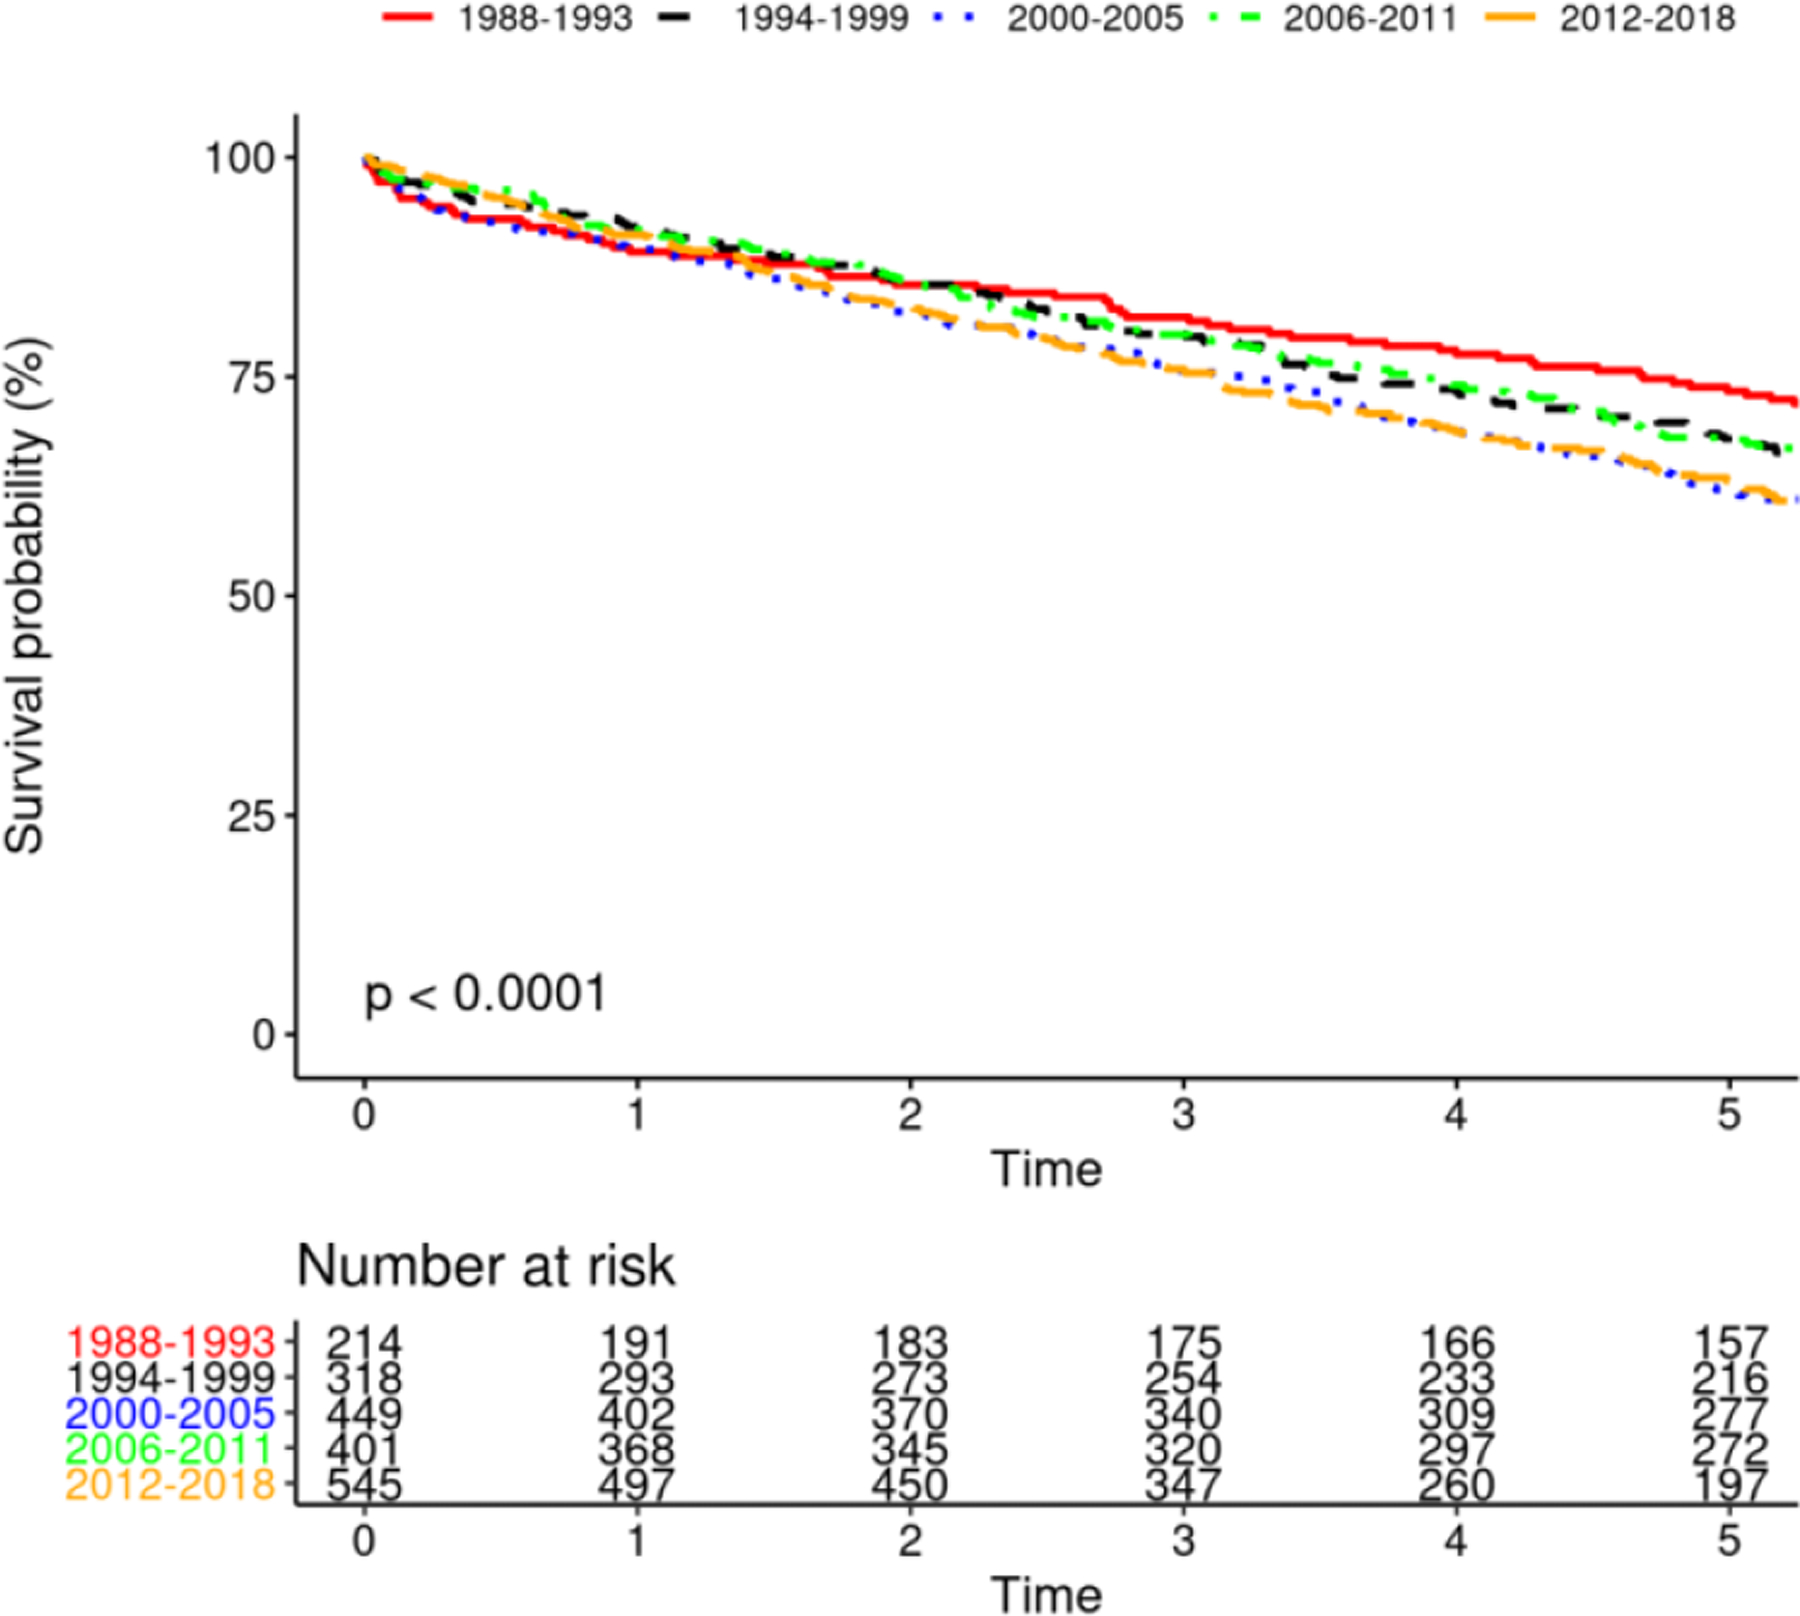
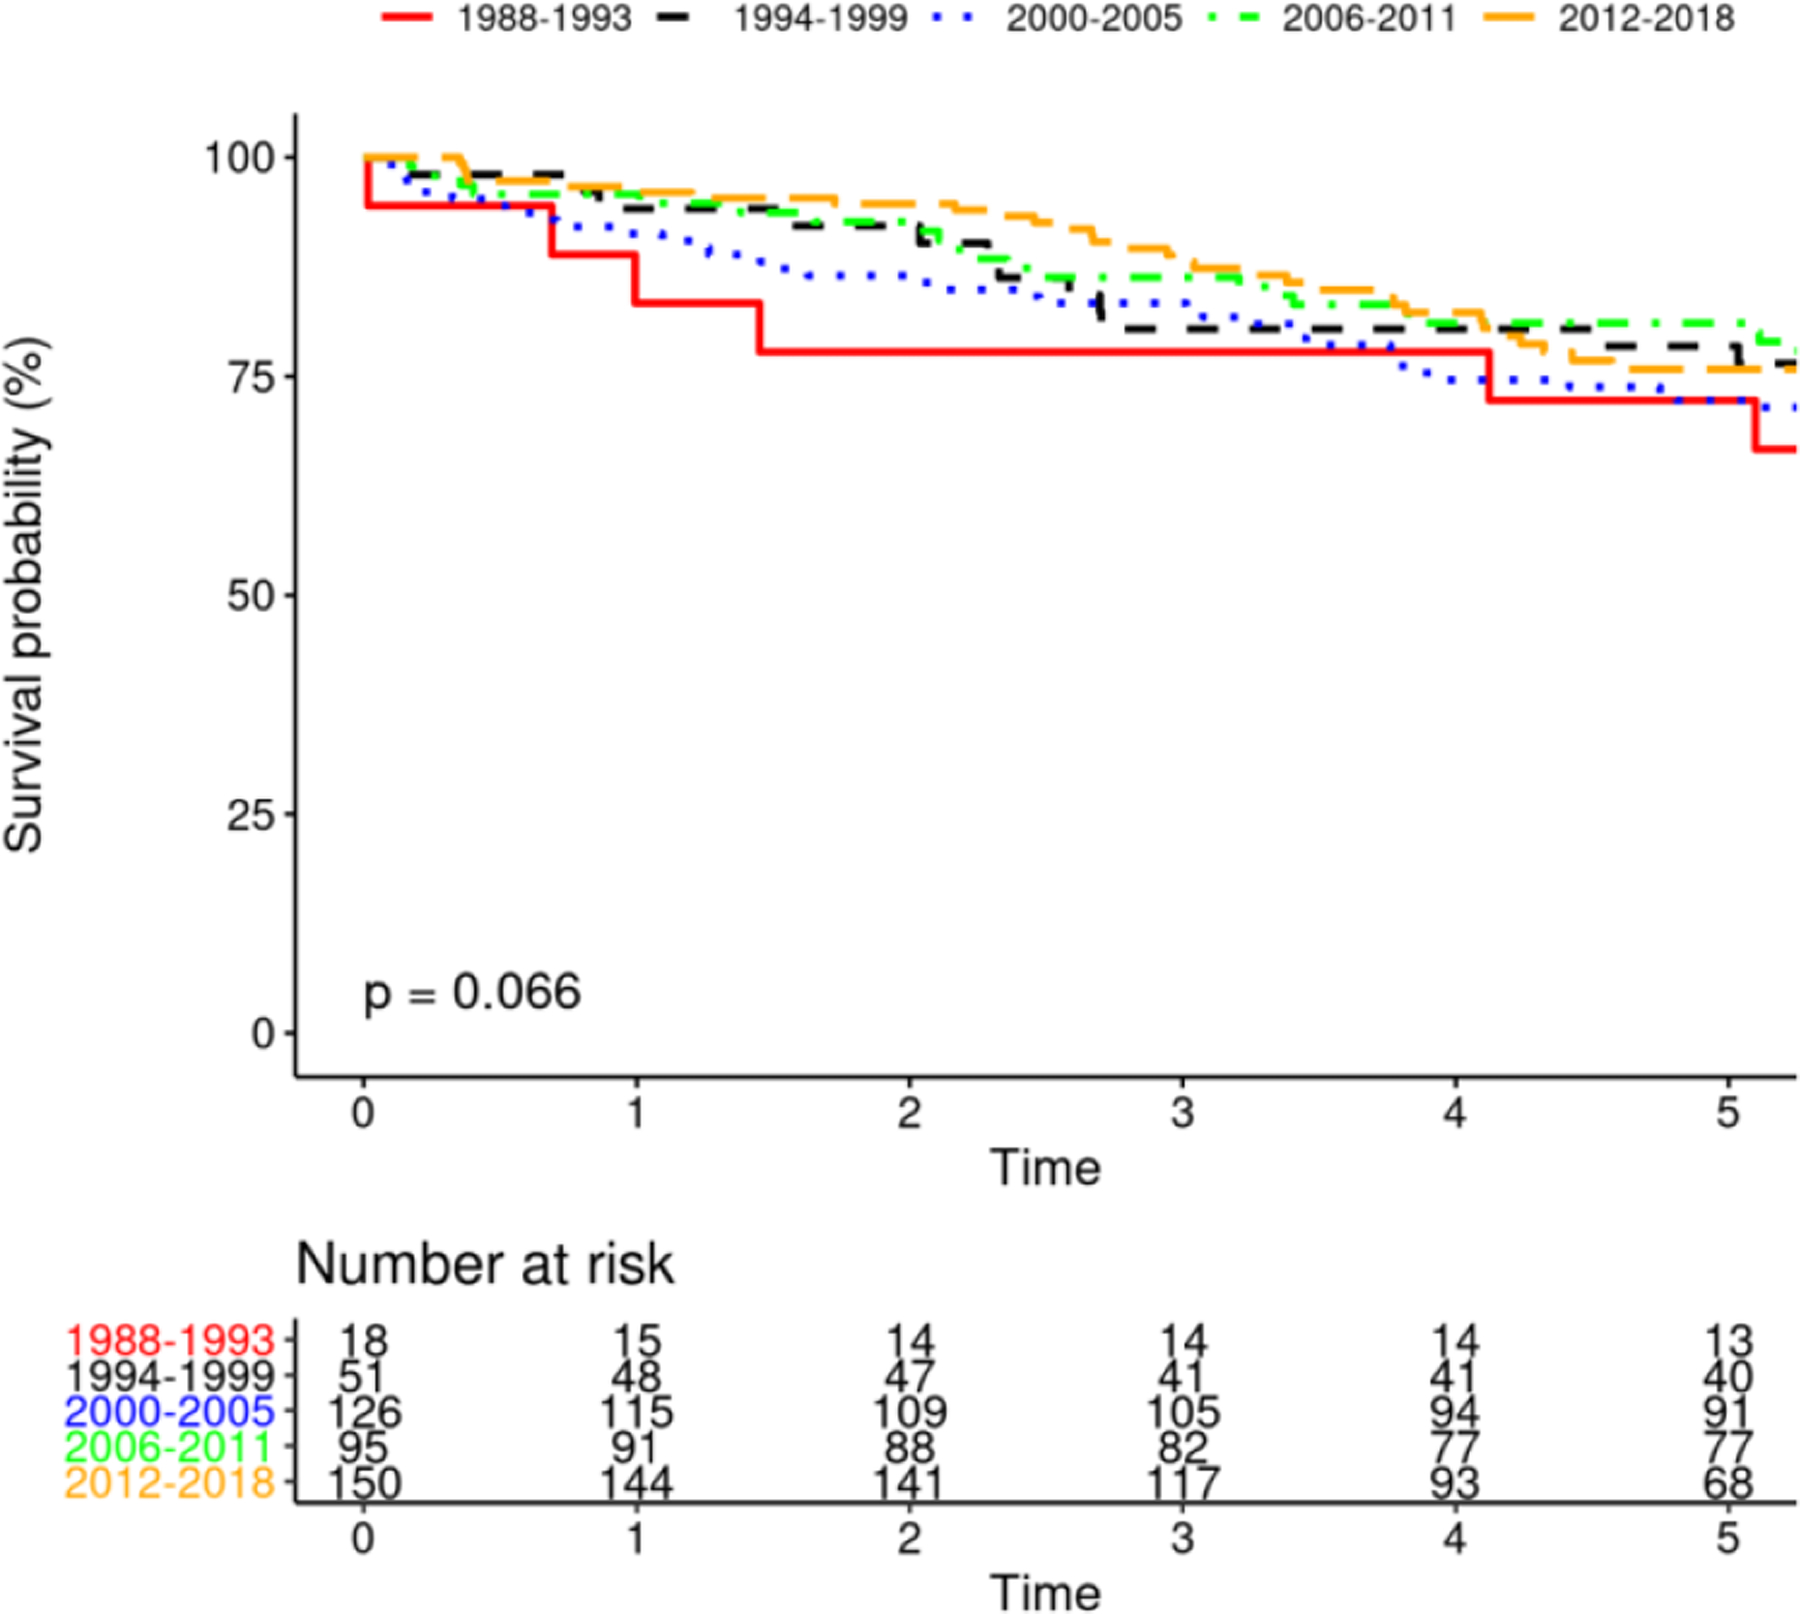
Mortality After Device Insertion
Gender differences in survival
Five-year survival among males receiving CIED was 68.7% (95% CI 66.3–71.0%), and among females was 66.0% (95% CI 63.2–68.9%), and there was no difference in survival after adjusting for age and Charlson comorbidity index (p=0.19, figure 4A). There were no differences in survival among males and females receiving PPM, ICD or CRT (figures 4B-D).
FIGURE 4.
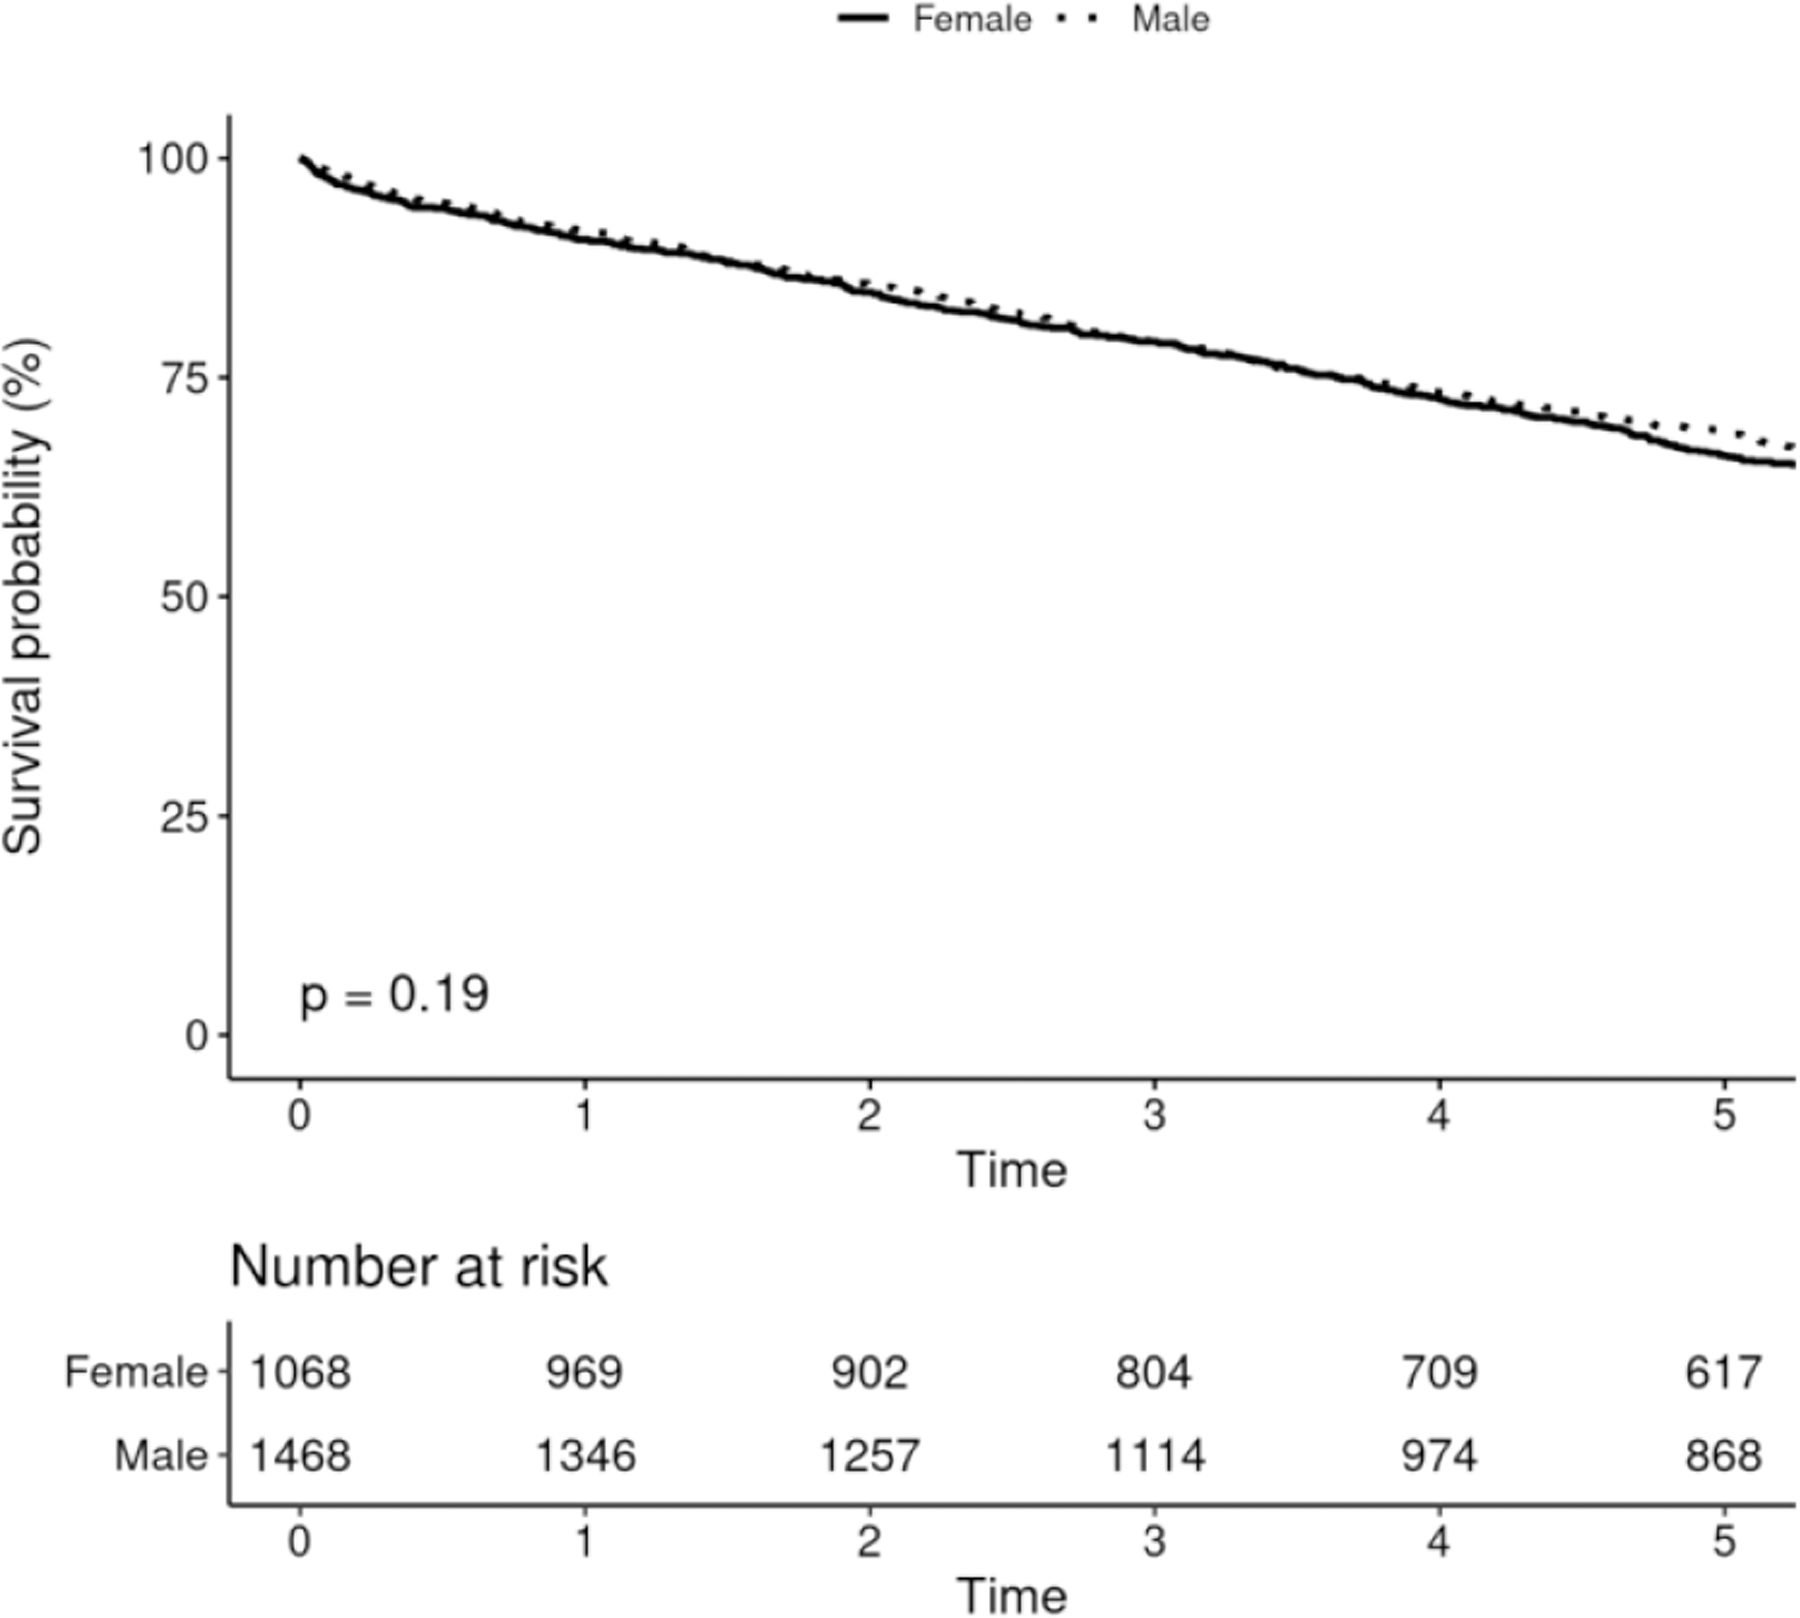
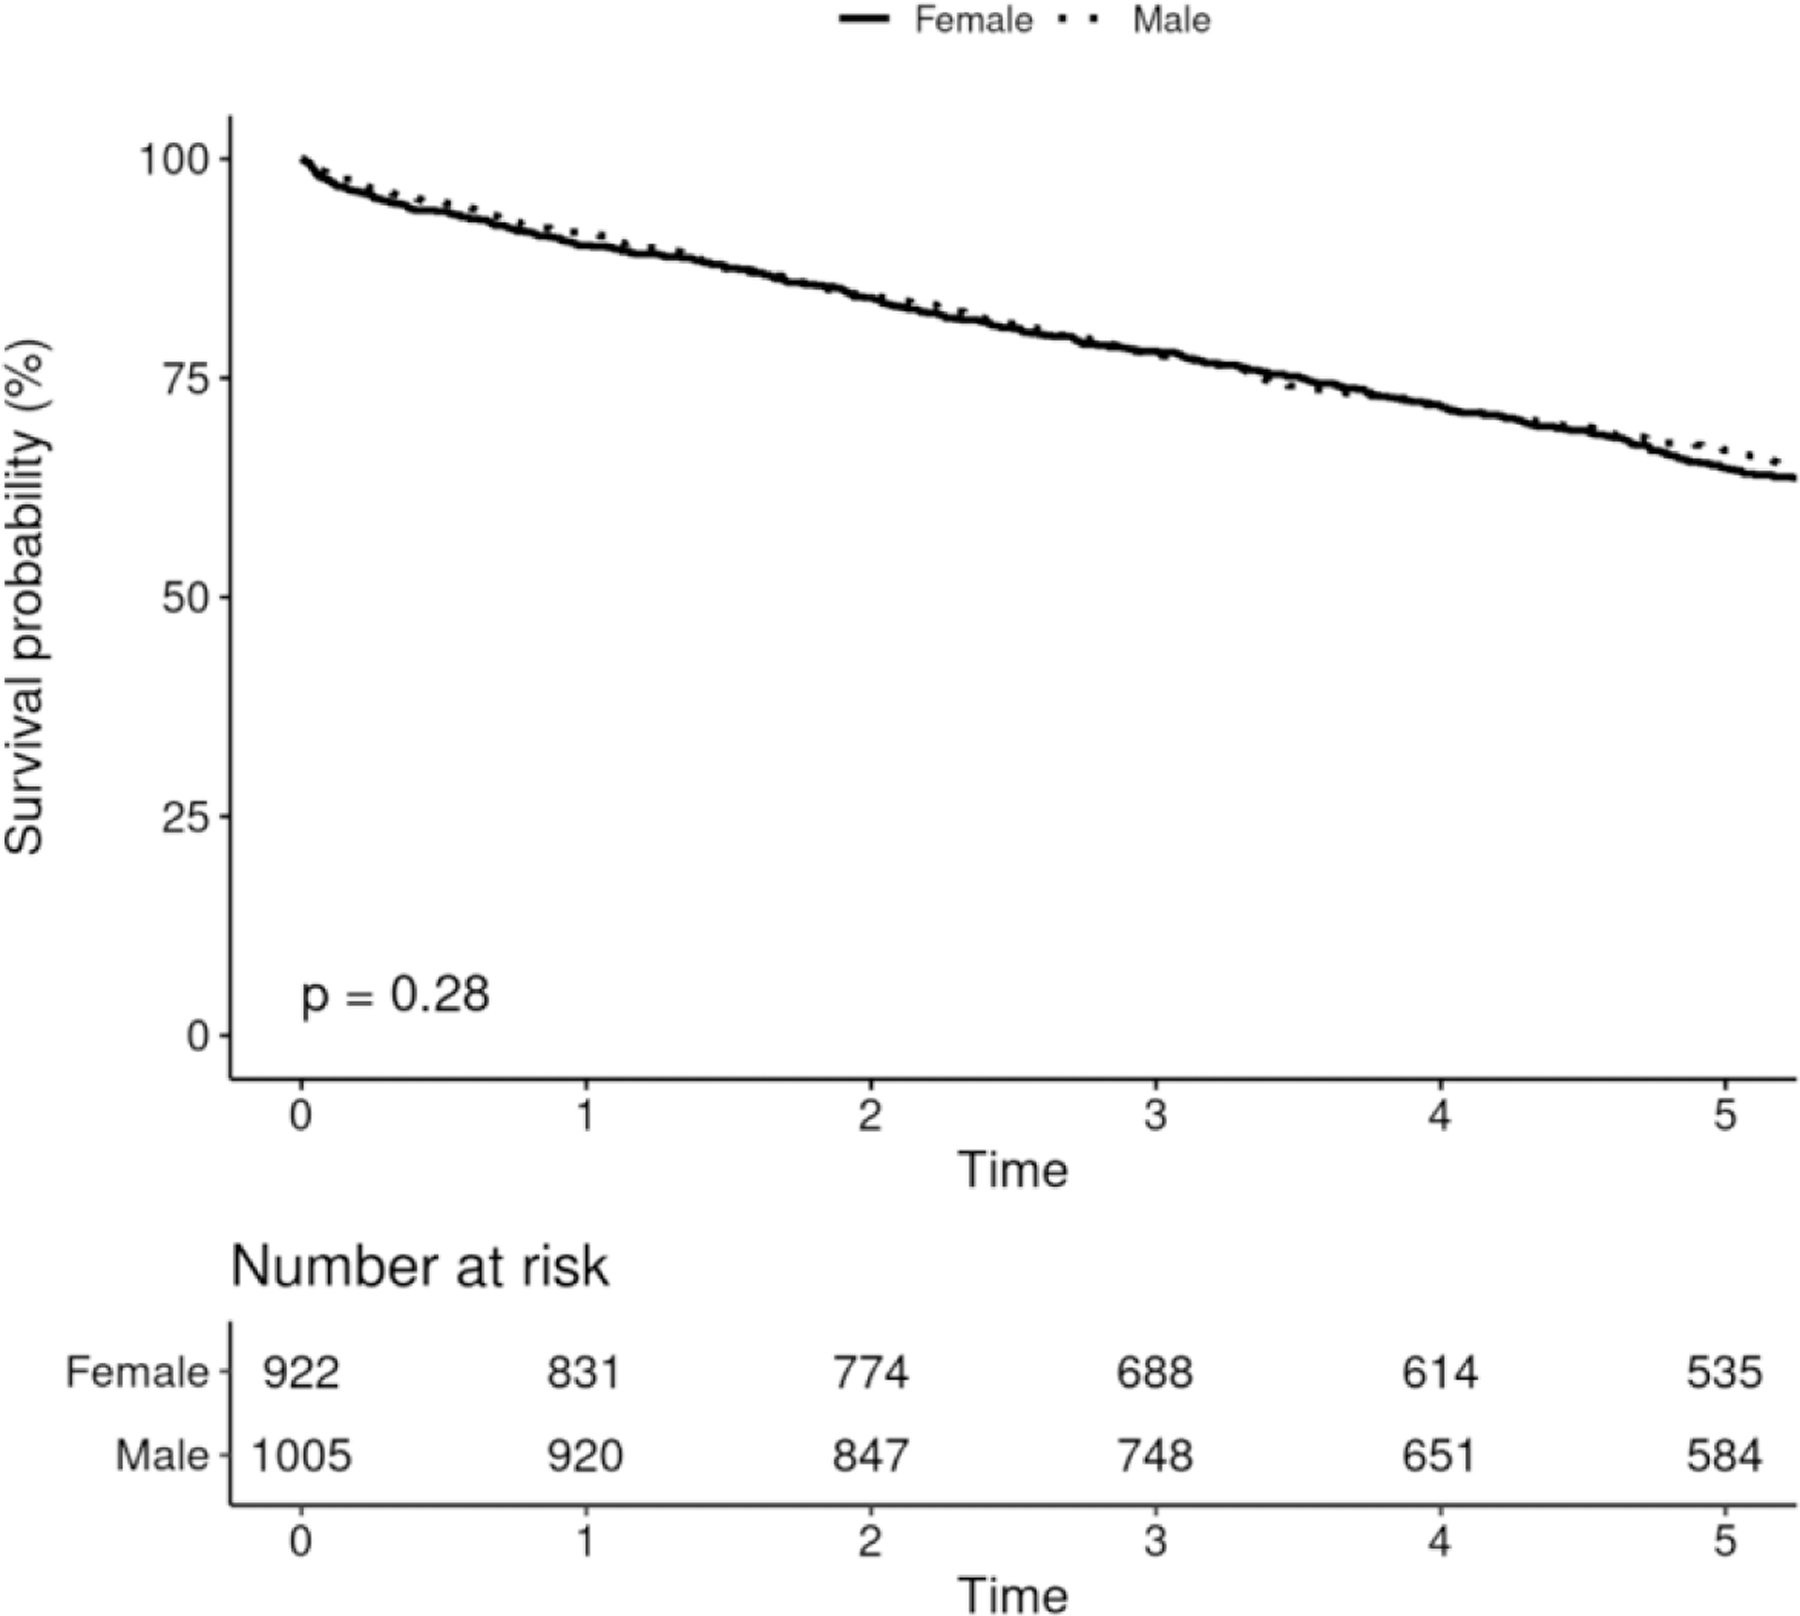
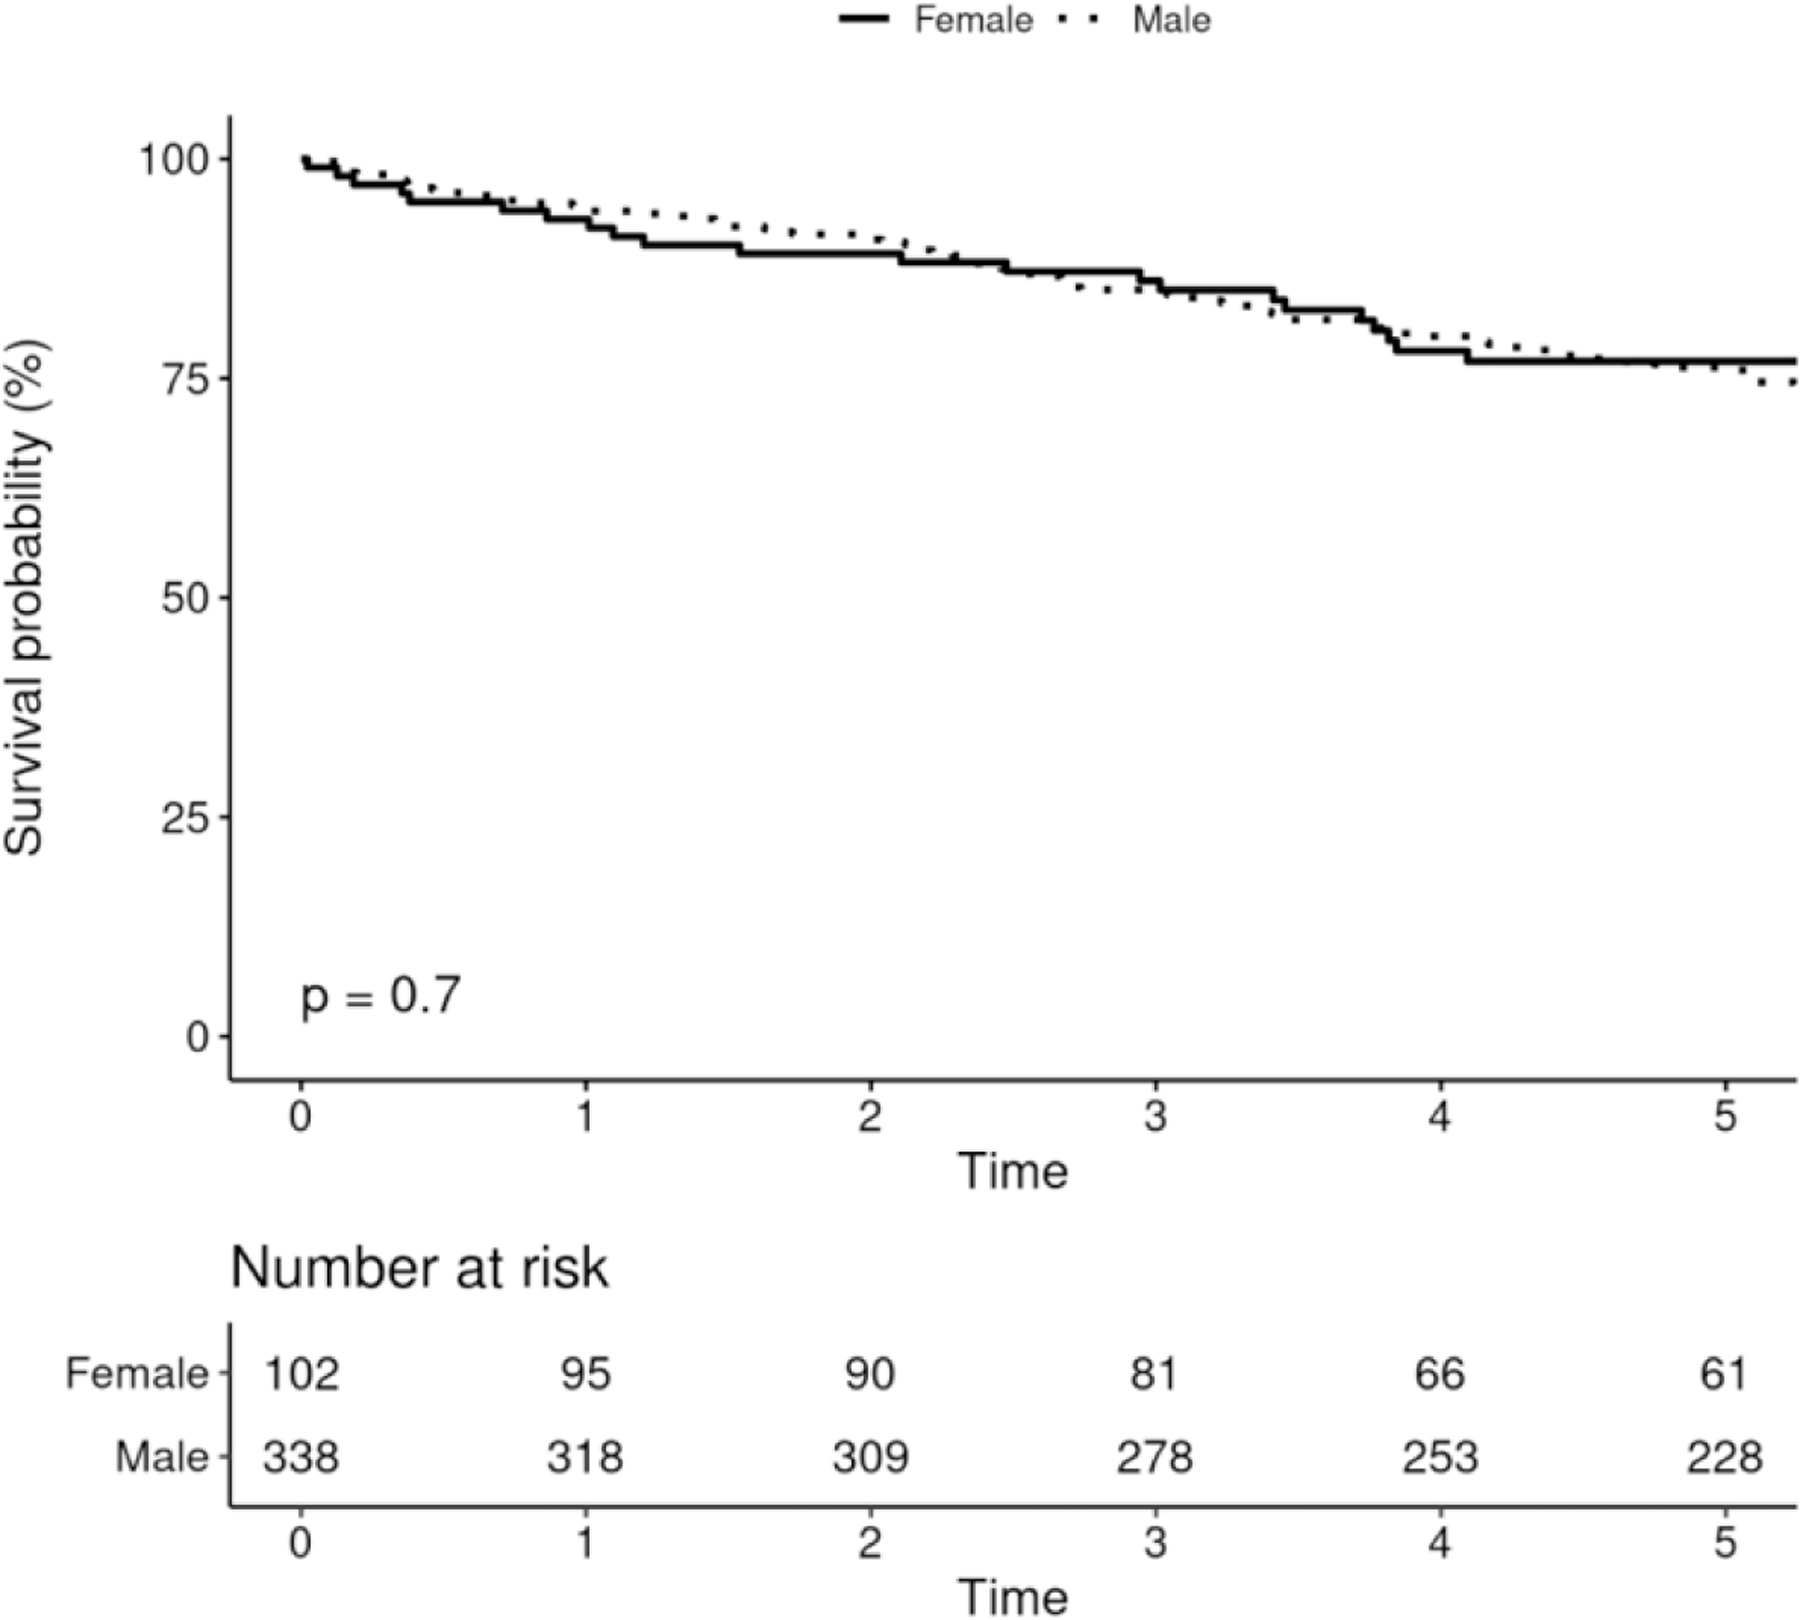
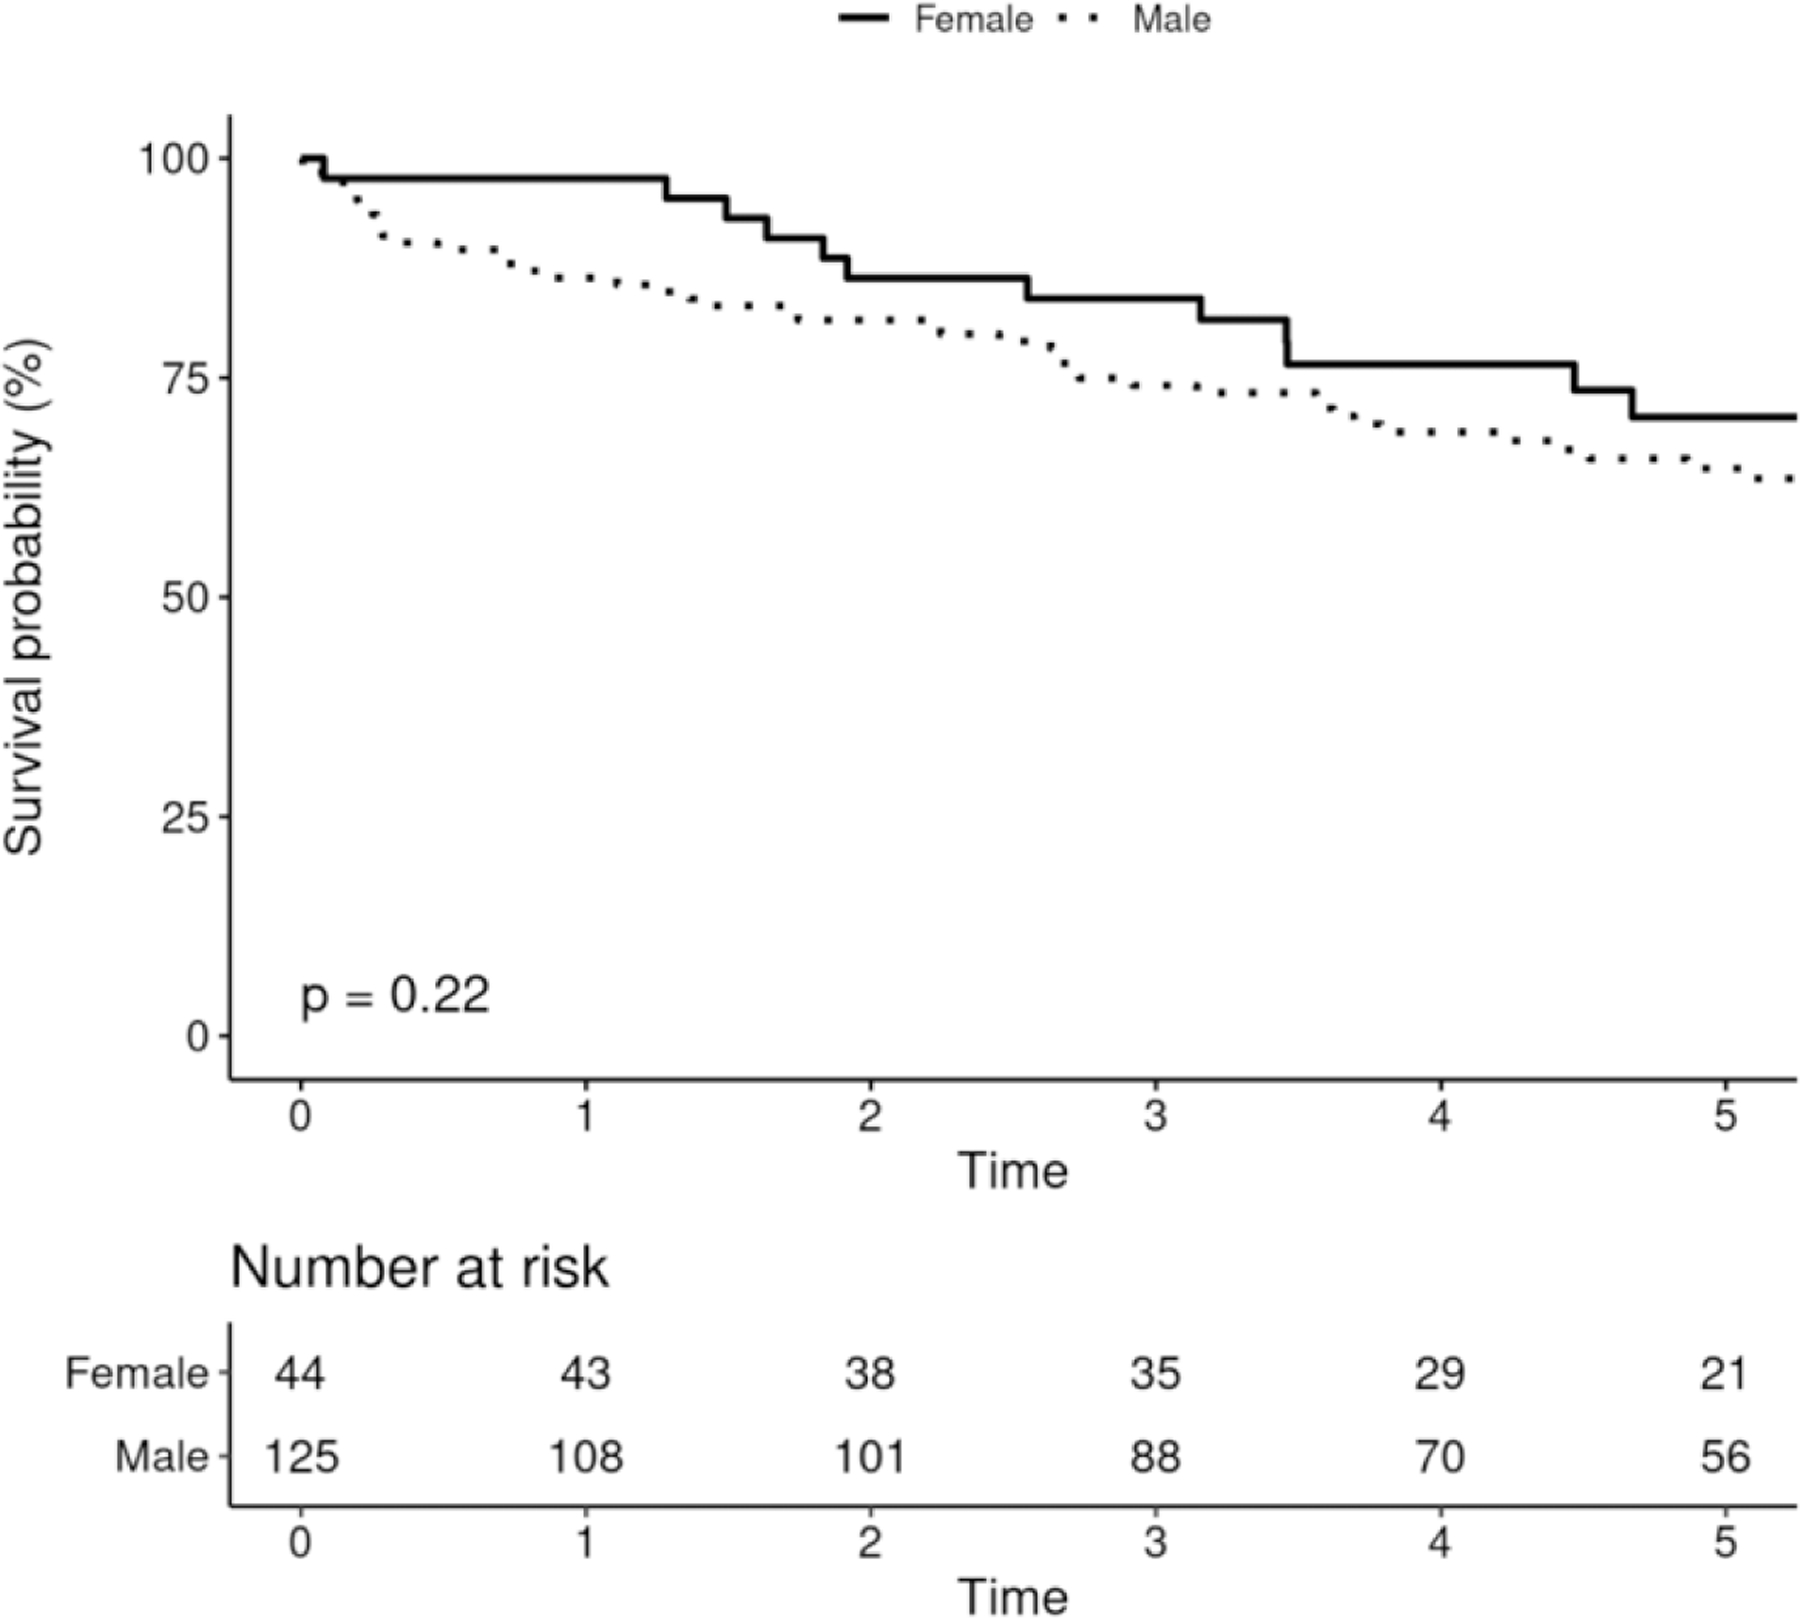
Survival After Device Implantation by Sex
Discussion:
Using a large population-based records-linkage study, we describe trends in the epidemiology of CIED implantation. Our principal findings are (1) PPM remains the most commonly implanted device, comprising 76.0% of initial device implants, followed by ICD (17.4%) and CRT (6.7%). (2) After 2005, the incidence of overall CIED implantation is decreasing, driven by reduced incidence of PPM and ICD implantation. (3) However, the incidence of CRT implantation, both initial implantation, and upgrade of PPM or ICD to CRT is increasing. The incidence of CRT-P and CRT-D implantation are both increased. (4) The incidence of CIED implantation increases notably with increasing age. (5) Gender disparity in CIED implantation is marked and continues to be present, with the incidence of overall CIED implantation twice as high in men than in women. (6) Overall survival of CRT recipients has improved over time, while overall survival after PPM has worsened and remains unchanged for ICD recipients. (7) Finally, the overall comorbidities of patients receiving CIEDs have increased over time, especially among PPM and ICD recipients.
Trends in device implantation
The incidence of CIED implantations in Olmsted County increased significantly between 1988 and 2005. Following FDA approval of cardiac resynchronization therapy devices in 2001, an immediate increase in the incidence of CRT implantation was reported (7). Several previously conducted studies, which collected data from administrative sources, surveys, and national registries, observed a similar increase in CIED implant incidence during this time period (1, 7, 14).
Our data demonstrate that the substantial increase in CIED implantation until 2005 was, however, followed by an overall decline until 2015 by around 20%. The overall implantation rate in 2012–2015 was still 50% greater than 1988–1993. The decrease in CIED implant incidence was driven by a reduction in PPM and ICD implant rates between 2000–05 and 2012–15. The incidence of CRT implantation actually increased during the same period, but did not change the overall trend of reduction in CIED implantation rates.
These observations are consistent with multiple studies utilizing the nationwide inpatient sample datasets that have reported on CIED implantation rates since 2005 (9, 13, 18, 19). However, NIS methodology does not allow for estimation of device implantation in the outpatient setting or a direct population-based analysis of the incidence of device implantation. Our data from a population-based records-linkage study demonstrate that in the contemporary era, the incidence of CIED implantation, especially PPM and ICD implantation is decreasing.
The reasons for the decline in contemporary PPM/ICD implantation rates are not clear from our study. It is possible that because indications for PPM/ICD grew so rapidly in decades prior, a “saturation point” was eventually reached, such as ICD for primary prevention, where the number of patients newly eligible for these implants began to diminish. It is also possible that improvements in medical therapy of heart failure with reduced ejection fraction have decreased the requirement for ICD implantation. Finally, penalties imposed for inappropriate ICD usage could have contributed to the decline in ICD implantation (20). Potential contributors to the increase in CRT de-novo implantation and upgrades over time could be expanded indications for CRT implantation in patients with right ventricular pacing-induced cardiomyopathy, high expected percentage of right ventricular pacing (Biventricular Versus Right Ventricular Pacing in Heart Failure Patients With Atrioventricular Block - BLOCK-HF study) and observational data supporting the safety and efficacy of CRT upgrade in patients with previous PPM or ICD implantation (21–25).
The clinical implications of a decline in CIED implantation incidence are multiple. These include estimation of the expected device volumes in the community, which can aid health care policy planning. These data also support that training of new electrophysiologists should focus on not only PPM and ICD de-novo implantation, but also on CRT implantation, including techniques for device upgrades. Electrophysiologists should also emphasize training on the follow-up of devices, including device troubleshooting and extraction.
Age at device implantation
The mean age at PPM implantation was consistent with previously reported real-world data; while the mean age at ICD and CRT implantation was only slightly older than patients enrolled in randomized clinical studies (mean age at ICD implantation: 63.1 vs. 60 years in SCD-HeFT; mean age at CRT implantation; 69.4 vs 65 years in MADIT-CRT) (9, 26, 27). CIED implantation incidence increased significantly with age, as well as the implantation incidence of any of the three device types individually, which has been shown previously (28, 29). However, the incidence of CIED implantation for the overall population was greatest in markedly older individuals (90–99 years for PPM, 70–79 years for ICD, and 80–89 years for CRT). Our data describe contemporary practice patterns of CIED implantation, where the incidence of device implantation is greatest among the elderly.
Gender disparity in device implantation
We observed a large gender disparity in the incidence of any CIED implants, with males twice as likely to receive a device than females. These findings are consistent with gender disparity in CIED clinical trial enrollment.(27, 30) The reasons behind the marked gender disparities in CIED implantation are unclear from our study. These findings could represent differences in the epidemiology of heart disease between men and women, physician referral bias, or patient preferences. Heart failure with reduced ejection fraction or with antecedent myocardial infarction, for which ICD and CRT implantation can be indicated, is more common in men compared to women (31–33). Another possibility is that criteria for ICD implantation may be more stringently followed in women compared with men, although this was not demonstrated in a previous National Cardiovascular Data Registry (NCDR) study (34). Under-referral for device implantation in women is another possible reason, with one study demonstrating that among hospitalized patients with heart failure, women were less likely than men to receive ICD implantation (35). Further studies are required to understand the reasons for the marked gender disparity in CIED implantation.
Comorbidities among patients with device implantation
The Charlson comorbidity index is derived from multiple risk factors that predict 1-year survival and can be used as a surrogate for comorbidity of a particular case mix (1, 36). Our data demonstrate that CIEDs continue to be implanted in patients with increasing comorbidities, consistent with previous data from the Rochester Epidemiology project as well as reports from other data sources (1, 9).
Survival after device implantation
Temporal changes in survival after CIED implantation have not been well elucidated before the current study. We report that the survival of ICD recipients has not changed significantly over the three decades, and that survival after PPM implantation has actually worsened after 1988–1993. The reasons for the lack of improvement are not clear from our study but may indicate a ceiling effect of the expected benefit from PPM and ICD implantation. Comorbidities of patients receiving PPM and ICD has increased over time, as evident from the increase in the Charlson Comorbidity index and may be contributing to the reduction of survival in PPM patients. However, the survival of CRT patients has improved, even after adjustment for comorbidities. This finding may reflect an improvement in the medical management of these patients including pharmacological advances in guideline-directed medical therapy and developments in mechanical circulatory support for heart failure including remote monitoring of fluid status via implanted devices.
Finally, despite adjustment for age and comorbidities, women have similar survival rates after CIED implantation, consistent with prior observational data (38). Our data suggest that women benefit equally from CIED implantation, despite being less likely to receive CIED implantation.
Limitations:
Demographic disparities in device implantation highlight a potential limitation of our patient population, which is relatively ethnically homogeneous, especially among the elderly. Prior studies have indicated that the REP data could be generalized to a large proportion of the United States population (39). However, our data may not be generalizable to populations with a higher proportion of ethnic minorities. We were also limited by the use of ICD codes for CIED implantation. However, the number of CIED implantations is consistent with previous REP studies with manual verification of all implantations, and all device upgrades were manually verified for the current study (40).
Although our data is population-based, all CIED related care during majority of the study period was provided by a single large tertiary care center, which may have different practice patterns compared to community-based practices. However, when comparing our findings to a large study from another data source, the incidence of PPM implantation was almost identical (62.8 per 100,000 in our study and 61.6 per 100,000 in the other) (9).
Initial indications for device implantation are not available, and we were unable to analyze any changes in implant indications over time. Data regarding primary vs. secondary prevention ICD implantation are currently unavailable.
Conclusions:
The incidence of pacemaker and defibrillator implants is decreasing, while the incidence of CRT implantation is increasing. Further study is necessary to understand the causes and implications of these trends. CIED implantation incidence is highest in the elderly, and these devices are implanted in increasingly comorbid patients. Women are far less likely than men to receive CIED implantation, despite similar rates of survival after device implantation. The overall mortality after device implantation remains high, although survival is improving among patients with CRT.
Supplementary Material
Perspectives:
Clinical Competencies:
Medical Knowledge:
There exists a knowledge gap in the recent trends of CIED implants. The incidence of pacemaker and defibrillator implants is decreasing. The overall mortality after device implantation remains high, although survival is improving among patients with CRT.
Patient Care:
The clinical implications of a decline in CIED implantation incidence are multiple. These include estimation of the expected device volumes in the community, which can aid health care policy planning. These data also support that training of new electrophysiologists should focus on not only PPM and ICD de-novo implantation, but also CRT implantation, including techniques for device upgrades.
Translational Outlook 1:
Further studies would be needed to understand the cause and implications of the trends in CIED implants.
Translational Outlook 2:
Techniques to help improve CRT implant success, and conduction system pacing will need to be continually investigated to improve clinical outcomes.
Acknowledgments
This study was made possible using the resources of the Rochester Epidemiology Project, which is supported by the National Institute on Aging of the National Institutes of Health under Award Number R01AG034676. The content is solely the responsibility of the authors and does not necessarily represent the official views of the National Institutes of Health. The study was supported by funding from the Department of Cardiovascular Disease, Mayo Clinic, Rochester, MN.
Abbreviations:
- CIED
Cardiac Implantable Electronic Devices
- ICD
Implantable Cardioverter-Defibrillator
- PPM
Permanent Pacemaker
- CRT
Cardiac Resynchronization Therapy
- CRT-P
Cardiac Resynchronization Therapy – Pacemaker
- CRT-D
Cardiac Resynchronization Therapy – Defibrillator
- FDA
Food and Drug Administration
- REP
Rochester Epidemiology Project
- ICD-9/10
International Classification Of Diseases 9th /10th Revision
- CPT
Current Procedural Terminology
- NIS
National Inpatient Sample
- NCDR
National Cardiovascular Data Registry
Footnotes
Publisher's Disclaimer: This is a PDF file of an unedited manuscript that has been accepted for publication. As a service to our customers we are providing this early version of the manuscript. The manuscript will undergo copyediting, typesetting, and review of the resulting proof before it is published in its final form. Please note that during the production process errors may be discovered which could affect the content, and all legal disclaimers that apply to the journal pertain.
References:
- 1.Uslan DZ, Tleyjeh IM, Baddour LM, Friedman PA, Jenkins SM, St Sauver JL, et al. Temporal trends in permanent pacemaker implantation: a population-based study. Am Heart J 2008;155(5):896–903. [DOI] [PMC free article] [PubMed] [Google Scholar]
- 2.Merriam JA, Rajendra AB, Gold MR. Newer Indications for ICD and CRT. Cardiol Clin 2014;32(2):181–90. [DOI] [PubMed] [Google Scholar]
- 3.Hussein AA, Wilkoff BL. Cardiac Implantable Electronic Device Therapy in Heart Failure. Circ Res 2019;124(11):1584–97. [DOI] [PubMed] [Google Scholar]
- 4.Das M Indications for ICD and cardiac resynchronization therapy for prevention of sudden cardiac death. Expert Rev Cardiovasc Ther 2009;7(2):181–95. [DOI] [PubMed] [Google Scholar]
- 5.Atreya AR, Cook JR, Lindenauer PK. Complications arising from cardiac implantable electrophysiological devices: review of epidemiology, pathogenesis and prevention for the clinician. Postgrad Med 2016;128(2):223–30. [DOI] [PubMed] [Google Scholar]
- 6.Shen WK, Hammill SC, Hayes DL, Packer DL, Bailey KR, Ballard DJ, et al. Long-term survival after pacemaker implantation for heart block in patients > or = 65 years. Am J Cardiol 1994;74(6):560–4. [DOI] [PubMed] [Google Scholar]
- 7.Zhan C, Baine WB, Sedrakyan A, Steiner C. Cardiac device implantation in the United States from 1997 through 2004: a population-based analysis. J Gen Intern Med 2008;23 Suppl 1:13–9. [DOI] [PMC free article] [PubMed] [Google Scholar]
- 8.Cleland JG, Daubert JC, Erdmann E, Freemantle N, Gras D, Kappenberger L, et al. The effect of cardiac resynchronization on morbidity and mortality in heart failure. N Engl J Med 2005;352(15):1539–49. [DOI] [PubMed] [Google Scholar]
- 9.Greenspon AJ, Patel JD, Lau E, Ochoa JA, Frisch DR, Ho RT, et al. Trends in permanent pacemaker implantation in the United States from 1993 to 2009: increasing complexity of patients and procedures. J Am Coll Cardiol 2012;60(16):1540–5. [DOI] [PubMed] [Google Scholar]
- 10.Goldberger Z, Lampert R. Implantable cardioverter-defibrillators: expanding indications and technologies. JAMA 2006;295(7):809–18. [DOI] [PubMed] [Google Scholar]
- 11.Mond HG, Proclemer A. The 11th world survey of cardiac pacing and implantable cardioverter-defibrillators: calendar year 2009--a World Society of Arrhythmia’s project. Pacing Clin Electrophysiol 2011;34(8):1013–27. [DOI] [PubMed] [Google Scholar]
- 12.Munir MB, Alqahtani F, Aljohani S, Bhirud A, Modi S, Alkhouli M. Trends and predictors of implantable cardioverter defibrillator implantation after sudden cardiac arrest: Insight from the national inpatient sample. Pacing Clin Electrophysiol 2018;41(3):229–37. [DOI] [PubMed] [Google Scholar]
- 13.Patel NJ, Edla S, Deshmukh A, Nalluri N, Patel N, Agnihotri K, et al. Gender, Racial, and Health Insurance Differences in the Trend of Implantable Cardioverter-Defibrillator (ICD) Utilization: A United States Experience Over the Last Decade. Clin Cardiol 2016;39(2):63–71. [DOI] [PMC free article] [PubMed] [Google Scholar]
- 14.Bernstein AD, Parsonnet V. Survey of cardiac pacing and implanted defibrillator practice patterns in the United States in 1997. Pacing Clin Electrophysiol 2001;24(5):842–55. [DOI] [PubMed] [Google Scholar]
- 15.Silverman BG, Gross TP, Kaczmarek RG, Hamilton P, Hamburger S. The epidemiology of pacemaker implantation in the United States. Public Health Rep 1995;110(1):42–6. [PMC free article] [PubMed] [Google Scholar]
- 16.Attanasio P, Lacour P, Ernert A, Pieske B, Haverkamp W, Blaschke F, et al. Cardiac device implantations in obese patients: Success rates and complications. Clin Cardiol 2017;40(4):230–4. [DOI] [PMC free article] [PubMed] [Google Scholar]
- 17.Rocca WA, Yawn BP, St Sauver JL, Grossardt BR, Melton LJ 3rd, History of the Rochester Epidemiology Project: half a century of medical records linkage in a US population. Mayo Clin Proc 2012;87(12):1202–13. [DOI] [PMC free article] [PubMed] [Google Scholar]
- 18.Guha A, Xiang X, Haddad D, Buck B, Gao X, Dunleavy M, et al. Eleven-year trends of inpatient pacemaker implantation in patients diagnosed with sick sinus syndrome. J Cardiovasc Electrophysiol 2017;28(8):933–43. [DOI] [PMC free article] [PubMed] [Google Scholar]
- 19.Lindvall C, Chatterjee NA, Chang Y, Chernack B, Jackson VA, Singh JP, et al. National Trends in the Use of Cardiac Resynchronization Therapy With or Without Implantable Cardioverter-Defibrillator. Circulation 2016;133(3):273–81. [DOI] [PMC free article] [PubMed] [Google Scholar]
- 20.Steinberg JS, Mittal S. The federal audit of implantable cardioverter-defibrillator implants: lessons learned. J Am Coll Cardiol 2012;59(14):1270–4. [DOI] [PubMed] [Google Scholar]
- 21.Kosztin A, Vamos M, Aradi D, Schwertner WR, Kovacs A, Nagy KV, et al. De novo implantation vs. upgrade cardiac resynchronization therapy: a systematic review and meta-analysis. Heart Fail Rev 2018;23(1):15–26. [DOI] [PMC free article] [PubMed] [Google Scholar]
- 22.Essebag V, Joza J, Birnie DH, Sapp JL, Sterns LD, Philippon F, et al. Incidence, predictors, and procedural results of upgrade to resynchronization therapy: the RAFT upgrade substudy. Circ Arrhythm Electrophysiol 2015;8(1):152–8. [DOI] [PubMed] [Google Scholar]
- 23.Curtis AB, Worley SJ, Adamson PB, Chung ES, Niazi I, Sherfesee L, et al. Biventricular pacing for atrioventricular block and systolic dysfunction. N Engl J Med 2013;368(17):1585–93. [DOI] [PubMed] [Google Scholar]
- 24.Khurshid S, Obeng-Gyimah E, Supple GE, Schaller R, Lin D, Owens AT, et al. Reversal of Pacing-Induced Cardiomyopathy Following Cardiac Resynchronization Therapy. JACC Clin Electrophysiol 2018;4(2):168–77. [DOI] [PubMed] [Google Scholar]
- 25.Kiehl EL, Makki T, Kumar R, Gumber D, Kwon DH, Rickard JW, et al. Incidence and predictors of right ventricular pacing-induced cardiomyopathy in patients with complete atrioventricular block and preserved left ventricular systolic function. Heart Rhythm 2016;13(12):2272–8. [DOI] [PubMed] [Google Scholar]
- 26.Bardy GH, Lee KL, Mark DB, Poole JE, Packer DL, Boineau R, et al. Amiodarone or an implantable cardioverter-defibrillator for congestive heart failure. N Engl J Med 2005;352(3):225–37. [DOI] [PubMed] [Google Scholar]
- 27.Moss AJ, Hall WJ, Cannom DS, Klein H, Brown MW, Daubert JP, et al. Cardiac-resynchronization therapy for the prevention of heart-failure events. N Engl J Med 2009;361(14):1329–38. [DOI] [PubMed] [Google Scholar]
- 28.Daley WR, Kaczmarek RG. The epidemiology of cardiac pacemakers in the older US population. J Am Geriatr Soc 1998;46(8):1016–9. [DOI] [PubMed] [Google Scholar]
- 29.Gupta N, Kiley ML, Anthony F, Young C, Brar S, Kwaku K. Multi-Center, Community-Based Cardiac Implantable Electronic Devices Registry: Population, Device Utilization, and Outcomes. J Am Heart Assoc 2016;5(3):e002798. [DOI] [PMC free article] [PubMed] [Google Scholar]
- 30.Moss AJ, Zareba W, Hall WJ, Klein H, Wilber DJ, Cannom DS, et al. Prophylactic implantation of a defibrillator in patients with myocardial infarction and reduced ejection fraction. N Engl J Med 2002;346(12):877–83. [DOI] [PubMed] [Google Scholar]
- 31.Lloyd-Jones DM, Larson MG, Leip EP, Beiser A, D’Agostino RB, Kannel WB, et al. Lifetime risk for developing congestive heart failure: the Framingham Heart Study. Circulation 2002;106(24):3068–72. [DOI] [PubMed] [Google Scholar]
- 32.Brouwers FP, de Boer RA, van der Harst P, Voors AA, Gansevoort RT, Bakker SJ, et al. Incidence and epidemiology of new onset heart failure with preserved vs. reduced ejection fraction in a community-based cohort: 11-year follow-up of PREVEND. Eur Heart J 2013;34(19):1424–31. [DOI] [PubMed] [Google Scholar]
- 33.Redfield MM, Jacobsen SJ, Burnett JC Jr., Mahoney DW, Bailey KR, Rodeheffer RJ Burden of systolic and diastolic ventricular dysfunction in the community: appreciating the scope of the heart failure epidemic. JAMA 2003;289(2):194–202. [DOI] [PubMed] [Google Scholar]
- 34.Daugherty SL, Peterson PN, Wang Y, Curtis JP, Heidenreich PA, Lindenfeld J, et al. Use of implantable cardioverter defibrillators for primary prevention in the community: do women and men equally meet trial enrollment criteria? Am Heart J 2009;158(2):224–9. [DOI] [PubMed] [Google Scholar]
- 35.Hernandez AF, Fonarow GC, Liang L, Al-Khatib SM, Curtis LH, LaBresh KA, et al. Sex and racial differences in the use of implantable cardioverter-defibrillators among patients hospitalized with heart failure. JAMA 2007;298(13):1525–32. [DOI] [PubMed] [Google Scholar]
- 36.Charlson ME, Pompei P, Ales KL, MacKenzie CR. A new method of classifying prognostic comorbidity in longitudinal studies: development and validation. J Chronic Dis 1987;40(5):373–83. [DOI] [PubMed] [Google Scholar]
- 37.Hawkins NM, Grubisic M, Andrade JG, Huang F, Ding L, Gao M, et al. Long-term complications, reoperations and survival following cardioverter-defibrillator implant. Heart 2018;104(3):237–43. [DOI] [PubMed] [Google Scholar]
- 38.Varma N, Mittal S, Prillinger JB, Snell J, Dalal N, Piccini JP. Survival in Women Versus Men Following Implantation of Pacemakers, Defibrillators, and Cardiac Resynchronization Therapy Devices in a Large, Nationwide Cohort. J Am Heart Assoc 2017;6(5). [DOI] [PMC free article] [PubMed] [Google Scholar]
- 39.St Sauver JL, Grossardt BR, Leibson CL, Yawn BP, Melton LJ 3rd, Rocca WA Generalizability of epidemiological findings and public health decisions: an illustration from the Rochester Epidemiology Project. Mayo Clin Proc 2012;87(2):151–60. [DOI] [PMC free article] [PubMed] [Google Scholar]
- 40.Lin G, Meverden RA, Hodge DO, Uslan DZ, Hayes DL, Brady PA. Age and gender trends in implantable cardioverter defibrillator utilization: a population based study. J Interv Card Electrophysiol 2008;22(1):65–70. [DOI] [PMC free article] [PubMed] [Google Scholar]
Associated Data
This section collects any data citations, data availability statements, or supplementary materials included in this article.


