Abstract
Evasion of anti-tumor immunity and resistance to therapies in solid tumors are aided by immune-suppressive tumor microenvironment (TME). We found that TME factors such as regulatory T cells and adenosine downregulated type I interferons (IFN1) receptor IFNAR1 on CD8+ cytotoxic T lymphocytes (CTL). These events relied upon poly-ADP ribose polymerase-11 (PARP11), which was induced in the intratumoral CTL and acted as a key regulator of the immune suppressive TME. Ablation of PARP11 prevented loss of IFNAR1, increased CTL tumoricidal activity and inhibited tumor growth in an IFNAR1-dependent manner. Accordingly, genetic or pharmacologic inactivation of PARP11 augmented the therapeutic benefits of chimeric antigen receptor (CAR) T cells. CAR CTL engineered to inactivate PARP11 demonstrated a superior efficacy against solid tumors. These findings highlight the role of PARP11 in the immune suppressive TME and provide a proof of principle for targeting this pathway to optimize immune therapies.
Keywords: CD8+ T cells, chimeric antigen receptor, tumor, PARP11, ADP ribosylation, rucaparib, immune therapy, type I interferon, IFNAR1, adenosine, regulatory T cells
INTRODUCTION
In addition to relative paucity of specific tumor-derived antigens 1–3, the evasive strategies utilized in the tumor microenvironment (TME) by solid tumors are central to their ability to escape from immune surveillance and to resist immune therapies 4,5. Whereas novel therapeutic approaches have emerged to target diverse cellular or acellular TME components such as Treg or myeloid suppressive cells 6,7 or immune- suppressive cytokines and adenosine 8,9, the sheer redundancy of these factors hinders the progress of anti-cancer therapies 2,4,5,10. Clinical success of immune checkpoint inhibitors 11 highlights the benefits of approaches that involves identification and targeting of critical unifying mechanisms commonly deployed by diverse immune-suppressive elements to inactivate native or CAR-bearing CTL.
One facet of immune suppression encountered by CTL in the TME is linked to their deprivation of type I interferons (IFN1) 12. In the TME, IFN1 produced by malignant and benign cells elicit numerous paracrine and autocrine effects that significantly contribute to regulation of many aspects of immune surveillance (reviewed in 13,14). Moreover, responses to many types of anti-cancer treatments including chemo- and radiotherapy depend on the functional IFN1 pathway. Whereas expression of the IFN-stimulated genes in malignant cells may be associated with diminished anti-tumor immune responses and resistance to immune therapies 15, activities of CTL often rely on IFN1, which normally provide a “third signal” to support the clonal expansion of CD8+ T cells 16–18 and maintain the viability of these cells upon their activation 19.
However, in the intratumoral cells, the IFN1 pathway is inactivated because of downregulation of the IFNAR1 receptor chain, which is required for all cellular responses to IFN1 12,13. The TME stress and tumor-derived factors accelerate downregulation of IFNAR1 20–23 by stimulating its phosphorylation and recruitment of the β-TrCP-containing E3 ubiquitin ligase, which facilitates IFNAR1 ubiquitination, endocytosis and degradation (reviewed in 12). Whereas the levels of β-TrCP can be regulated by the Wnt pathway-driven mRNA stabilization 24 or protein stabilization dependent on the mono-ADP-ribosylation activity of PARP11 25, the mechanisms by which these processes are modulated in the TME and, specifically, in the intratumoral CTL remain poorly understood.
Deprived from the pro-survival effects of IFN1, activated intratumoral CTL rapidly die thereby vacating the immune-privileged niches inside the tumor 19. Accordingly, CTL and CAR T cells deficient in p38α kinase, which is critical for IFNAR1 phosphorylation and β-TrCP recruitment 26, or engineered to express a stabilized IFNAR1S526A receptor mutant (“SA” 21 survive better inside solid tumors. Inexplicably, these SA or p38-deficient CTL remain active against tumors despite the presence of immune-suppressive TME elements 19,27. Understanding the mechanisms underlying this paradox is important for designing approaches to reactivate the IFN1 pathway and to increase viability and activity of the intratumoral CTL.
Our current study demonstrates that downregulation of IFNAR1 on CTL is driven by the regulatory T cells (Tregs) and adenosine. This downregulation of IFNAR1 is required for suppression of the tumoricidal activities of CTL. PARP11, which is induced in the intratumoral CTL, plays a major role in IFNAR1 downregulation and inactivation of CTL. Accordingly, CAR T cells engineered to downregulate PARP11 or combined with a pharmacologic inhibitor displayed an increased anti-tumor activity in vivo.
RESULTS
Downregulation of IFNAR1 on CTL undermines their activities
We posited that IFNAR1 inactivation enables the cellular and acellular elements of the TME to suppress tumoricidal activities of CTL. To test this hypothesis, we interrogated gene expression in the intratumoral WT or SA CTL at a single cell level. CTL isolated from tumors growing in the knock-in SA mice (Fig S1A) indeed expressed greater levels of IFNAR1 (Fig 1A) and, when profiled for gene expression (Fig 1B, S1B), exhibited increased IFN signatures (Fig 1C–D) compared to WT intratumoral CTL. Furthermore, downregulation of IFNAR1 in WT CTL was associated with diminished polyfunctional memory and effector signatures (Fig 1D), increased expression of exhaustion-related genes (Fig 1E) and decreased cytotoxic and activated CTL gene expression pattern (Fig 1F–G, S1C).
Figure 1. Downregulation of IFNAR1 on the intratumoral CTL undermines their activities.
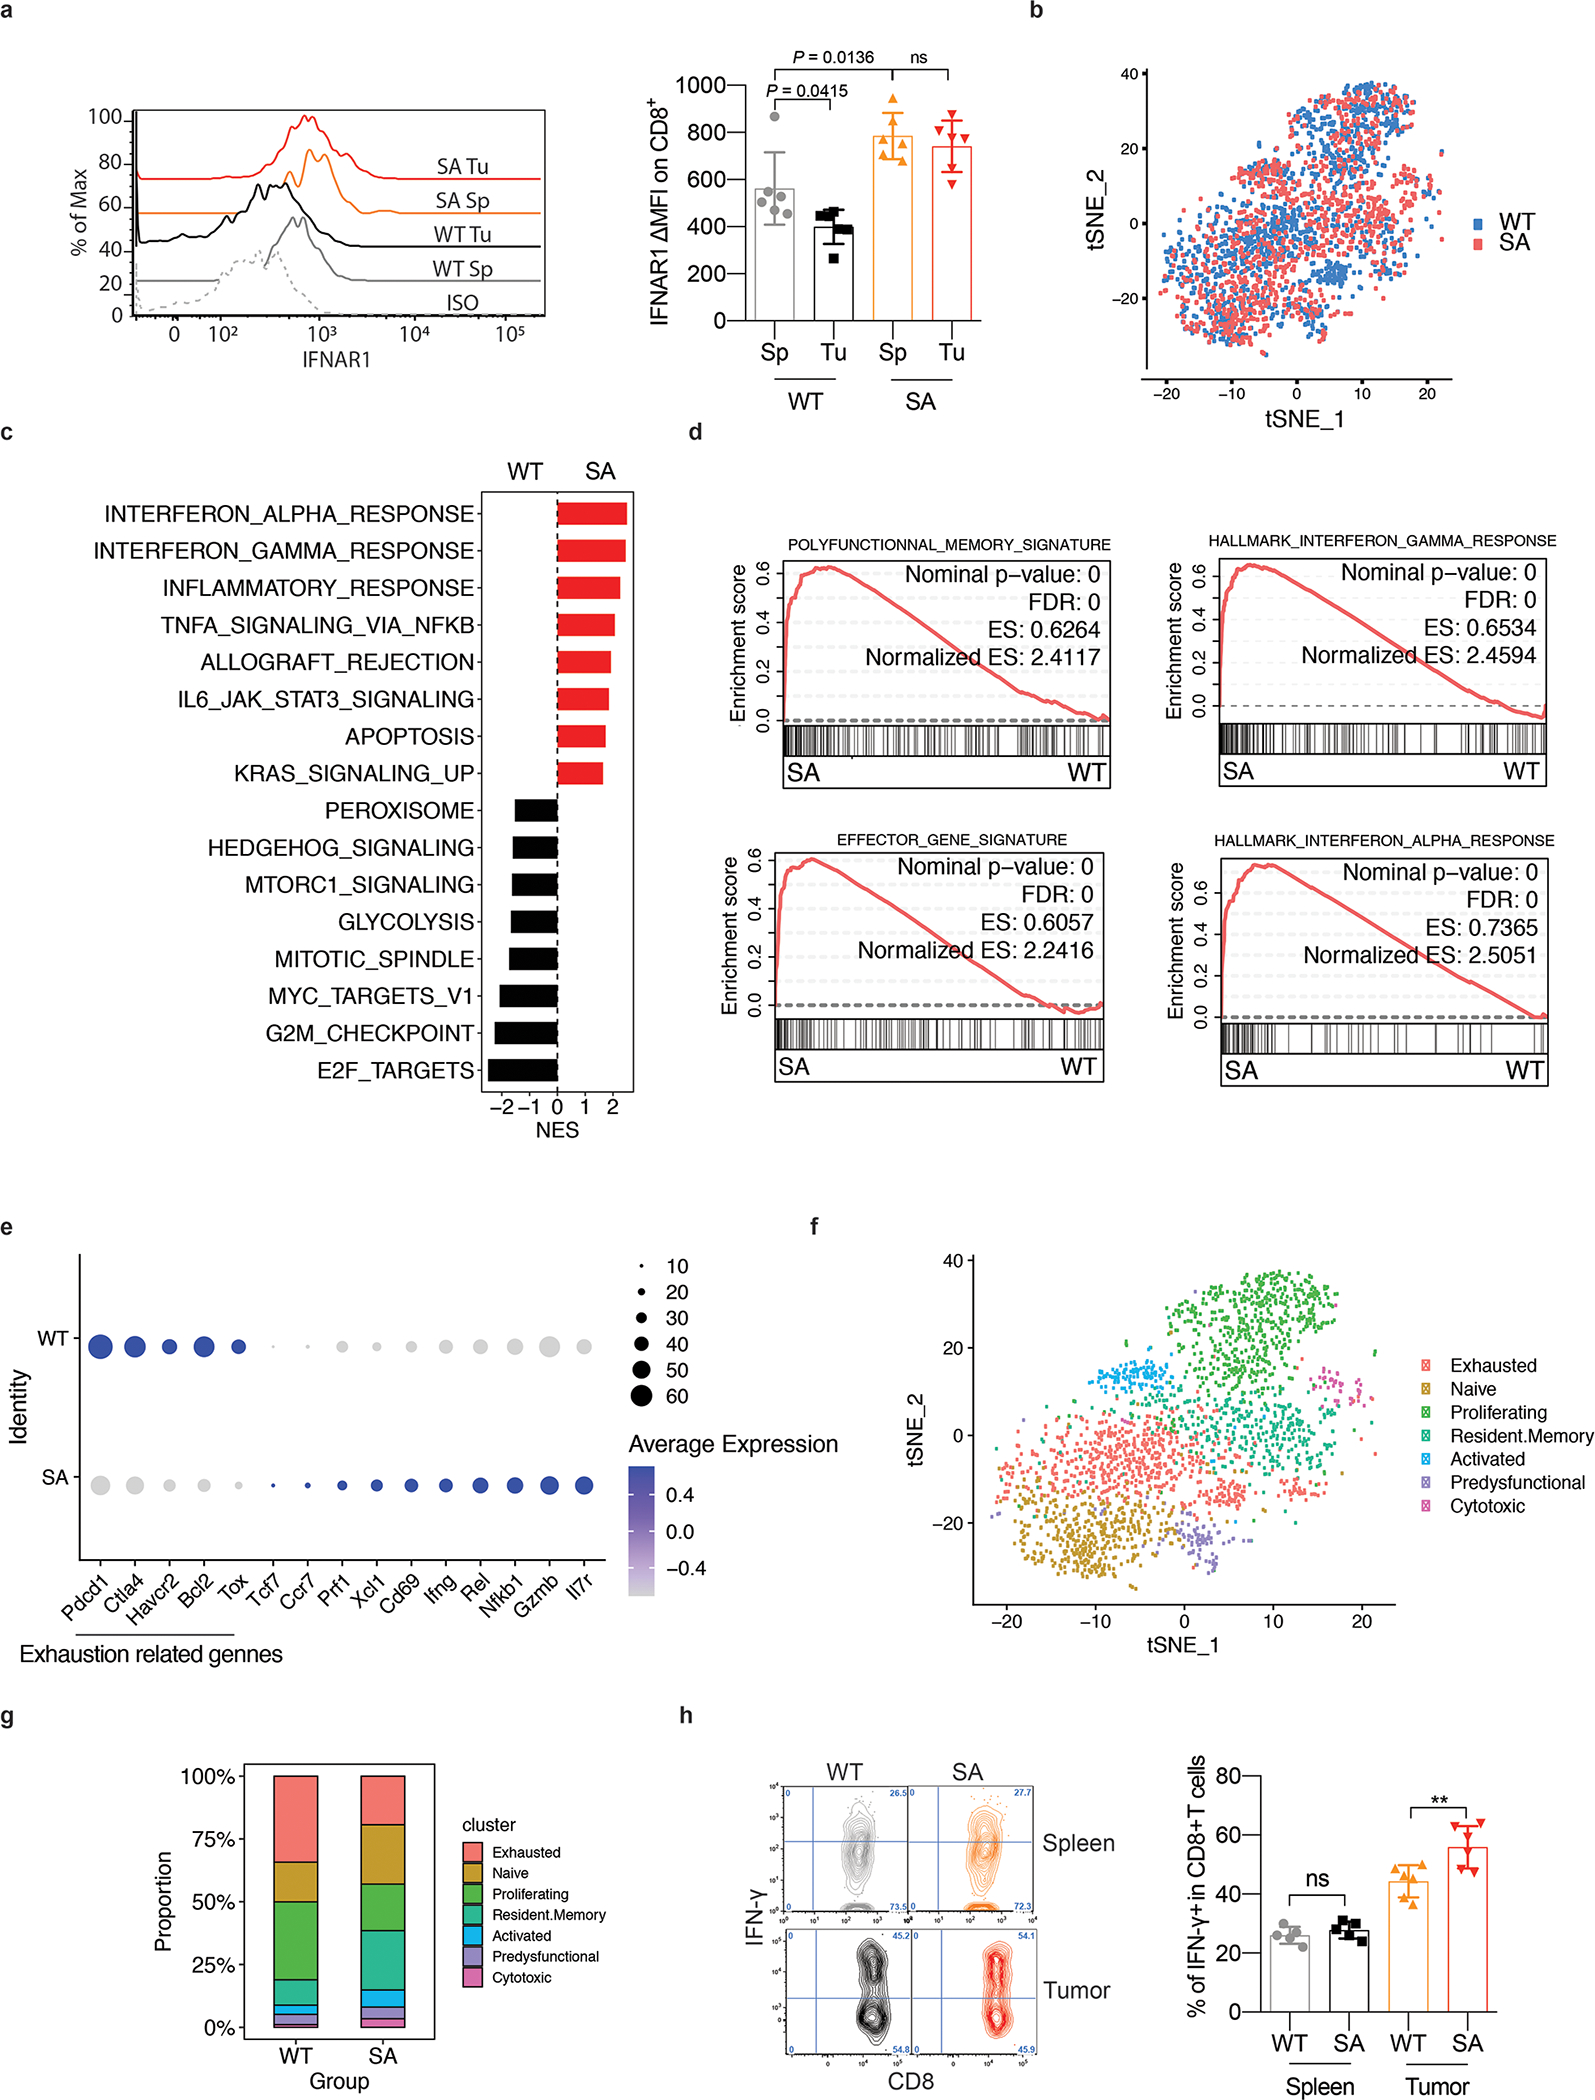
F. Flow cytometry analysis of IFNAR1 levels on the surface of CD45+CD3+CD8+ T cells in spleen (Sp) and tumor (Tu) tissues from WT or SA mice on day 21 after inoculation of s.c. MC38 tumors (1×10⁶ cells/mouse). Quantification data (on the right) are shown as mean ± SEM (n = 6 mice for each group). Statistical analysis was performed using ordinary one-way ANOVA with Tukey`s multiple comparisons test.
G. Immune cells were isolated from MC38 tumors growing in WT or SA mice on day 14 post-inoculation. N=9,725 cells were used for the scRNA-seq analyses. t-SNE plot of CD8+ T cells with clusters demarcated by colors demonstrating WT (blue, n = 2075 cells) and SA (red, n = 2038 cells).
H. Gene Set Enrichment Analysis (GSEA) of differentially expressed genes comparing CD8+ T cells in WT and SA groups. Black and red colors denote genesets enriched in WT and SA, respectively.
I. Leading-edge plots showing results from Gene Set Enrichment Analysis (GSEA) of CD8+ T cell function relevant genesets comparing CD8+ T cells in WT and SA groups.
J. Dot plot showing the expression of T cells exhaustion (underlined below) and function related genes. The size of the dot corresponds to the percentage of cells expressing the gene in each group and the color represents the average expression level. WT, n = 2075 cells; SA, n = 2038 cells.
K. t-SNE plot of CD8+ T cells with clusters demarcated by colors demonstrating seven clusters based on gene expression (as in Fig S1C).
L. t-SNE plot analysis of proportion of CD8+ T cell clusters (as in Fig 1F) in WT and SA samples. WT, n = 2075 cells; SA, n = 2038 cells.
M. Flow cytometry analysis of IFN-γ positive CD8+ T cells in naive spleens and tumor tissues from mice of indicated genotypes. Data are shown as mean ± SEM (WT and SA spleen, n = 5 mice; WT and SA tumor, n = 6 mice). Statistical analysis was performed using ordinary one-way ANOVA with Tukey`s multiple comparisons test. **P = 0.0050.
Accordingly, intratumoral WT CTL displayed a decrease in the activation/cytotoxic markers such as IFN-γ, Granzyme B/FasL and CD69 compared to SA CTL (Fig 1H, S1D-E). These data suggest that inactivation of intratumoral CTL is associated with IFNAR1 downregulation in the TME. Plausibly, this downregulation may stimulate the immune-suppressive elements (as reported for granulocytic myeloid-derived suppressor cells 28) or render active CTL sensitive to these elements, or both.
To focus on the roles of IFNAR1 downregulation on CTL, we analyzed functional tumoricidal activities of CTL using an in vitro assay where OT-1 CTL (WT or SA) killed OVA-expressing MC38 tumor cells. As a representative component of the immune-suppressive TME, we used Tregs cells. Downregulation of IFNAR1 and inhibition of cytolytic activity were observed upon co-incubation of WT OT-1 CTL with Treg cells, which were either in vitro differentiated (iTregs, Fig 2A–B, S2A) or isolated from WT tumors (Fig S2B). Of note, SA OT-1 CTL maintained their IFNAR1 surface levels and, remarkably, were insensitive to inhibition of tumoricidal activity by Tregs (Fig 2A–B, S2A-B) indicating that IFNAR1 downregulation on CTL contributes to suppressive activity of Tregs.
Figure 2. Downregulation of CTL IFNAR1 by Treg and adenosine.
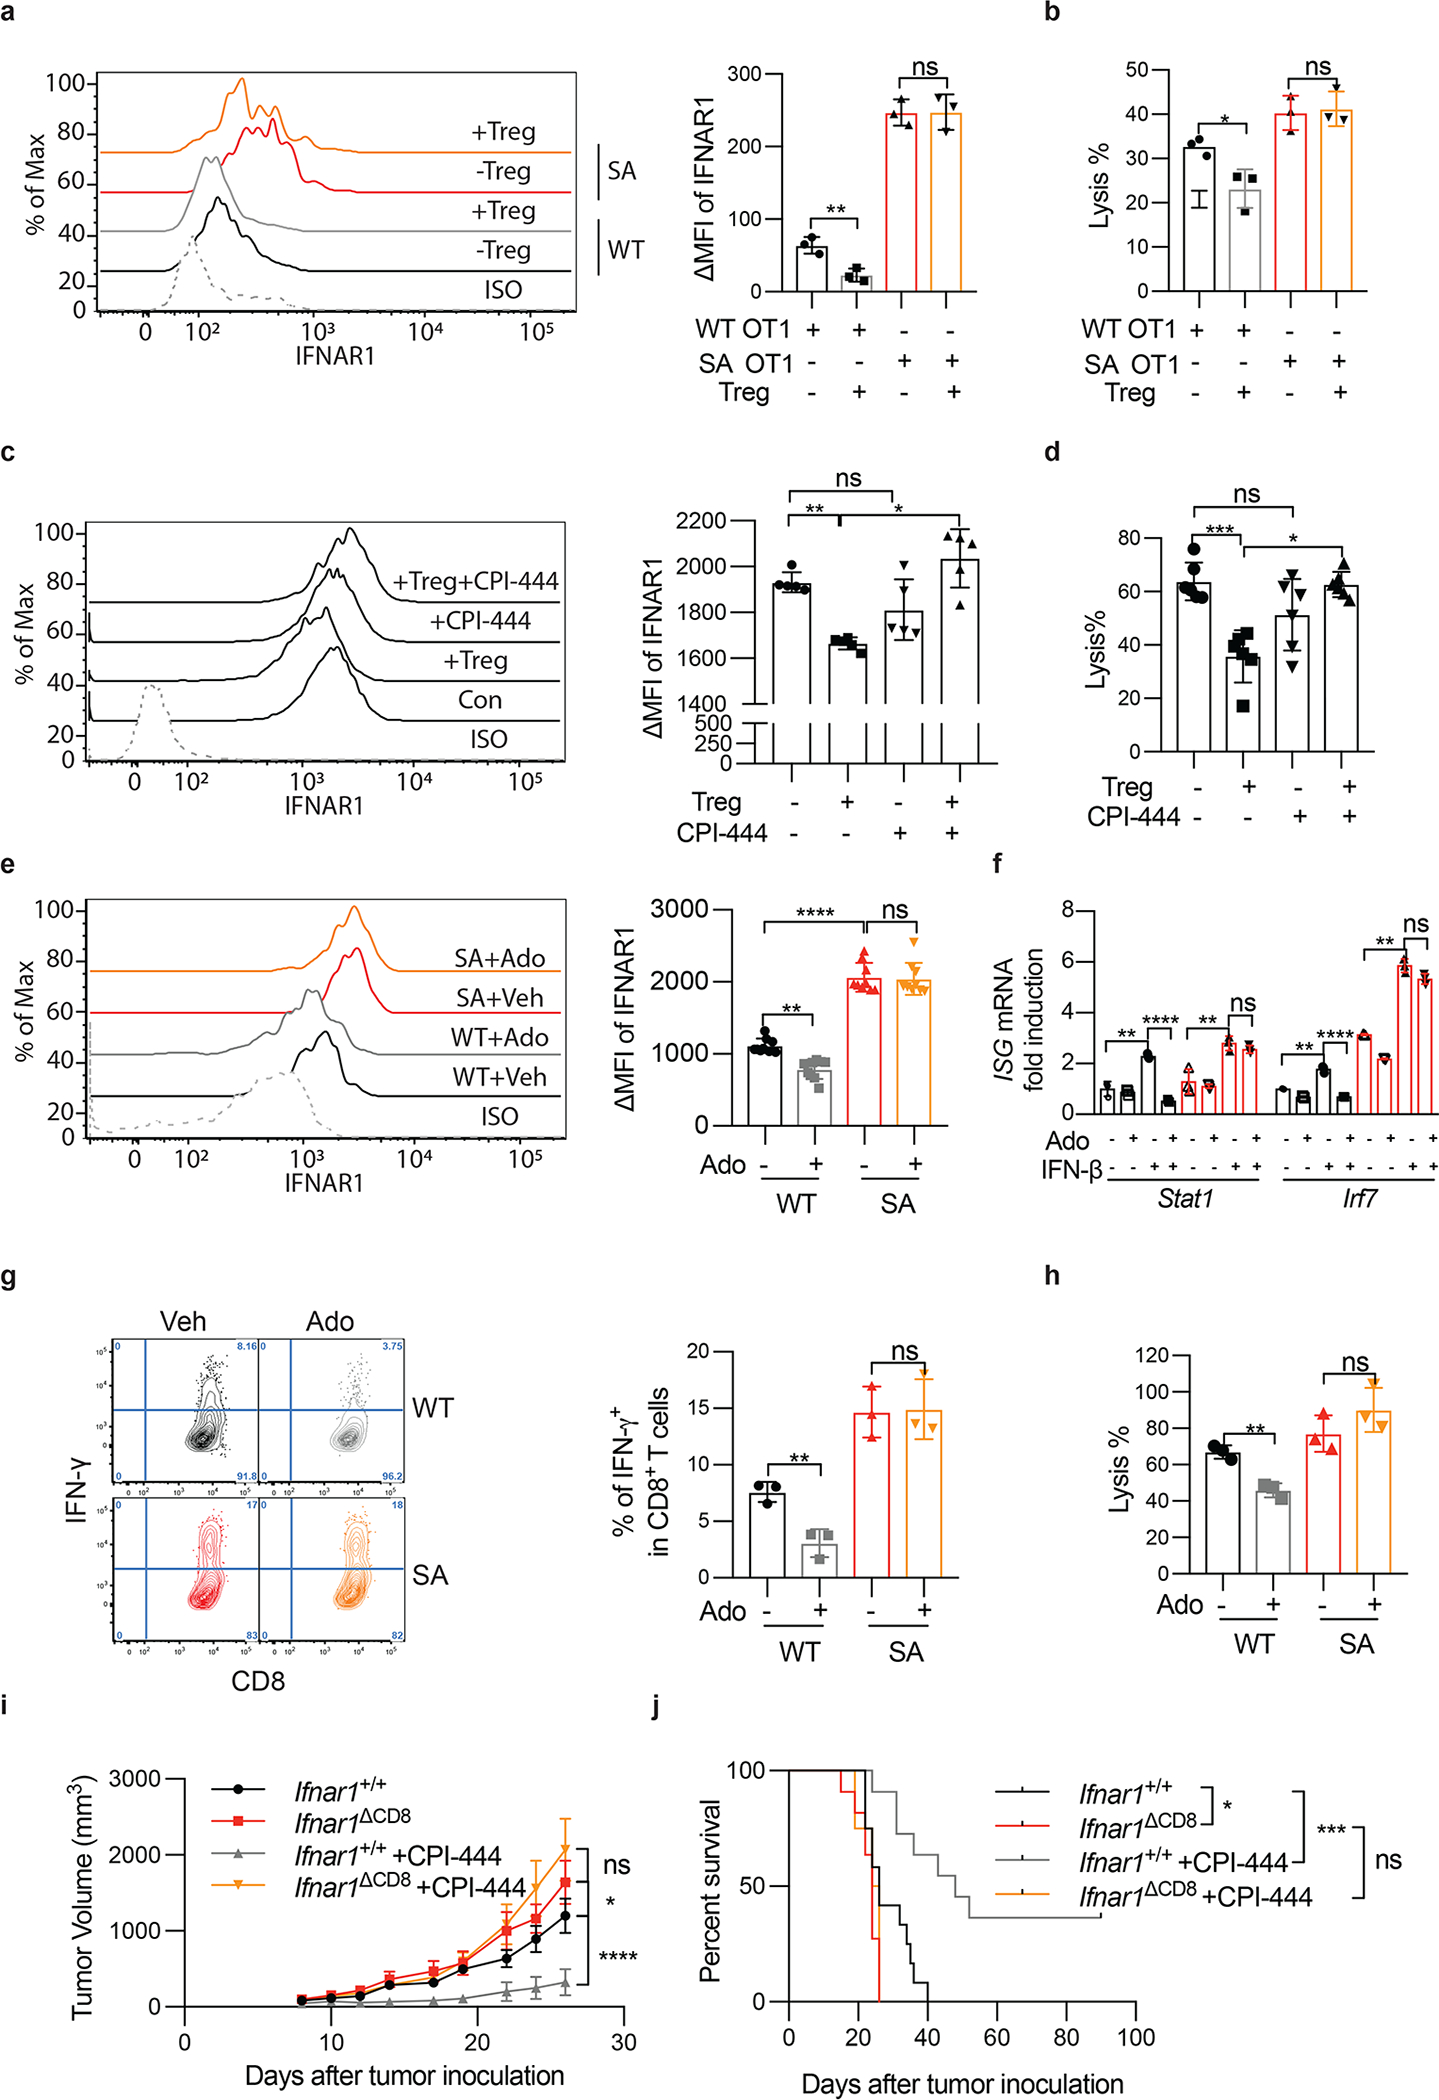
A. iTregs were cocultured with OT-1 cells (Treg: OT-1=1:3) for 24h. Then, IFNAR1 on the surface of OT-1 cells were analyzed by flow cytometry. Two-tailed unpaired t-test. **P = 0.0085. n = 3 co-cultures.
B. Lysis of MC38OVA-Luc cells by WT or SA OT-1 cells cocultured with iTregs at indicated conditions (Treg: OT-1=1:3, E:T ratio=10:1). Two-tailed unpaired t-test. *P = 0.0259. n = 3 co-cultures.
C. iTregs were cocultured (Treg: OT-1=1:3) with OT-1 cells (± CPI-444, 10μM 1h). Then IFNAR1 on the surface of OT-1 cells were analyzed by flow. One-way ANOVA. **P = 0.0022, *P = 0.0416. n = 5 co-cultures.
D. Lysis of MC38OVA-Luc cells by OT-1 cells (± CPI-444, 10μM 1h) cocultured with iTregs at indicated conditions (Treg: OT-1=1:3, E:T ratio=10:1). One-way ANOVA. ***P = 0.0002, *P = 0.0410. n = 6 co-cultures.
E. IFNAR1 on the surface of indicated CD8+ T cells (±Ado, 1mM, 2h). One-way ANOVA. **P = 0.0018, ****P < 0.0001. n = 9 mice.
F. qPCR analysis of mRNA in the indicated mouse splenocytes pretreated with adenosine (Ado, 1mM) for 2h and then stimulated with IFN-β (1000IU/ml) for 16h. One-way ANOVA.. **P < 0.01, ****P < 0.0001. n = 3 mice.
G. IFN-γ levels in indicated CD8+ T cells (±Ado, 1mM, 24h). One-way ANOVA. **P = 0.0068. n = 3 mice.
H. Lysis of MC38OVA-luc cells by OT-1 cells (±Ado, 1mM 24h). One-way ANOVA. **P = 0.0024. n = 3 co-cultures.
I. Growth of MC38 tumors (1×10⁶ cells/mouse, s.c.) inoculated into WT (Ifnar1+/+) or Ifnar1ΔCD8 mice and treated daily with CPI-444 (10mg/kg, oral gavage) or vehicle on days 1–12. Ifnar1+/+, Ifnar1ΔCD8, n = 13 mice; Ifnar1+/++CPI444, n = 7 mice; Ifnar1+/++CPI444, n = 8 mice. Two-way ANOVA. *P = 0.0364, ****P < 0.0001.
J. The Kaplan-Meier analysis of survival from experiment described in Fig 2I (Ifnar1+/+, n = 12 mice; Ifnar1ΔCD8, n = 11 mice; Ifnar1+/++CPI444, n = 11 mice; Ifnar1ΔCD8 +CPI444, n = 8 mice). Log-rank (Mantel-Cox) test. *P = 0.0295, ***P = 0.0008.
Adenosine downregulates IFNAR1 on CTL
Treg cells deploy diverse suppressive mechanisms involving production of adenosine, prostaglandins and cytokines such as TGF-β (reviewed in 6,29). Inhibitors of the adenosine production and signaling have been extensively studied as the means to reactivate the anti-tumor immunity 8,9. An inhibitor of adenosine receptor A2AR, CPI-444, limited suppressive effects of Treg on IFNAR1 levels and cytotoxic activities (Fig 2C–D). Consistently, adding adenosine to WT OT-1 CTL notably downregulated IFNAR1 (Fig 2E, S2C) and IFN-stimulated genes (Fig 2F). Furthermore, adenosine also inhibited WT CTL activity as manifested by decreased IFN-γ expression (Fig 2G) and attenuated tumoricidal effects (Fig 2H, S2D). Importantly, adenosine decreased neither IFNAR1 levels nor cytotoxicity in the SA CTL (Fig 2E–H, S2C-D) suggesting that downregulation of IFNAR1 on CTL triggered by cellular (Treg) and acellular (adenosine) elements of the TME plays a key role in CTL inactivation.
We next sought to determine whether IFNAR1 in CTL is required for their anti-tumor function and whether reactivation of CTL by A2AR inhibitor CPI-444 was dependent on ability of this agent to prevent downregulation of IFNAR1. These assumptions were indeed supported by in vivo studies, in which genetic ablation of IFNAR1 in CD8+ T cells (Fig S2E-F-G) accelerated tumor growth and notably abrogated the therapeutic effects of CPI-444 (Fig 2I–J). Collectively these data suggest that downregulation of IFNAR1 on CTL renders them prone to the immune-suppressive elements of the TME. In addition, these findings indicate that stabilization of IFNAR1 in CTL plays an important role for therapeutic efficacy of adenosine receptor inhibitor and provide the rationale for stabilizing IFNAR1 for reactivation of the intratumoral CTL.
PARP11 acts as a key regulator of the immune suppressive TME
Degradation of phosphorylated IFNAR1 depends on activity of the Skp1-Cullin1-Rbx1 E3 ubiquitin ligase recruited by the β-TrCP F-box proteins, including β-TrCP1 encoded by the BTRC gene or β-TrCP2/HOS encoded by the Fbxw11 gene 30–32. These β-TrCP proteins themselves are the substrates for the core ligase 33; and stability and availability of β-TrCP to ubiquitinate phosphorylated IFNAR1 is regulated by mono-ADP ribosyltransferase PARP11 25. Treatment of T cells with adenosine stimulated phosphorylation, ubiquitination and downregulation of IFNAR1 (Fig 3A). An adenosine-triggered decrease in IFNAR1 levels coincided with activation of p38α, upregulation of β-TrCP (Fig 3B) and induction of PARP11 expression (Fig S3A). Importantly, CRISPR/Cas9-mediated knockout of either Parp11 or p38α (encoded by Mapk14) or of β-TrCP1/2 (encoded by Fbxw1/Fbxw11) prevented downregulation of IFNAR1 by adenosine (Fig S3B-C). Whereas the role of p38α/Mapk14 in intratumoral CTL has been demonstrated 19,27, we next focused on the importance of PARP11-mediated downregulation of IFNAR1.
Figure 3. PARP11 regulates IFNAR1 downregulation in CD8+ T cells.
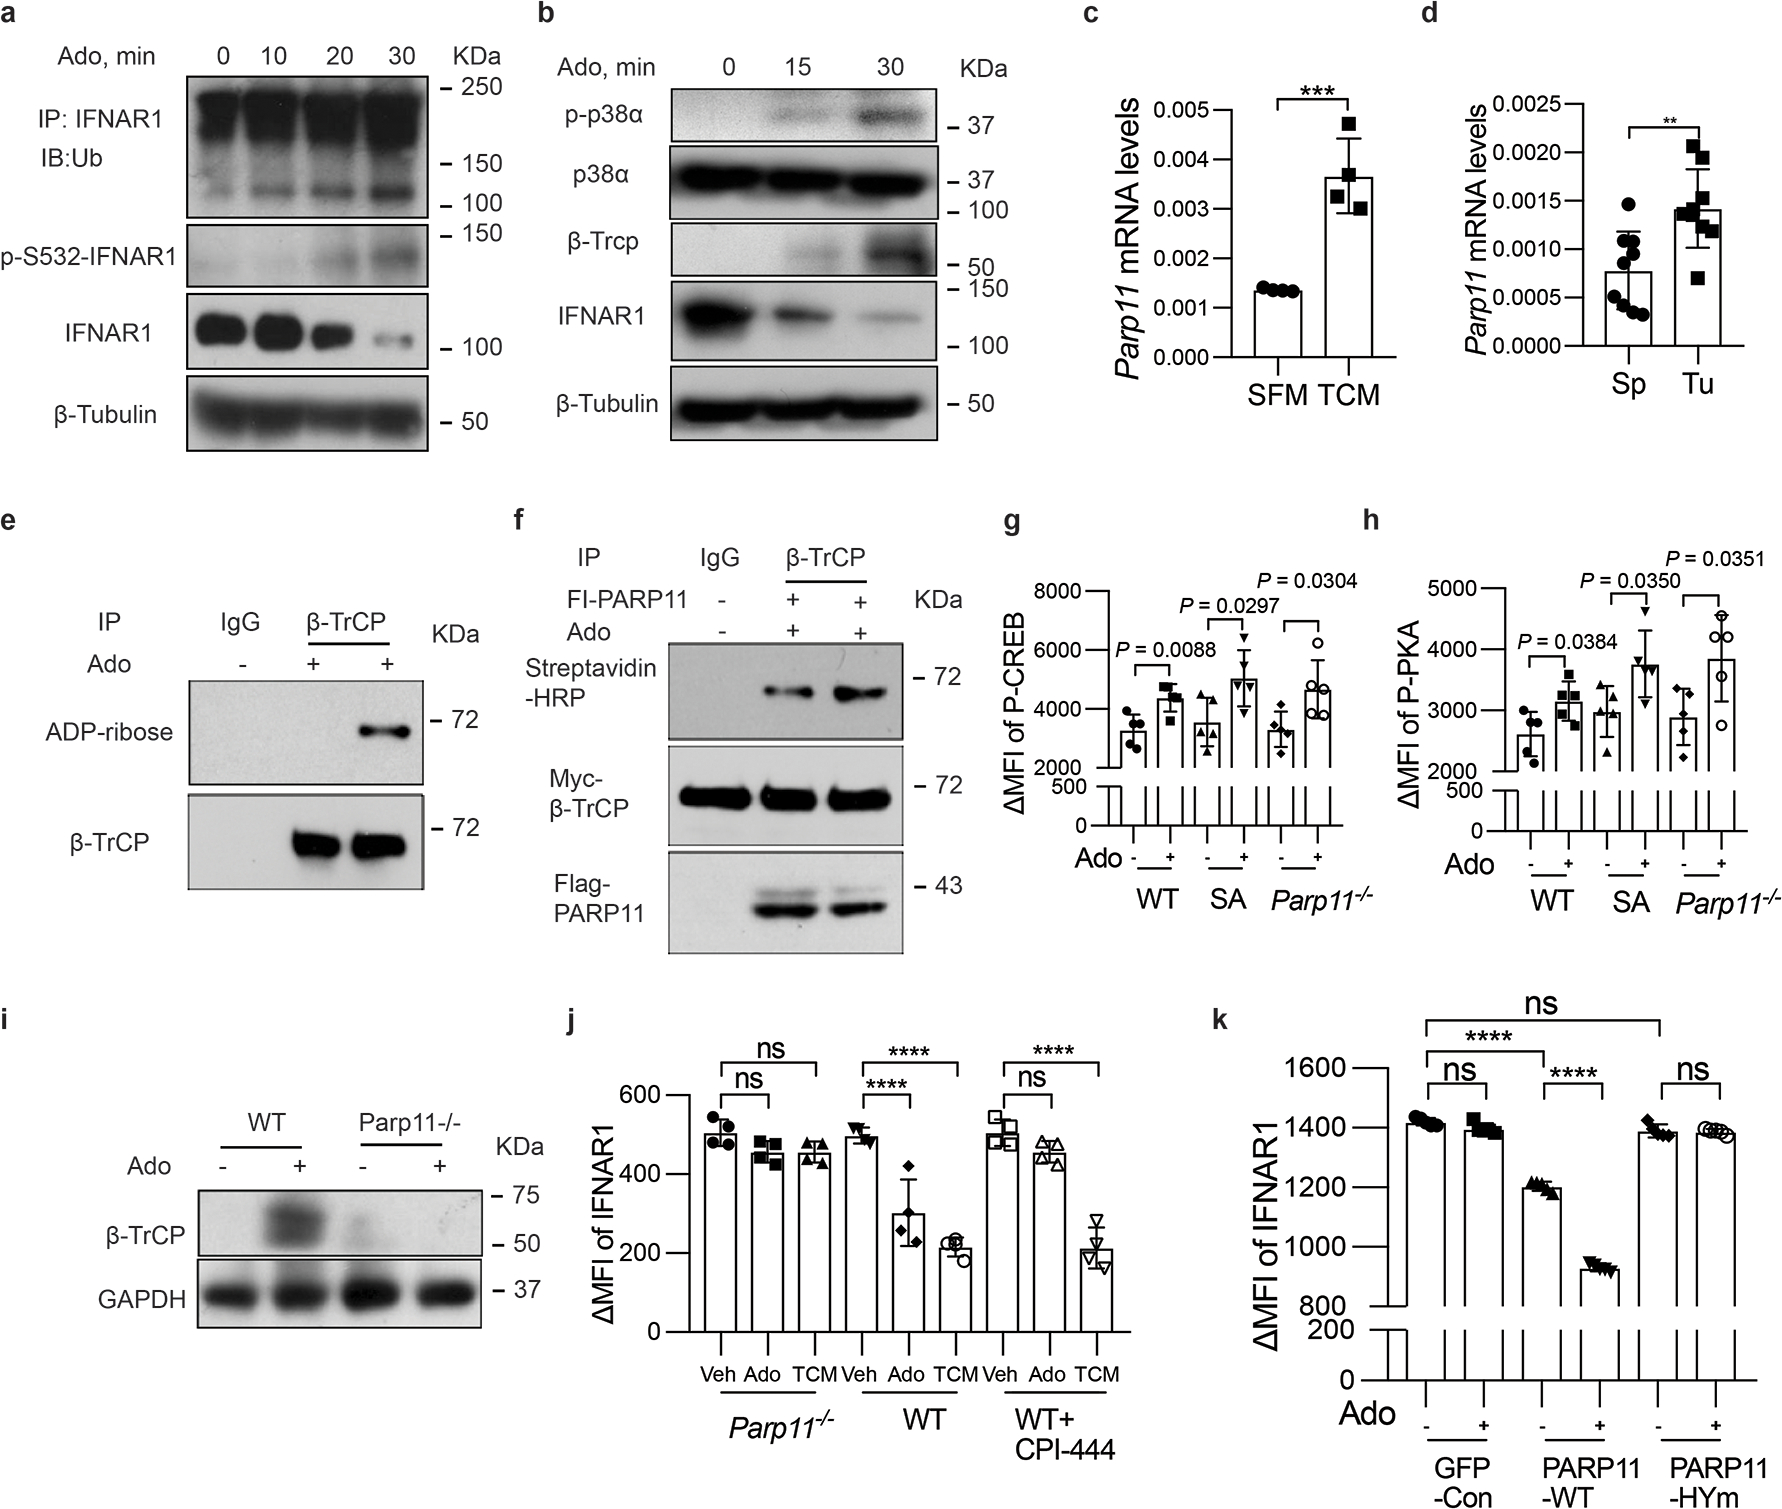
A. Immunoblot analysis of ubiquitination, phosphorylation, and total levels of IFNAR1 in Jurkat cells treated with adenosine (Ado, 1mM) at indicated time points.
B. Immunoblot analysis of phosphorylation and levels of p38α, and levels of IFNAR1 and β-TrCP in Jurkat cells treated with adenosine (Ado, 1mM) at indicated time points. A and B are representative of 3 independent repeats with similar results.
C. qPCR analysis of mRNA for Parp11 in T cells treated with serum-free media (SFM) or with tumor condition media (TCM) for 48h. Two-tailed unpaired t-test. ***P = 0.0009. n = 4 mice.
D. qPCR analysis of Parp11 mRNA in CTLs isolated from tumors or spleens of MC38 tumor bearing mice. Two-tailed unpaired t-test. **P = 0.004. Sp, n = 9 mice; Tu, n = 9 mice.
E. ADP-ribosylation of β-TrCP immunoprecipitated from human T cells treated or not with adenosine (1mM, 30min) as indicated was analyzed by immunoblot.
F. In vitro ADP-ribosylation of Myc-β-TrCP immunoprecipitated with Myc or control antibody and incubated on beads with biotinylated NAD+ in the presence of soluble Flag-PARP11 purified from 293T cells treated or not with adenosine (1mM, 30min) as indicated. Reactions were probed with streptavidin-HRP conjugate. Input levels of Myc-β-TrCP and Flag-PARP11 are also shown. E and F are representative of 3 independent repeats with similar results.
G. Flow cytometry analysis of phospho-CREB in (±Ado, 1mM, 2h). One-way ANNOVA. n = 5 mice.
H. Flow cytometry analysis of phospho-PKA in (±Ado, 1mM, 2h). One-way ANNOVA. n = 5 mice.
I. Immunoblot analysis of β-TrCP levels in indicated splenocytes treated with or without adenosine (Ado, 1mM, 30 min) as indicated. It is representative of 3 independent repeats with similar results.
J. Flow cytometry analysis of levels of IFNAR1 in indicated CTL (± CPI-444, 10 μM, 1h) and then treated with adenosine (Ado, 1mM) or tumor conditioned media (TCM) as indicated for 2h. One-way ANNOVA. ****P < 0.0001. n = 4 mice.
K. Flow cytometry analysis of levels of IFNAR1 in Parp11−/− CTL transduced with empty virus (GFP-con) or viruses for expression of human WT PARP11 or HYm PAPR11 mutant and treated with adenosine (Ado, 1mM, 2h). One-way ANNOVA. ****P < 0.0001. n = 4 mice.
PARP11 expression was induced upon exposure of CTL to factors present in the tumor-conditioned media (TCM, Fig 3C) and elevated in the intratumoral CTL compared to those isolated from spleens (Fig 3D). Furthermore, ADP ribosylation of β-TrCP in human T cells was increased by their exposure to adenosine (Fig 3E). Similar result was seen in recombinant HA-tagged β-TrCP expressed in 293T cells (Fig S3D). Importantly, a greater enzymatic activity in ADP-ribosylation of Myc-tagged β-TrCP in vitro was facilitated by PARP11 purified from cells treated with adenosine (Fig 3F). These results suggest that adenosine (and perhaps other factors present in the TME) increase expression and activity of PARP11.
Genetic evidence for importance of PARP11 came from studies in Parp11 knockout mice (Fig S3E and 34), whose CTL maintained proper responses to adenosine as manifested by phosphorylation of protein kinase A and CREB transcription factor (Fig 3G–H, S3F). Yet these Parp11-null CTLs were deficient in adenosine-induced upregulation of β-TrCP (Fig 3I). As expected, inhibitor of A2AR CPI-444 prevented downregulation of IFNAR1 in response to adenosine but not to tumor conditioned media (Fig 3J, S3G), which contains other stimuli capable of downregulating IFNAR1 such as inflammatory cytokines or extracellular vesicles 22,23. Importantly, knockout of Parp11-null stabilized IFNAR1 under both conditions (Fig 3K, S3G). Downregulation of IFNAR1 by adenosine was restored in Parp11-null CTLs upon re-expression of wild type human PARP11 but not of catalytically inactive PARP11HYmu (H204P-Y236S) mutant (Fig 3K, S3H). In all, these results implicate PARP11-dependent ADP-ribosylation in inactivation IFNAR1 in CTL within the TME.
To determine the biological importance of this regulation, we analyzed tumor growth and CTL status in Parp11 knockout mice. We found that the levels of IFNAR1 were greater in the intratumoral CTL isolated from MC38 or B16F10 tumors growing in Parp11–null mice compared to those from WT hosts (Fig 4A, S4A). Furthermore, knockout of Parp11 significantly delayed growth of these tumors (Fig 4B–C, S4C-D) as well as LLC (Fig S4B). Importantly, ablation of PARP11 also notably increased the numbers (Fig 4D, S4E) and activity of intratumoral CTL as manifested by levels of IFN-γ, CD69 and TNF-α (Fig 4E–F–G and S4F-G-H). Importantly, all these phenotypes observed in Parp11–null mice were reversed in Parp11−/−Ifnar1−/− double knockout animals (Fig 4, S4) suggesting a pivotal role of PARP11-driven downregulation of IFNAR1 in the TME for immune suppression and tumor growth.
Figure 4. Inactivation of intratumoral CTL and robust tumor growth require IFNAR1-dependent function of PARP11 in the TME.
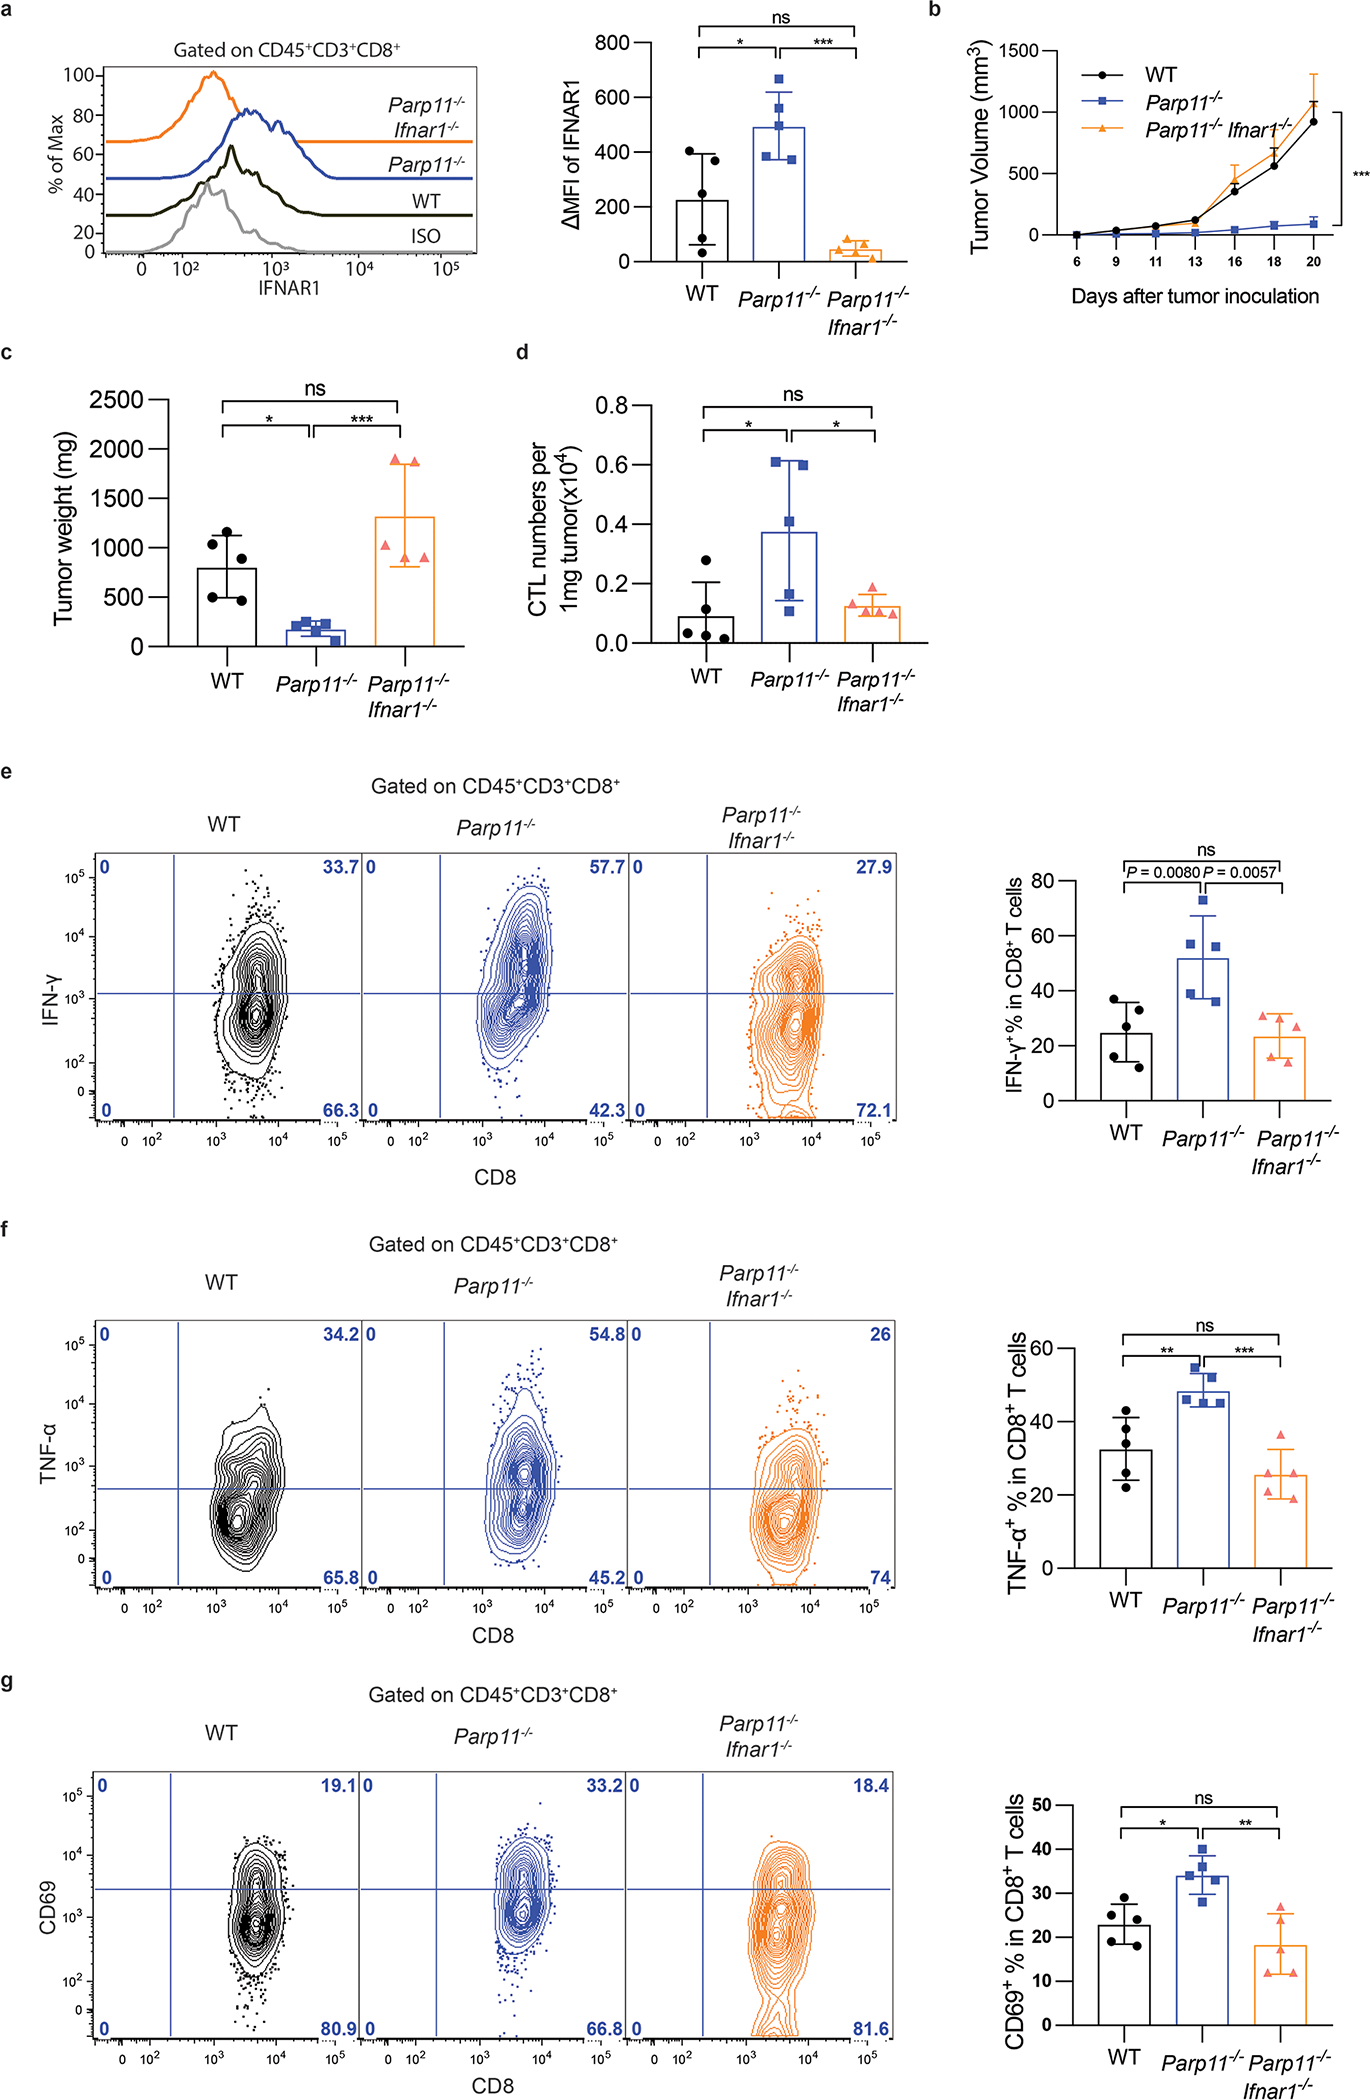
A. Flow cytometry analysis of levels of IFNAR1 on the surface of CD45+CD3+CD8+ T cells in tumor tissues from WT, Parp11−/−, and Parp11−/−Ifnar1−/− mice on days 20 after inoculation of s.c. MC38 tumors (0.5×10⁶ cells/ mouse). Quantification is shown on the right. Statistical analysis was performed using ordinary one-way ANOVA with Tukey`s multiple comparisons test. *P = 0.0111, ***P = 0.0002. n = 5 mice.
B. Volume of MC38 s.c. tumors in mice of indicated genotypes. Statistical analysis was performed using two-way ANOVA with Tukey`s multiple comparisons test. ***P = 0.0009. n = 5 mice.
C. Tumor weight of MC38 tumors grown in mice of indicated genotypes (Day 20). Statistical analysis was performed using ordinary one-way ANOVA with Tukey`s multiple comparisons test. *P = 0.0387, ***P = 0.0007. n = 5 mice.
D. Flow cytometry analysis of numbers of CD8+ T cells in MC38 tumors growing in indicated mice. Statistical analysis was performed using ordinary one-way ANOVA with Tukey`s multiple comparisons test. *P < 0.05. n = 5 mice.
E. Flow cytometry analysis of IFN-γ+ cells gated on CD45+CD3+CD8+ T cells isolated from MC38 tumors grown in indicated mice. Statistical analysis was performed using ordinary one-way ANOVA with Tukey`s multiple comparisons test. **P < 0.01. n = 5 mice.
F. Flow cytometry analysis of TNF-α+ cells gated on CD45+CD3+CD8+ T cells isolated from MC38 tumors grown in indicated mice. Statistical analysis was performed using ordinary one-way ANOVA with Tukey`s multiple comparisons test. **P = 0.0081, ***P = 0.0005. n = 5 mice.
G. Flow cytometry analysis of CD69+cells gated on CD45+CD3+CD8+ T cells isolated from MC38 tumors grown in indicated mice. Statistical analysis was performed using ordinary one-way ANOVA with Tukey`s multiple comparisons test. *P = 0.0164, **P = 0.0016. n = 5 mice.
Targeting PARP11 improves the efficacy of CAR T cell therapy
Whereas these results characterize PARP11 as an important negative immune regulator in the TME, we next focused on specific role of PARP11 in CTL. Mining existing databases revealed PARP11 as one of the genes associated with CD8+ T cell exhaustion 35. Consistently, analysis of subsets of CD8+ T cells from human patients with colorectal cancers 36 revealed that expression of PARP11 was decreased in highly active effector CD103+CD39+ subset (characterized by abundant expression of IFN-γ, granzymes and perforin 36) compared to effector memory or naïve T cells (Fig 5A). Together with our own results, these data support the rationale for targeting PARP11-driven ADP-ribosylation to stabilize IFNAR1 and to increase the activity of therapeutic CTL.
Figure 5. PARP11 undermines tumoricidal activities of CAR T cells.
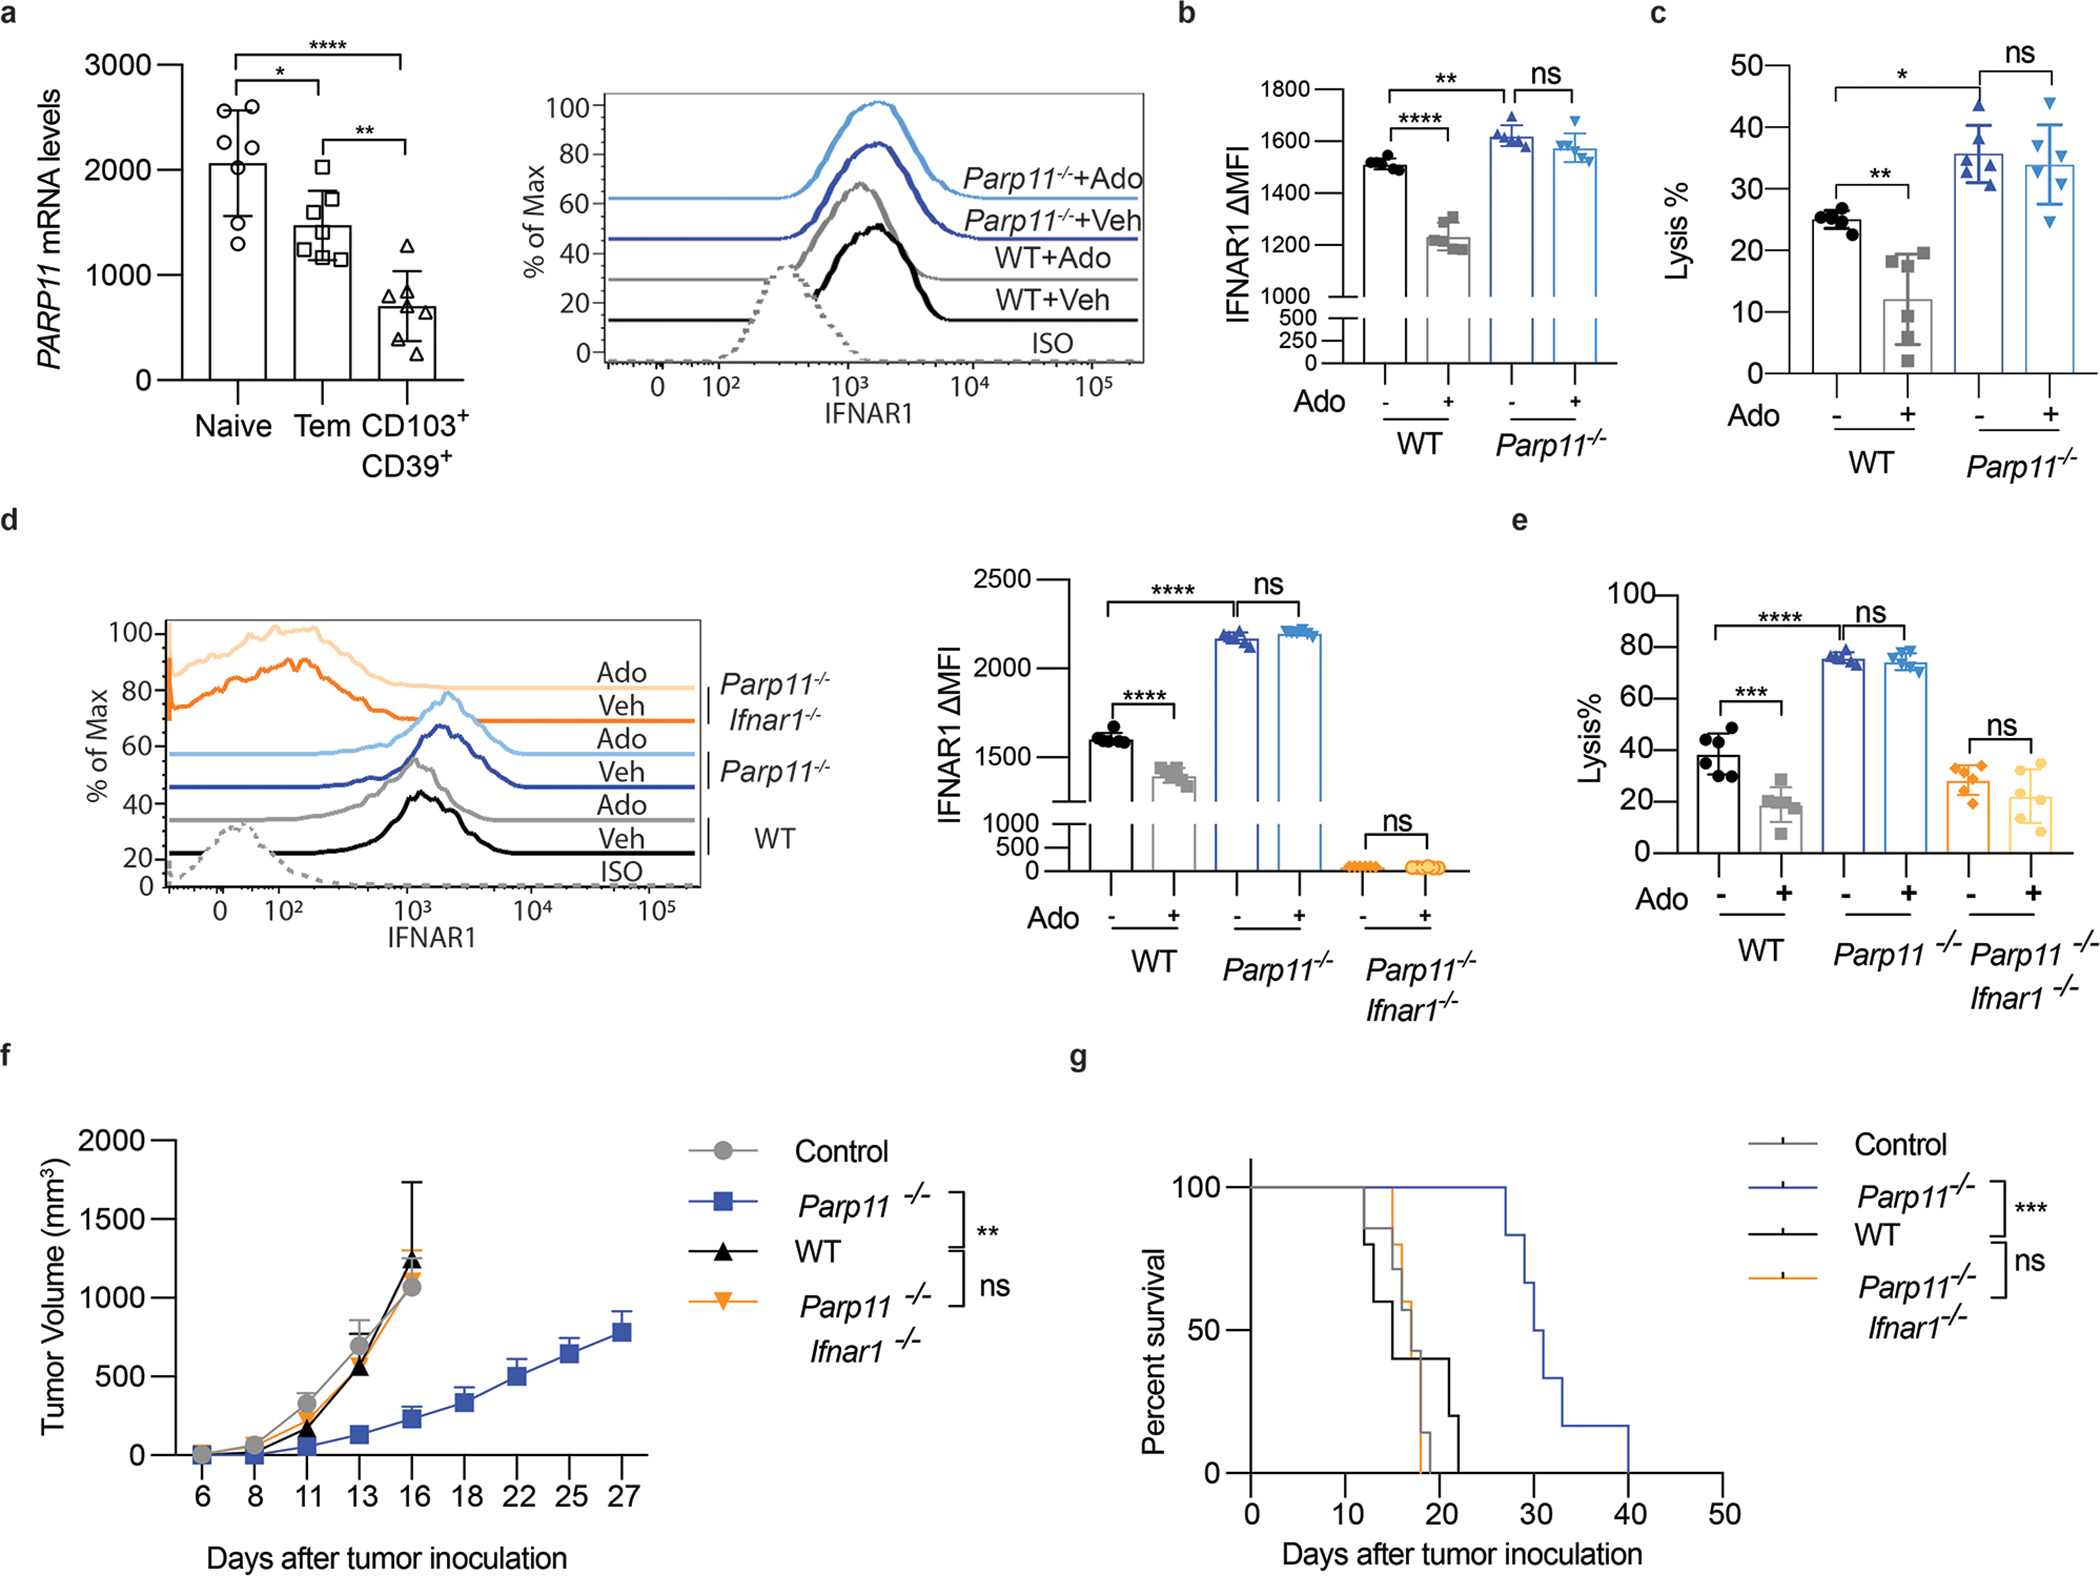
N. Relative expression of PARP11 in CD8+ T cell subsets isolated from colorectal cancer patients 36. Data in naïve, effector memory and highly active effector CD103+CD39+ subpopulations are shown. Statistical analysis was performed using ordinary one-way ANOVA with Tukey`s multiple comparisons test. *P = 0.0312, ****P < 0.0001, **P = 0.0052. n = 7 samples.
O. Flow cytometry analysis of the IFNAR1 levels on indicated Meso-BBz CAR T cells treated with or without Ado (Ado, 1mM, 24h). Statistical analysis was performed using ordinary one-way ANOVA with Tukey`s multiple comparisons test. ****P < 0.0001, **P = 0.0021. n = 6 independently treated cell cultures.
P. Lysis of EM-Meso-GFP-Luc cells by Meso-BBz CAR T cells produced from WT and Parp11−/− mice treated as indicated (E:T ratio=10:1). Statistical analysis was performed using ordinary one-way ANOVA with Tukey`s multiple comparisons test. **P < 0.0027, *P = 0.0144. n = 6 independently treated cell cultures.
Q. Flow cytometry analysis of the IFNAR1 levels on CD19-BBz CAR T cells produced from WT, Parp11−/−, and Parp11−/−Ifnar1−/− mice treated as indicated. Statistical analysis was performed using ordinary one-way ANOVA with Tukey`s multiple comparisons test. ****P < 0.0001. n = 5 mice.
R. Lysis of hCD19-B16F10 cells by CD19-BBz CAR T cells produced from WT, Parp11−/−, and Parp11−/−Ifnar1−/− mice treated as indicated (E:T ratio=10:1). Statistical analysis was performed using ordinary one-way ANOVA with Tukey`s multiple comparisons test. ***P = 0.0002, ****P < 0.0001. n = 6 independently treated cell cultures.
S. Tumor growth (s.c.) of hCD19-B16F10 tumor-bearing C57BL/6 mice adoptively transferred with CD19-BBz CAR T cells (2×10⁶/mouse, i.v. at day 7) as indicated. Statistical analysis was performed using two-way ANOVA with Tukey`s multiple comparisons test. **P = 0.0019. Control, n = 7 mice, Parp11−/−, n = 6 mice; WT, n = 5 mice, Parp11−/− Ifnar1−/−, n = 5 mice.
T. The Kaplan-Meier analysis of survival of animals from experiment described in Fig 5F. Statistical analysis was performed using Gehan-Breslow-Wilcoxon test. ***P = 0.0007. Control, n = 7 mice, Parp11−/−, n = 6 mice; WT, n = 5 mice, Parp11−/− Ifnar1−/−, n = 5 mice.
This rationale was first tested by manufacturing the CAR T cells from wild type or PARP11-null T lymphocytes (Fig S5A). Notably, even upon exposure to adenosine, Parp11-deficient T cells harboring mesothelin-targeting (Meso) CAR (Fig S5B) maintained IFNAR1 levels (Fig 5B) and tumoricidal activities (Fig 5C). Similar effects of PARP11 inactivation were observed when CAR T cells from WT or Parp11–null mice were manufactured using CAR against CD19 antigen (Fig 5D and Fig S5C). Importantly, deletion of IFNAR1 reversed the effects of PARP11 ablation as was seen in CAR T cells derived from Parp11−/−Ifnar1−/− mice (Fig 5D–E).
These results indicate that stabilization of IFNAR1 upon ablation of Parp11 renders these cells resistant to the immune suppressive effects of adenosine in vitro. Furthermore, the efficacy of anti-CD19 CAR T cells in vivo followed the same pattern (Fig 5F–G, S5D). Under these conditions, PARP11 status in CAR T cells did not affect the expression of CD19 antigen by malignant cells (Fig S5E). Ablation of PARP11 in CAR T cells decreased their cell surface levels of TIM3 but not of PD-1 or LAG-3 exhaustion markers (Fig S5F), and increased CAR T cell persistence in blood and tumors but not in the spleen (Fig S5G). These results suggest that PARP11-driven inactivation of IFNAR1 in CTL plays an important role in immune suppressive effects of the TME and provide further rationale for targeting PARP11-driven ADP ribosylation to increase the efficacy of CAR T cell therapies.
Driven by these considerations, we engineered a fourth-generation anti-CD19 CAR that expressed an shRNA against PARP11 (Fig 6A). Transduction of human T cells with this construct downregulated PARP11 (Fig S6A-B) and rendered these cells resistant to IFNAR1 downregulation by adenosine (Fig 6B). CAR T cells manufactured with this construct (Fig S6C) maintained their tumoricidal activity against CD19-expressing cells (including naturally expressing CD19 NALM6 leukemia cells) even in the presence of adenosine (Fig 6C–D). Importantly, CAR modified to inactivate PARP11 also exhibited increased anti-tumorigenic efficacy in vivo (Fig 6E–F) suggesting a therapeutic potential for genetic or pharmacologic inhibition of PARP11 to restore IFNAR1 function and reactivate CAR T cells.
Figure 6. Increased efficacy of CAR T cells engineered to inactivate PARP11.
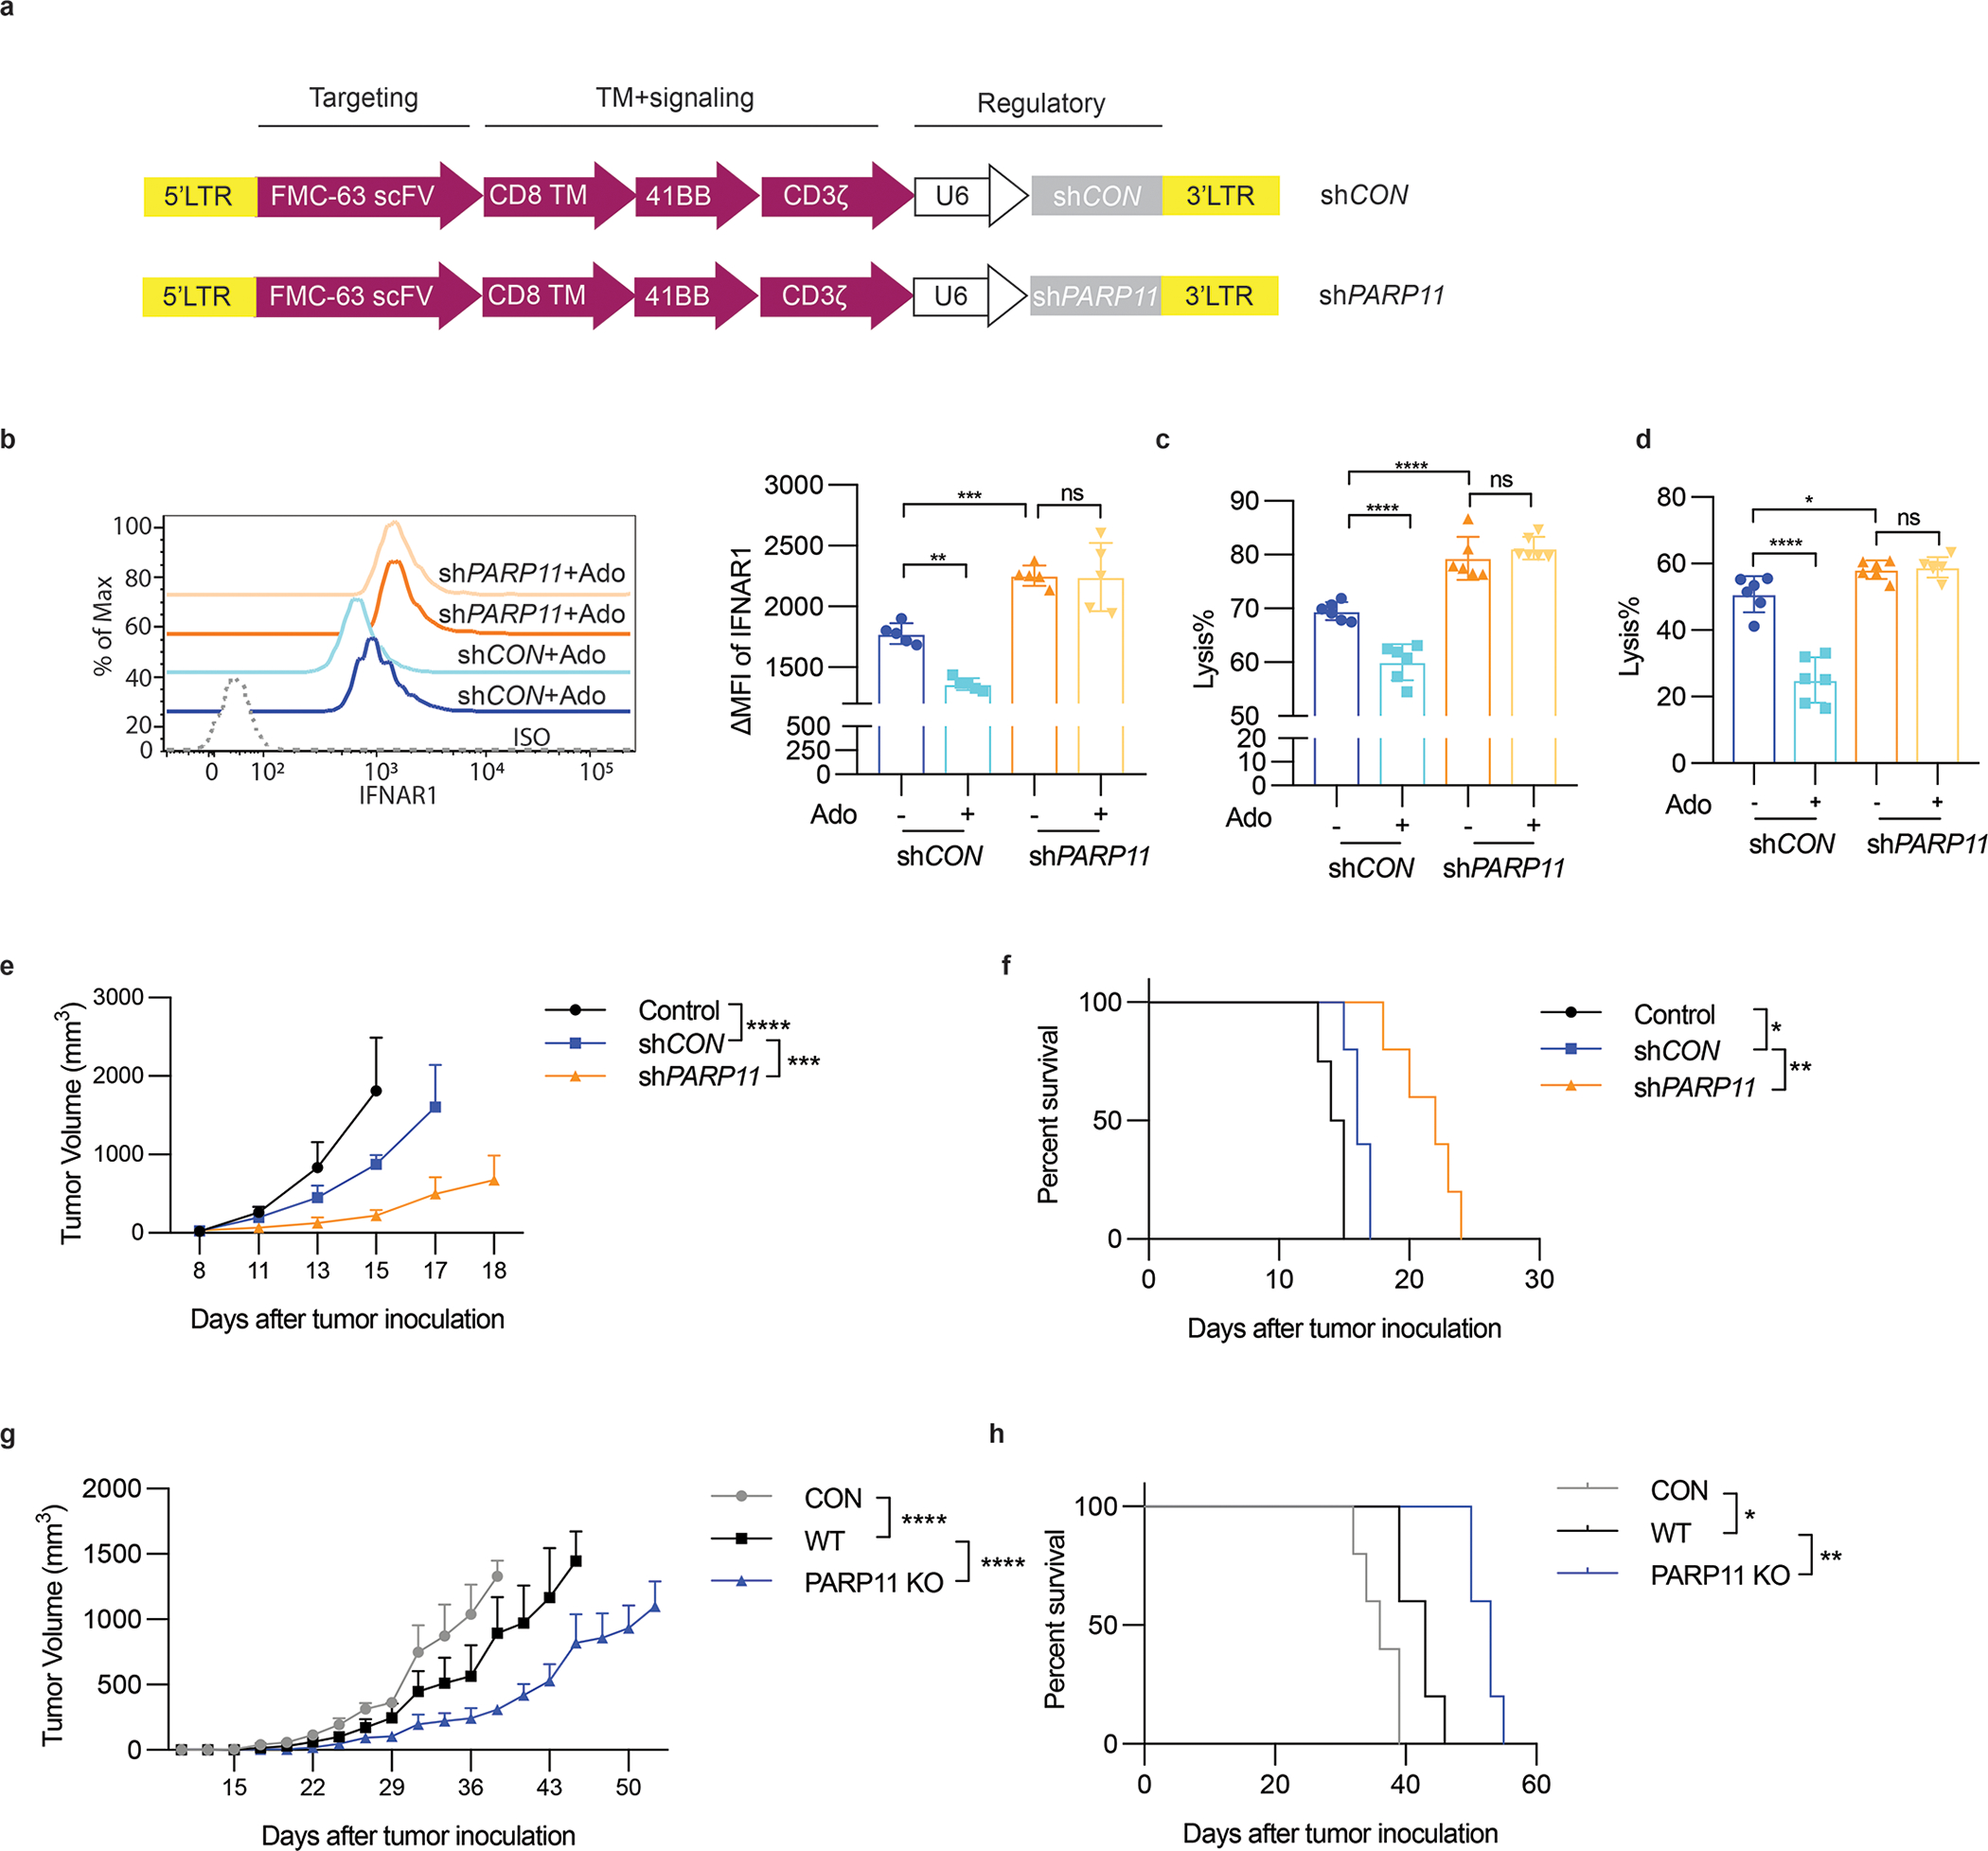
A. Schematic representation of shCON and shPARP11-CD19-BBz chimeric receptors.
B. Flow cytometry analysis of levels of IFNAR1 on the surface of indicated CAR T cells treated with or without adenosine (Ado, 1mM, 24h). Statistical analysis was performed using ordinary one-way ANOVA with Tukey`s multiple comparisons test. **P = 0.0033, ***P = 0.0009. n = 5 samples.
C. Lysis of hCD19-B16F10 cells by shCON-CD19-BBz or shPARP11-CD19-BBz CAR T cells treated with or without adenosine (Ado, 1mM, 24h). (E:T ratio=10:1). Statistical analysis was performed using ordinary one-way ANOVA with Tukey`s multiple comparisons test. ****P < 0.0001. n = 6 independently treated cell cultures.
D. Lysis of NALM6 cells that express endogenous CD19 by shCON-CD19-BBz or shPARP11-CD19-BBz CAR T cells treated with or without adenosine (Ado, 1mM, 24h). (E:T ratio=10:1). Statistical analysis was performed using ordinary one-way ANOVA with Tukey`s multiple comparisons test. ****P < 0.0001, *P = 0.0426. n = 6 independently treated cell cultures.
E. hCD19-B16F10 tumor growth in NSG mice inoculated with 5×10⁵ hCD19-B16 cells (s.c.) and 7 days later administered with indicated CAR T cells (1×10⁶/ mouse, i.v). Statistical analysis was performed using two-way ANOVA with Tukey`s multiple comparisons test. ****P < 0.0001, ***P = 0.0005. Con, n = 4 mice; shCon, n = 5 mice; shPARP11, n = 5 mice.
F. The Kaplan-Meier analysis of survival of animals from experiment described in Fig 6E (Con, n = 4 mice; shCon, n = 5 mice; shPARP11, n = 5 mice). Statistical analysis was performed using Log-rank (Mantel-Cox) test. *P = 0.0138, **P = 0.0026.
G. Growth of EM-Meso-GFP-Luc tumors (1×10⁶/mouse, s.c.) in NSG mice that were administered with control (PBS) or WT or PARP11 knockout Meso-BBz CAR T cells (1×10⁶/ mouse, i.v. on day 7). Statistical analysis was performed using two-way ANOVA with Tukey`s multiple comparisons test. ****P < 0.0001. n=5 mice.
H. The Kaplan-Meier analysis of survival of animals from experiment described in Fig. Statistical analysis was performed using Log-rank (Mantel-Cox) test. **P = 0.0019, *P = 0.0174. n = 5 mice.
These conclusions were further supported by a complementary approach of ablating PARP11 in human CAR T cells using CRISPR-Cas9 technology (Fig S6D-E-F). We used the Meso CAR that can target pancreatic, lung and ovarian cancer cells and exhibits a reasonable safety profile with potentially promising efficacy (reviewed in 37). Knockout of PARP11 in these cells notably increased the efficacy of their adoptive transfer as manifested by deceleration of tumor growth (Fig 6G) and prolonged animal survival (Fig 6H).
We then focused on pharmacologic approach to provide a proof of principle for inhibiting ADP ribosylation to improve the efficacy of CAR T adoptive transfer therapies. We first targeted p38 kinase, whose genetic ablation improved the therapeutic efficacy of CAR T cells in an IFNAR1-dependent manner 19,27. Treatment of Meso CAR T cells (Fig S7A) with the p38 inhibitor Ralimetinib (LY) prevented adenosine-induced IFNAR1 downregulation (Fig S7B) and robustly increased anti-tumorigenic activity of these CAR T cells in vitro (Fig S7C) and in vivo (Fig S7D-E).
As development of bioavailable PARP11-specific inhibitors is still in progress 38, we took advantage of the fact that the FDA-approved drug Rucaparib, which targets PARP1/2 39, is also capable of inhibiting PARP11 25. Rucaparib prevented induction of β-TrCP and downregulation of IFNAR1 by adenosine in human T cells (Fig 7A). Importantly, the anti-tumor effect of Rucaparib in immune-competent WT hosts harboring MC38 tumors was no longer evident in Ifnar1ΔCD8 mice (Fig 7B–C) indicating that stabilization of IFNAR1 in CTL plays a key role in the mechanisms of action for Rucaparib. Remarkably, Rucaparib increased in vivo efficacy of wild type but not of Parp11-null anti-CD19 CAR T cells (Fig 7D) suggesting that modulation of PARP11 status by Rucaparib significantly contributes to its anti-tumor effects.
Figure 7. Rucaparib increases the efficacy of CAR T cell therapies.
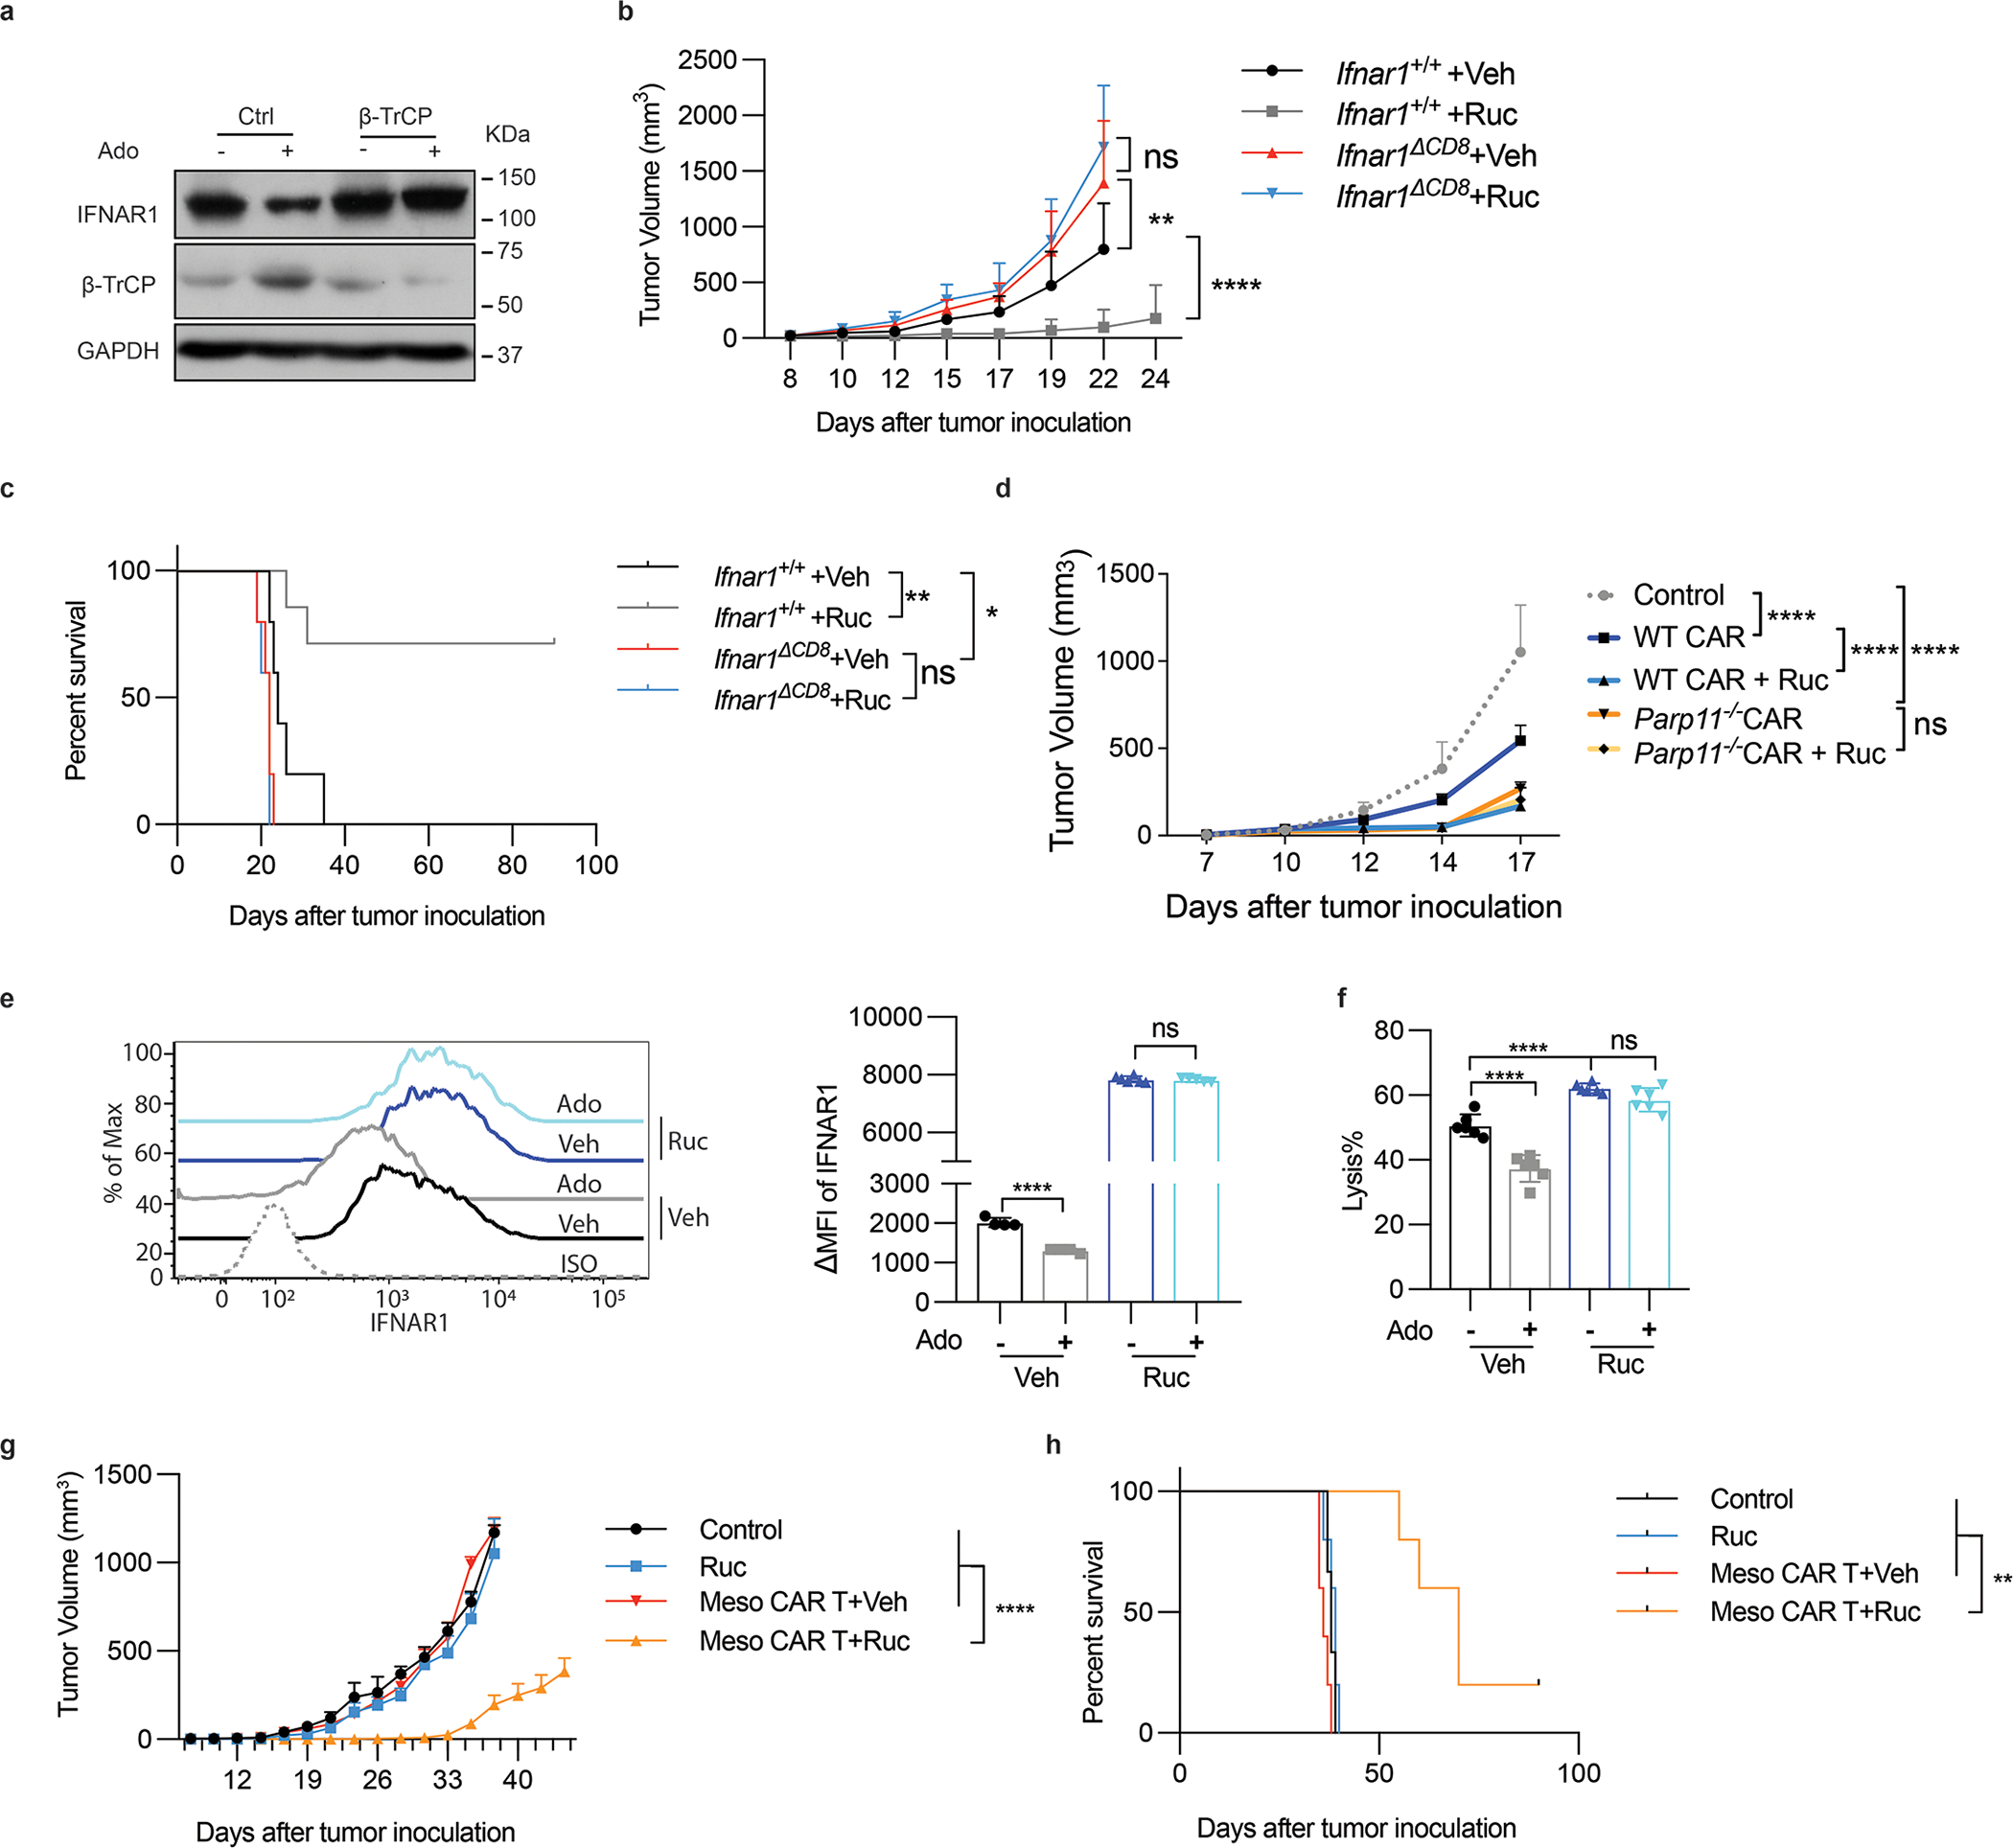
A. Immunoblot analysis of β-TrCP and IFNAR1 levels in Jurkat cells (± Ruc, 1uM, 2h) and then treated with or without adenosine (Ado, 1mM) for 30 min. It is representative of 3 independent repeats with similar results.
B. Volume of MC38 tumors (5×10⁵ cells/mouse, s.c.) in Ifnar1+/+ and Ifnar1ΔCD8 mice that were administered with Rucaparib (Ruc, 40mg/kg) or vehicle every other day from d7. Two-way ANNOVA. **P = 0.0034, ****P < 0.0001. Ifnar1+/+ +Veh, Ifnar1ΔCD8 +Veh, and Ifnar1ΔCD8 +Ruc, n = 5 mice; Ifnar1+/+ +Ruc, n = 7 mice.
C. The Kaplan-Meier analysis of survival from Fig. 7B. Log-rank (Mantel-Cox) test. **P = 0.0046, *P = 0.0230. Ifnar1+/+ +Veh, Ifnar1ΔCD8 +Veh, and Ifnar1ΔCD8 +Ruc, n = 5 mice; Ifnar1+/+ +Ruc, n = 7 mice.
D. Growth of hCD19-B16F10 tumors (5×10⁵ cells/mouse, s.c.) in NSG mice that were administered with WT or Parp11−/− CD19-BBz CAR T cells (106 /mouse, i.v. at d7) and Rucaparib (20mg/kg by oral gavage at d10, 12, 14) or vehicle. Two-way ANNOVA. ****P < 0.0001. n = 5 mice.
E. IFNAR1 levels on Meso-BBz CAR T (±Ruc, 10μM, 72h) and treated with or without adenosine (Ado, 1mM, 24h). Two-tailed unpaired t-test. ****P < 0.0001. Veh treated with or without Ado, n = 4 independently treated cell cultures; Ruc treated with Veh, n = 6 independently treated cell cultures; Ruc treated with Ado, n = 5 independently treated cell cultures.
F. Killing efficacy of human Meso-BBz CAR T (± Ruc, 10μM, 72h), then treated with adenosine (Ado, 1mM, 24h) cocultured with EM-Meso-GFP-Luc cells (E:T =10:1). One-way ANNOVA. ****P < 0.0001. n = 6 independently treated cell cultures.
G. Growth of EM-Meso-GFP-Luc tumors (1×10⁶ cells/mouse, s.c.) in NSG mice that were administered with 0.5×10⁶ Meso-BBz CAR T cells (i.v) on Day 7 and Rucaparib (40mg/kg) or vehicle every other day from Day 7 for 6 times. Two-way ANNOVA. ****P < 0.0001. Control, n = 3 mice; Ruc, Meso CAR T +Veh, Meso CAR T+Ruc, n = 5 mice.
H. The Kaplan-Meier analysis of survival from Fig. 7G. Log-rank (Mantel-Cox) test. **P < 0.01. Control, n = 3 mice; Ruc, Meso CAR T +Veh, Meso CAR T+Ruc, n = 5 mice.
Importantly, addition of Rucaparib notably preserved IFNAR1 levels (Fig 7E) and tumoricidal activities (Fig 7F) in adenosine treated human Meso CAR T cells. Furthermore, combination of Rucaparib with transfer of these Meso CAR T cells in immunocompromised mice harboring the mesothelin-expressing tumors exhibited a significantly increased efficacy compared with monotherapy with either of these agents (Fig 7G–H).
DISCUSSION
Studies described here support a mechanism that facilitates inactivation of CTL and formation of the immune privileged niche inside solid tumors. We demonstrate that PARP11, which is induced and hyperactivated in response to adenosine (and likely many other factors present in the TME), acts to stabilize β-TrCP, which in turn, facilitates accelerated ubiquitination and degradation of IFNAR1. This partial loss of IFNAR1 undermines the cytolytic activity of CTLs (this work) and decrease their viability 19.
Findings presented here reveal that even a partial loss of IFNAR1 on the intratumoral CTL contributes to the immune suppressive effects of adenosine and Treg cells, whose ability to produce adenosine is important for their function 40. The sequelae of IFNAR1 downregulation in CTL include their decreased viability (likely due to inactivation of the interleukin-2 pathway 19) and the impairment of tumoricidal activities demonstrated here. IFN1 provides a “third signal” to support the clonal expansion of CD8+ T cells 16–18. Whereas complete genetic ablation of IFNAR1 in anti-viral CTL interfered with their cytolytic activities 41, even a modest IFNAR1 downregulation on intratumoral CTL was associated with decreased expression of cytolytic mediators and tumoricidal activity.
Such sensitivity of CTL to high receptor density suggests that activation of CTL by IFN1 represents a highly tunable type of effect (reviewed in 42) and, hence, could be modulated for therapeutic purposes. Both IFNAR1 phosphorylation and expression of β-TrCP E3 ligase are required for efficient IFNAR1 ubiquitination and downregulation 12. Accordingly, targeting either p38 kinase or the PARP11-β-TrCP axis significantly improved tumoricidal activities of CTL in the TME.
Adenosine did not affect the levels of β-TrCP mRNA in CTL. Thus, it is plausible that adenosine elicits stabilization of β-TrCP protein by stimulating expression and catalytic activity of PARP11. As a result, increased PARP11-dependent mono-ADP-ribosylation of β-TrCP will protect this protein from ubiquitination and subsequent proteasomal degradation 25 otherwise facilitated by its partner proteins within the SCF- β-TrCP E3 ubiquitin ligase 33. In turn, stabilized β-TrCP facilitates rapid downregulation of IFNAR1 25. Additional studies will test this possibility; however, it is also important not to rule out that other elements and conditions of the immune suppressive TME may further contribute via upregulating β-TrCP mRNA. The latter can be induced by the Wnt ligands 24, which are excessively secreted by non-malignant components of the TME 43.
Whereas future studies will help to understand the mechanisms underlying the induction and activation of PARP11 in the intratumoral T cells by the tumor-derived factors, the findings presented here highlight the importance of PARP11-mediated inactivation of CTL as a major driving force for immune suppression in the TME. Inactivation of PARP11 and ensuing degradation of β-TrCP is expected to stabilize IFNAR1 and improve CTL activities under exposure to many TME factors and conditions thereby making this approach advantageous over specific inhibitors of adenosine signaling.
In the context of developing more efficient CAR T cells, inactivation of PARP11 or/and p38 is technologically more advantageous than the expression of stabilized IFNAR1SA mutant, which causes unfolded protein response 44 and restricts proliferation of T cells (Fig 1 and 19). Furthermore, restoring the sensitivity to IFN1 specifically in T cells might be important because hyperactivation of the IFN pathways in malignant cells promotes tumor growth and undermines the efficacy of immunotherapies 45,46. This effect in malignant cell probably contributes to a paradoxical role of IFNAR1 in CAR T cells when these are combined with oncolytic virus producing massive amounts of IFN1 in the TME 47.
Promising results have been reported for combination of already available ADP ribosylation inhibitors (including Rucaparib) with immune checkpoint blocking agents (reviewed in 48). Within this context, our findings warrant a prompt development of potent, selective and bioavailable PARP11 inhibitors and add an impetus to clinical trials that combine such agents with immune and other types of anti-cancer therapies.
Furthermore, along with the lack of suitable antigenic targets, immune suppressive effects of the TME are considered the major mechanism of resistance of solid tumors to CAR T cell therapy (reviewed in 37). This study provides clear rationale for novel approaches to CAR engineering and combinatorial therapeutic regimens with the goal of targeting ADP ribosylation and downregulation of IFNAR1 to increase the efficacy of CAR T cell therapy in solid tumors.
Methods
Study Approvals
Use of human T cells that were previously collected from healthy donors under informed consent and could not be directly or indirectly linked to individual human subjects was approved for the Human Immunology Core by IRB of the University of Pennsylvania. All animal experiments were approved by the Institutional Animal Care and Use Committee of the University of Pennsylvania and were carried out in accordance with the IACUC guidelines.
Animal studies.
All mice had water ad libitum and were fed regular chow. Mice were maintained in a specific-pathogen-free facility in accordance with American Association for Laboratory Animal Science guidelines. Mice were housed in single-sex cages at 20 ± 2 °C under a 12-h light/12-h dark photoperiod with the lights on at 7:00. C57BL/6 littermate Ifnar1+/+ (‘WT’) and Ifnar1S526A mice (SA) were described previously; the SA mice were donated to Jackson Labs and are available from this source (C57BL/6-Ifnar1tm1.1Syfu/J; stock No. 035564). As described previously, Parp11 knockout mice exhibited teratozoospermia and male infertility but otherwise developed normally and did not display any overt pathology 34.
Ifnar1−/− mice (B6(Cg)-Ifnar1tm1.2Ees/J; stock No. 028288), Ifnar1f/f mice (B6(Cg)-Ifnar1tm1.1Ees/J, stock No. 028256), C57BL/6-Tg(Cd8a-cre)1Itan/J (CD8-cre, stock No.008766) and NOD.Cg-Prkdcscid Il2rgtm1Wjl/SzJ (NSG, stock No.005557) mice were purchased from Jackson Laboratory. CD8-cre mice were crossed with Ifnar1f/f mice to generate CD8-cre::Ifnar1+/+ (WT) mice and CD8-cre:: Ifnar1f/f (Ifnar1ΔCD8) litter-mates. All these mice were viable and fertile with no reported abnormalities. The genotyping PCR primers are provided in Supplementary Table 1. Littermate animals from different cages were randomly assigned into the experimental groups. These randomized experimental cohorts were either co-housed or systematically exposed to the bedding of other groups to ensure equal exposure to the microbiota of all groups.
Reagents and constructs
Adenosine (Sigma, A4036), TGF-β (R&D 7666-MB-005/CF), prostaglandin E2 (PGE2, Sigma, P0409), Rucaparib (Sellekchem, S1098), and CPI-444 (Medkoo Biosciences, 206848) were purchased. Retroviral vectors for transduction of PARP11-null CTL with control (GFP-Con) virus or viruses for expression of WT or catalytically inactive HYmu PARP11 mutant was carried out as described elsewhere 25.
Cell lines and tumor-conditioned medium (TCM) preparation.
Mouse cell lines MC38, B16F10, LLC and EL4 and human Jurkat, NALM6 and 293T cells were purchased form ATCC and maintained according to ATCC recommendations. Mouse B16F10 cells bearing human CD19 (hCD19-B16F10) were generated by transduction and subsequent selection. Mouse MC38OVA and human EM-Meso-GFP-Luc cell line were generously provided by Dr. Susan Ostrand-Rosenberg (University of Maryland, Baltimore, USA) and by Dr. Edmund Moon (University of Pennsylvania, Philadelphia, USA), respectively. MC38OVA and hCD19-B16F10 cells were further engineered to stably express Firefly luciferase. EM-Meso-GFP-Luc cell were maintained in DMEM (Gibco) supplemented with 10% FBS (HyClone) and 100 U/ml Penicillin-Streptomycin (Gibco). Tumor-conditioned media (TCM) were prepared as previously described 49. For in vitro treatments, we used serum-free media (SFM) or TCM added to complete media at the 3:1 ratio.
Tumor models.
MC38, B16F10, and LLC tumors were s.c. injected into the right flank of the indicated syngeneic mice. EM-Meso-GFP-Luc and hCD19-B16F10 were s.c. injected into the right flank of NSG mice. Tumor volumes were measured using caliper 3 times per week starting at Day 7 after inoculation. The maximal tumor size is 1000mm3 and the maximal tumor size was not exceeded.
Human or mouse CAR T cells preparation
Human or mouse T cells were activated with magnetic beads precoated with agonist antibodies against CD3 and CD28 (Gibco) according to the instruction. Then human T cells were transduced with CD19-BBz or Meso-BBz CAR at day 1 and expanded for 10 days or harvested at specific timepoints for analysis. Mouse T cells were spin transduced CD19-BBz or Meso-BBz CAR at day 2 and expanded for 5 days for in vitro or in vivo function studies.
scRNA-seq analysis
scRNA-seq libraries were prepared following protocol from Chromium Controller 10X Genomics and then sequenced using Illumina Nextseq 550. BCL files were generated for further analysis. Alignment, filtering, barcode counting, and unique molecular identifier counting were performed using Cell Ranger v.4.0.0 (https://support.10xgenomics.com/single-cell-gene-expression/software/overview/welcome). Data were further analyzed using Seurat v.3.1.5 (https://satijalab.org/seurat/). Cells with at least 500 detected genes, at least 1000 detected RNA, and no more than 50000 RNA were included in downstream analyses. Raw unique molecular identifier counts were normalized to unique molecular identifier count per million total counts and log transformed, using NormalizeData function. Data were scaled with regression to nCount RNA and group (WT vs SA), using ScaleData function. Variable genes were selected based on average expression and dispersion. Principal component analysis was performed with default settings. Clusters and t-SNE plots were generated based on selected principal component analysis dimensions. t-SNE plots and dot plots showing the expression of labeled genes were performed using FeaturePlot and DotPlot functions. Differential gene expression analysis was performed using FindMarkers function with following parameters: min.cells.group = 1, min.cells.feature = 1, min.pct = 0, logfc.threshold = 0, only.pos = FALSE. Resulted output (ave_logFC) was utilized as input for Geneset Enrichment Analysis (GSEA) with prerank mode. Data have been submitted to Gene Expression Omnibus (GEO accession No. 171055).
Flow cytometry analysis
Tumors or spleens were collected and incubated in dissociation solution with 2mg/ml Collagenase II (MP Biomedicals), or 1 mg/ml Collagenase IV (Roche) plus 100 μg/ml DNase I (Roche) for 1 h with continuous agitation. Cells were filtered by 70 μm cell strainer and resuspended with FACS buffer (PBS with 1% BSA, 1mM EDTA). The isolated cells were incubated with anti-mouse CD16/CD32 antibody (BioLegend, Clone 93 cat. no. 101302, 1:50) for 15 min on ice to block nonspecific Fc receptor binding. Cells were then stained with cell surface markers for 30 min on ice. For FOXP3 intracellular staining, cells were stained according to recommendations of the manufacturer of the eBioscience™ Foxp3 / Transcription Factor Staining Buffer Set (Cat No: 00–5523-00). For intracellular staining, cells were stimulated with PMA, ionomycin, and Golgi-stop for 6h as described elsewhere 19. The flow antibodies are listed in Supplementary Table 2. The samples were acquired by LSRFortessa flow cytometry (FACS Diva software version 7, BD Biosciences). Data were analyzed with FlowJo software (Flowjo V9.9.6 (BD)).
Immunoprecipitation, immunoblot, ubiquitination and ADP ribosylation assays were carried out as previously described 23,25. For analysis of IFNAR1 ubiquitination, anti-IFNAR1 EA12 antibody (10μg/sample) was added to 500μg protein cell lysate and incubated with rotation at 4oC overnight. The protein G-Sepharose beads were added to the supernatant for 4h. The immunocomplexes were washed 3 times with lysis buffer and then analyzed by immunoblot using mono- and polyubiquitinylated conjugates monoclonal antibody (FK2) (Enzo Life Sciences). Polyclonal antibody against phospho-Ser532-IFNAR1 50 and monoclonal antibody for immunoprecipitation of human IFNAR1 (EA12, 51) were previously described.
Mono-ADP-ribosylation of β-TrCP (immunoprecipitated using antibody against β-TrCP or HA tag) was detected by western blotting using ADP-ribosylation antibody (Millipore, MABE1075).
The in vitro ADP-ribosylation assay was carried out as previously described. Briefly, 293T cells were transfected with Myc–β-TrCP or Flag–PARP11 expression vectors. Forty-eight hours after transfection, cells expressing Flag–PARP11 were treated with adenosine (1mM, 30min) or PBS.
Whole-cell lysates were subjected to immunoprecipitation with anti-Myc beads or FLAG (M2) beads, respectively. Flag–PARP11 was then eluted with FLAG peptide (Sigma). The eluted Flag–PARP11 was incubated with beads-immobilized Myc–β-TrCP or control IgG immunoprecipitated in the presence of 100 μM Biotin-NAD+ in 50 mM Tris–HCl buffer (pH 7.4) for 1 h at room temperature. ADP-ribosylation of Myc–β-TrCP was detected by western blotting using streptavidin–HRP after SDS–PAGE.
The commercially available antibodies listed in Supplementary Table 2.
Quantitative PCR (qPCR)
Total RNA was extracted using Trizol reagent (Invitrogen). The High-Capacity RNA-to-cDNA Kit (Applied Biosystems) was used to make complementary DNA. Real-time PCR was performed using SYBR Green Master Mix reagents (Applied Biosystems). The expression of each gene was calculated based on the cycle threshold, set within the linear range of DNA amplification. The relative expression was calculated by the cycle threshold method, with normalization of raw data to a housekeeping gene. The primer sequences are provided in Supplementary Table 3.
Differentition of iTreg and isolation of Treg cells from tumor tissues
Mouse iTreg were differentiated from naive CD4+ T cells using the commercial CellXVivo Treg cell differentiation kits (CDK007, R&D). Briefly, naive CD4+ T cells were isolated from mice spleens and activated by plate coated anti-CD3 (10 μg/mL), anti-CD28 (2 μg/mL) antibodies in the presence of TGF-β (10 ng/mL) and IL-2 (2 ng/mL) for 5–7 days. The yield and purity of Treg fraction was monitored by analysis of CD4+Foxp3+ cells using flow cytometry. iTreg were not restimulated before coculture with the target cells.
Intratumoral Treg cells were isolated from MC38 tumors grown in WT mice using MACS separation kit (Miltenyi Biotec). Isolated Tregs were cocultured with OT-1 cells at the ratio=1:3 and the OT-1 cell toxicity was determined as described in the next section.
Cytotoxicity assays.
The ability of CTL (including OT-1, Meso-BBz CAR T cells or CAR T-hCD19-BBz cells) to kill target cells expressing luciferase and either OVA or mesothelin or hCD19 was evaluated in a luciferase-based cytotoxicity assay. Target cells were cocultured with CTL at the indicated E:T ratios in 96-well black plate at a total volume of 200 μL. Target cells alone were seeded in parallel at the same density to quantify the spontaneous death luciferase expression (relative luminescent units; spontaneous death RLU). Target cells with water considered as the maximal killing (maximal killing RLU). Following coculture, 100 μl of luciferase substrate (Bright-Glo; Promega) was added to the remaining supernatant and cells. Luminescence was measured after a 10 min incubation using the EnVision (PerkinElmer) plate reader. The percent cell lysis was obtained using the following calculation: % lysis=100x (spontaneous death RLU- test RLU)/(spontaneous death RLU- maximal killing RLU).
Chemical inhibitors in vivo treatment.
A2AR inhibitor CPI-444 (Medkoo Biosciences, 206848) was dissolved in 40% hydroxypropyl beta-cyclodextrin and administered by oral gavage from day 1 at the dose of 10mg/kg daily for 12 days after MC38 inoculation. PARP inhibitor Rucaparib (Selleckchem, S1098) were dissolved in 5% DMSO + 30% PGE300 +10% Tween80 and administered by oral gavage at the dose of 20mg/kg or 40mg/kg every other day from day 7 after MC38 inoculation.
CRISPR-Cas9 mediated gene knock outs.
We used the Cas9 lentivirus to infect EL4 cells and selected by blasticidin. Then sgRNA lentivirus for indicated genes was added to infect Cas9-EL4 and selected by puromycin. The sgRNA sequences were listed in Supplementary Table 4.
To CRISPR out PARP11 in human T cells, primary T cells were stimulated with Dynabeads Human T cell expander CD3/CD28 (Invitrogen) (T cells: beads= 1:3) for 24h and transduced with sgRNA lentivirus (lentiCRISPR v2, Addgene) and Meso- CAR virus. 24h later, the T cells were selected by puromycin and the harvested on d7 and then utilized for the in vitro and in vivo studies. The sgRNA sequences were listed in Supplementary Table 4.
Statistics and reproducibility.
Littermate animals from different cages were randomly assigned into the experimental groups. These randomized experimental cohorts were either co-housed or systematically exposed to the bedding of other groups to ensure equal exposure to the microbiota of all groups. Data collection and analysis were not performed blind to the conditions of the experiments. All described results are representative of at least three independent experiments unless specifically stated otherwise. Statistical analyses and the number of samples (n) were described in detail for each figure panel. No statistical method was used to predetermine sample size. No data were excluded from the analyses. Data were presented as average ± SEM. Statistical analysis was performed using Microsoft Excel (Microsoft) or GraphPad Prism 8 software (GraphPad). Two-tailed unpaired Student’s t-test was used for the comparison between two groups. One-way analysis of variance (ANOVA) or two-way ANOVA followed by the Tukey’s test was used for the multiple comparisons. Repeated-measures two-way ANOVA (mixed model) followed by the Tukey`s multiple comparisons test was used for analysis of the tumor growth curve. The Kaplan–Meier curves were used to depict the survival function from lifetime data for mice and human patients; the Log-rank (Mantel-Cox) test or Gehan–Breslow–Wilcoxon test was used to analyze the differences between the groups. A value of P < 0.05 was considered significant. Henceforth asterisks: *p< 0.05; **p< 0.01; ***p<0.001; ****p<0.0001; ns, not significant.
Reporting Summary
All the antibodies are validated for the use of immunofluorescence, IP, and western blot analyses. Data are available on the manufacturès website. The antibodies have been validated by the manufacturer and, or in this paper. Further information on research design is available in the Nature Research Reporting Summary linked to this article.
Data availability
Mouse scRNAseq data are all available on GEO (accession number: GSE171055). Source data have been provided as Source Data files. All other data supporting the findings of this study are available from the corresponding author on reasonable request.
Extended Data
Extended Data Fig. 1. Downregulation of IFNAR1 on the intratumoral CTL undermines their activities.
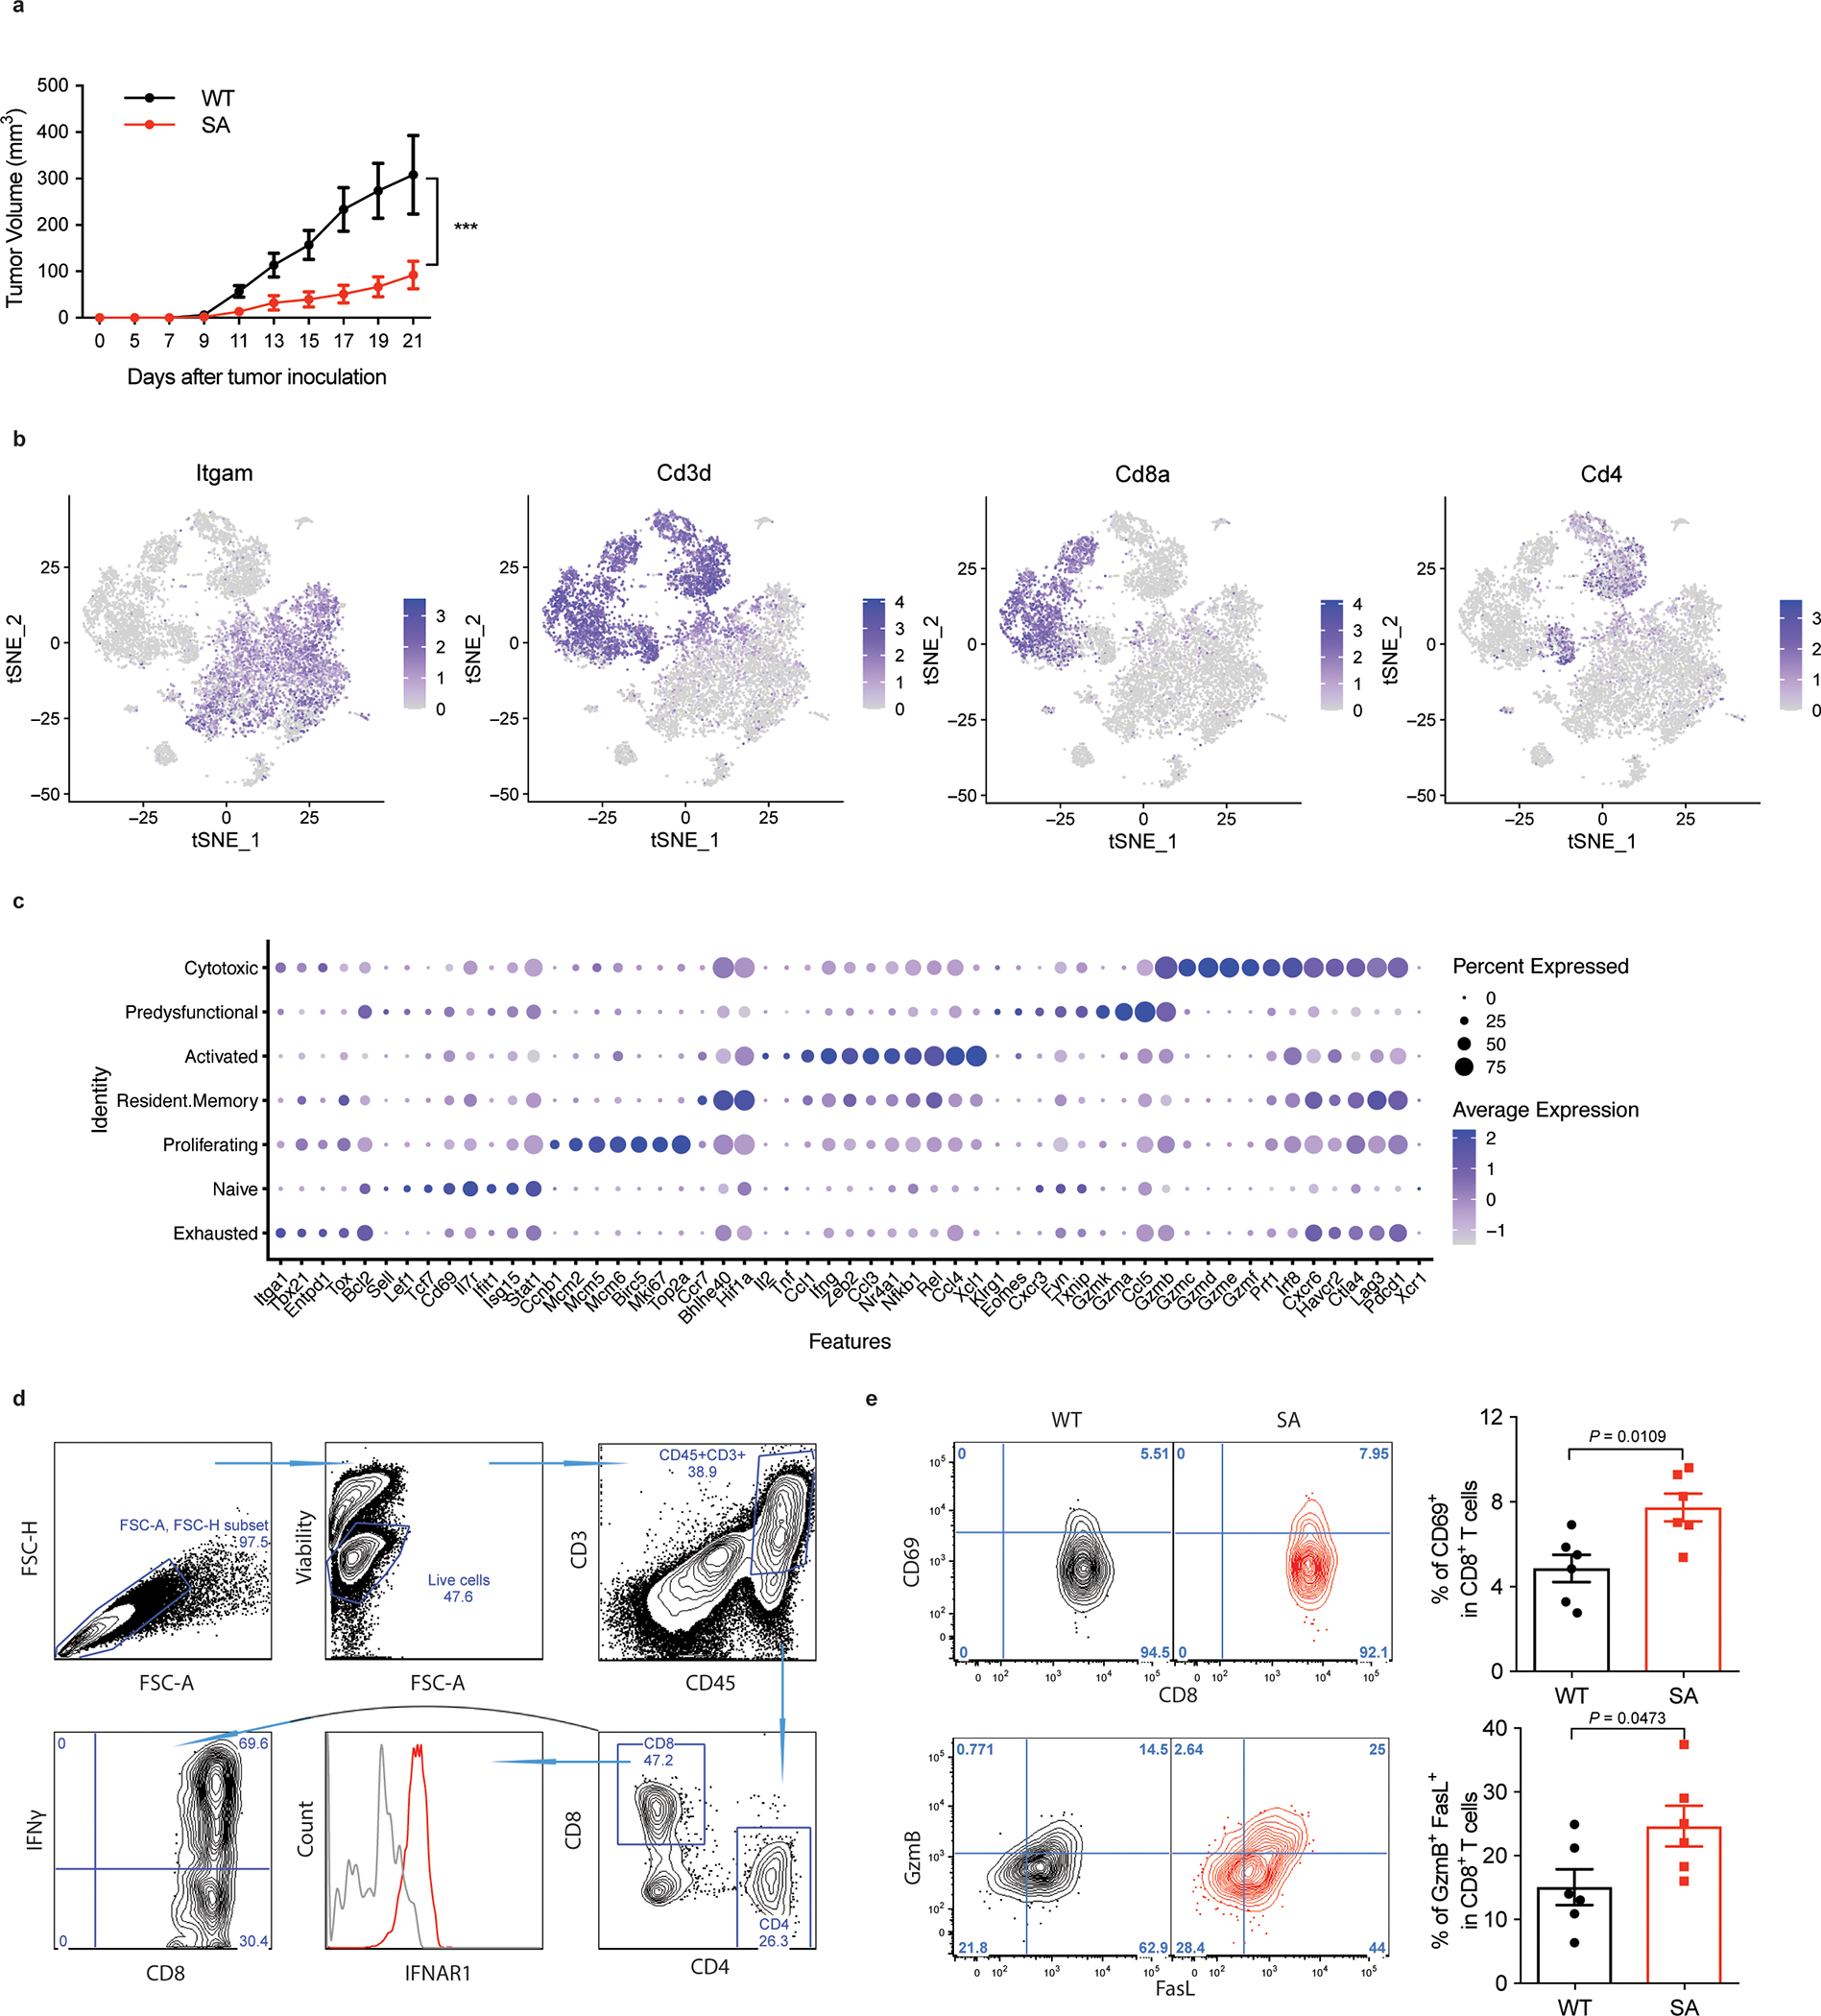
A. Growth of MC38 tumors (1×10⁶/mouse) after s.c. injection into WT and SA mice. Tumor volumes were measured 3 times per week. Data are shown as mean ± SEM (WT, n = 8 mice; SA, n = 5 mice). Statistical analysis was performed using two-way ANOVA with Tukey`s multiple comparisons test. ***P = 0.0004.
B. t-SNE plots showing the expression of Itgam, Cd3d, Cd8a and Cd4. Transcript levels are color-coded. N=9,725 cells.
C. Dot plots showing the expression of CD8+ T cell function relevant genes that are highly expressed in each cluster. The size of the dot corresponds to the percentage of cells expressing the gene in each group and the color represents the average expression level. WT, n = 2075 cells; SA, n = 2038 cells.
D. Flow cytometry gating strategies in analysis of cellular components of tumor tissues.
E. Flow cytometry analysis of CD69+ and FasL+ GzmB+ cells gated on CD45+CD3+CD8+ T cells in indicated tumor tissues. Data are shown as mean ± SEM (n = 6 mice for each group). Two-tailed unpaired t-test was performed for the comparisons between groups.
Extended Data Fig. 2. Downregulation of CTL IFNAR1 by Treg and adenosine.
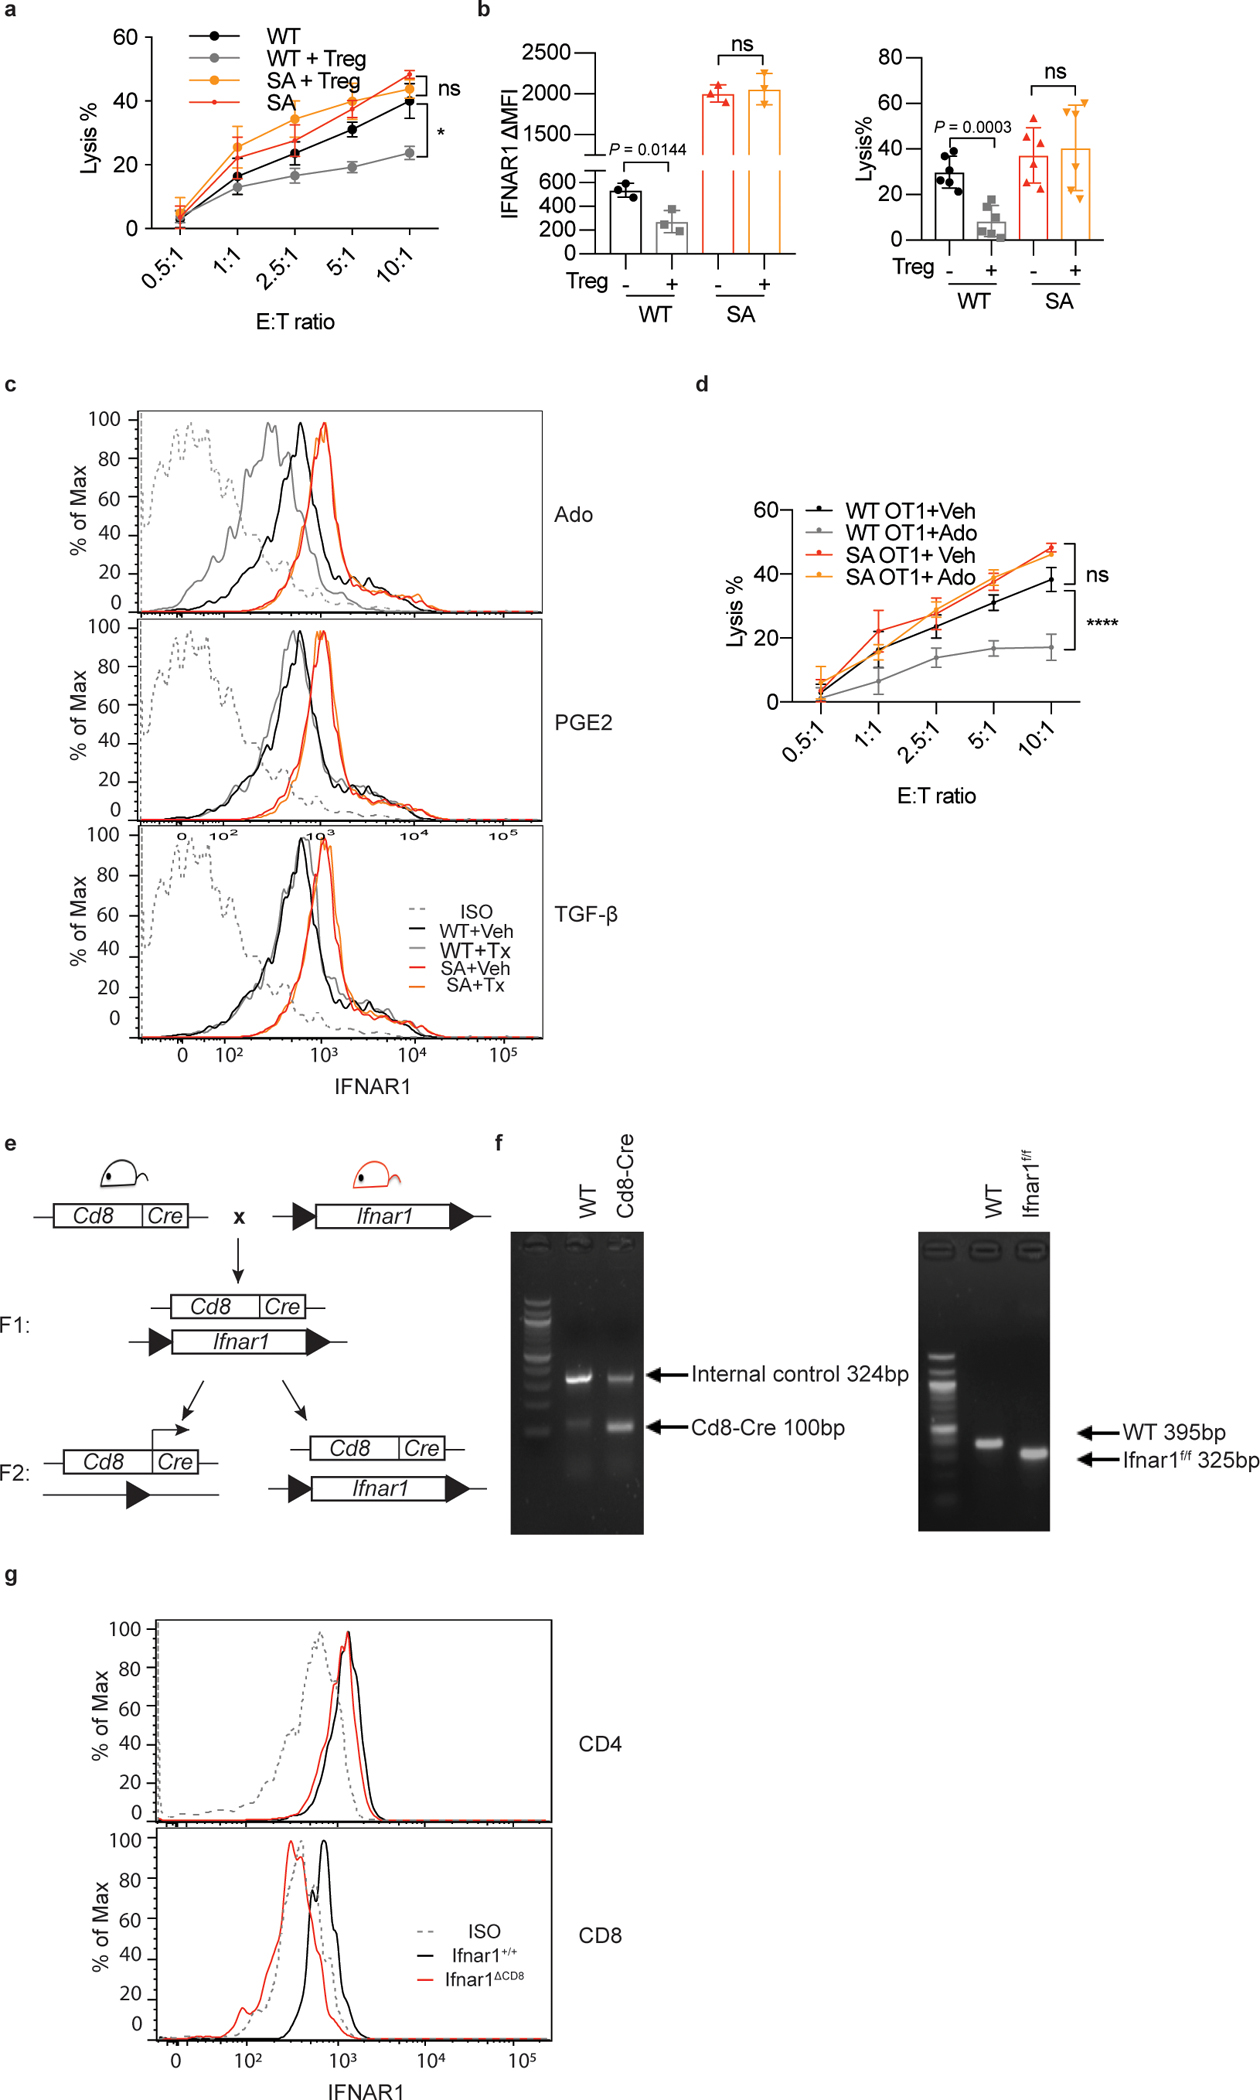
A. WT or SA OT-1 cells were first co-cultured with or without iTregs for 24h (Treg:OT-1=1:3) and then combined with MC38OVA-luc cells at indicated E:T ratios. Killing of MC38OVA-luc cells was analyzed using luciferase assay as described in Methods. Data are shown as mean ± SEM (n = 3 co-cultures.) Statistical analysis was performed using two-way ANOVA with Tukey`s multiple comparisons test. *P = 0.0288.
B. Tumor associated Tregs were isolated from MC38 WT tumors and cocultured with OT-1 cells for 24h (Treg: OT-1=1:3). Then analysis of IFNAR1 levels on OT-1 CTL as well as killing of MC38OVA-luc cells (co-cultured at ratio E:T=10:1) was performed as described in Methods. Data are shown as mean ± SEM (WT and SA IFNAR1, n = 3 co-cultures; WT and SA lysis%, n = 6 co-cultures Statistical analysis was performed using ordinary one-way ANOVA with Tukey`s multiple comparisons test.
C. Representative flow cytometry analysis of levels of IFNAR1 on the surface of CD3+CD8+ T cells treated with or without adenosine (Ado, 1mM) prostaglandin E2 (PGE2, 1μg/ml) or tumor growth factor-beta (TGF-β, 5ng/ml) for 2h.
D. Lysis of MC38OVA-luc cells co-cultured in vitro with OT-1 cells pretreated or not with adenosine (Ado, 1mM for 24h) at indicated E:T ratios. Data are shown as mean ± SEM (n = 3 co-cultures). Statistical analysis was performed using two-way ANOVA with Tukey`s multiple comparisons test. ****P < 0.0001.
E. Schematic of crosses to generate the Ifnar1ΔCD8 mice.
F. Genotyping analysis of Ifnar1ΔCD8 mice by PCR.
G. Validation of Ifnar1 ablation in CD8+ cells using the flow cytometry analysis of IFNAR1 levels on the surface of CD4+ and CD8+ T cells in Ifnar1+/+ and Ifnar1ΔCD8 mice. It is representative of n = 3 independent experiments.
Extended Data Fig. 3. PARP11 regulates IFNAR1 downregulation in CD8+ T cells.

A. qPCR analysis of mRNA of indicated genes in Jurkat cells treated with adenosine (Ado, 1mM) for 30 min. Data are shown as mean ± SEM (n = 3 independently treated cell cultures.). Statistical analysis was performed using ordinary one-way ANOVA with Tukey`s multiple comparisons test. ****P < 0.0001.
B. Flow cytometry analysis of IFNAR1 levels in EL4 cells, in which indicated genes were knocked out by sgRNA mediated CRISPR-Cas9. Data are shown as mean ± SEM. n = 6 independently treated cell cultures. Statistical analysis was performed using ordinary one-way ANOVA with Tukey`s multiple comparisons test. ****P < 0.0001.
C. Immunoblot and qPCR analysis of efficiency of indicated genes knock out (due to the lack of PARP11-specific antibodies, levels of expression of PARP11 is demonstrated by showing the product of qPCR). Levels of β-actin and β-tubulin are shown as loading controls.
D. ADP-ribosylation of HA-β-TrCP immunoprecipitated from 293T cells treated or not with adenosine (Ado, 1mM, 30min) as indicated. After treatment, levels of HA-β-TrCP in the whole cell lysate (WCL) was analyzed by immunoblotting. Normalized amounts of lysate containing comparable levels of HA-β-TrCP were taken into immunoprecipitation with HA antibody, which was then analyzed by immunoblotting using anti-ADP-ribose antibody and HA antibody. It is representative of 3 independent repeats with similar results.
E. Representative genotyping of Parp11−/− and Ifnar1−/− mice.
F. Representative flow cytometry data for Fig 3G–H.
G. Representative flow cytometry data for Fig 3J.
H. Representative flow cytometry data for Fig 3K.
Extended Data Fig. 4. Inactivation of intratumoral CTL and robust tumor growth require IFNAR1-dependent function of PARP11 in the TME.
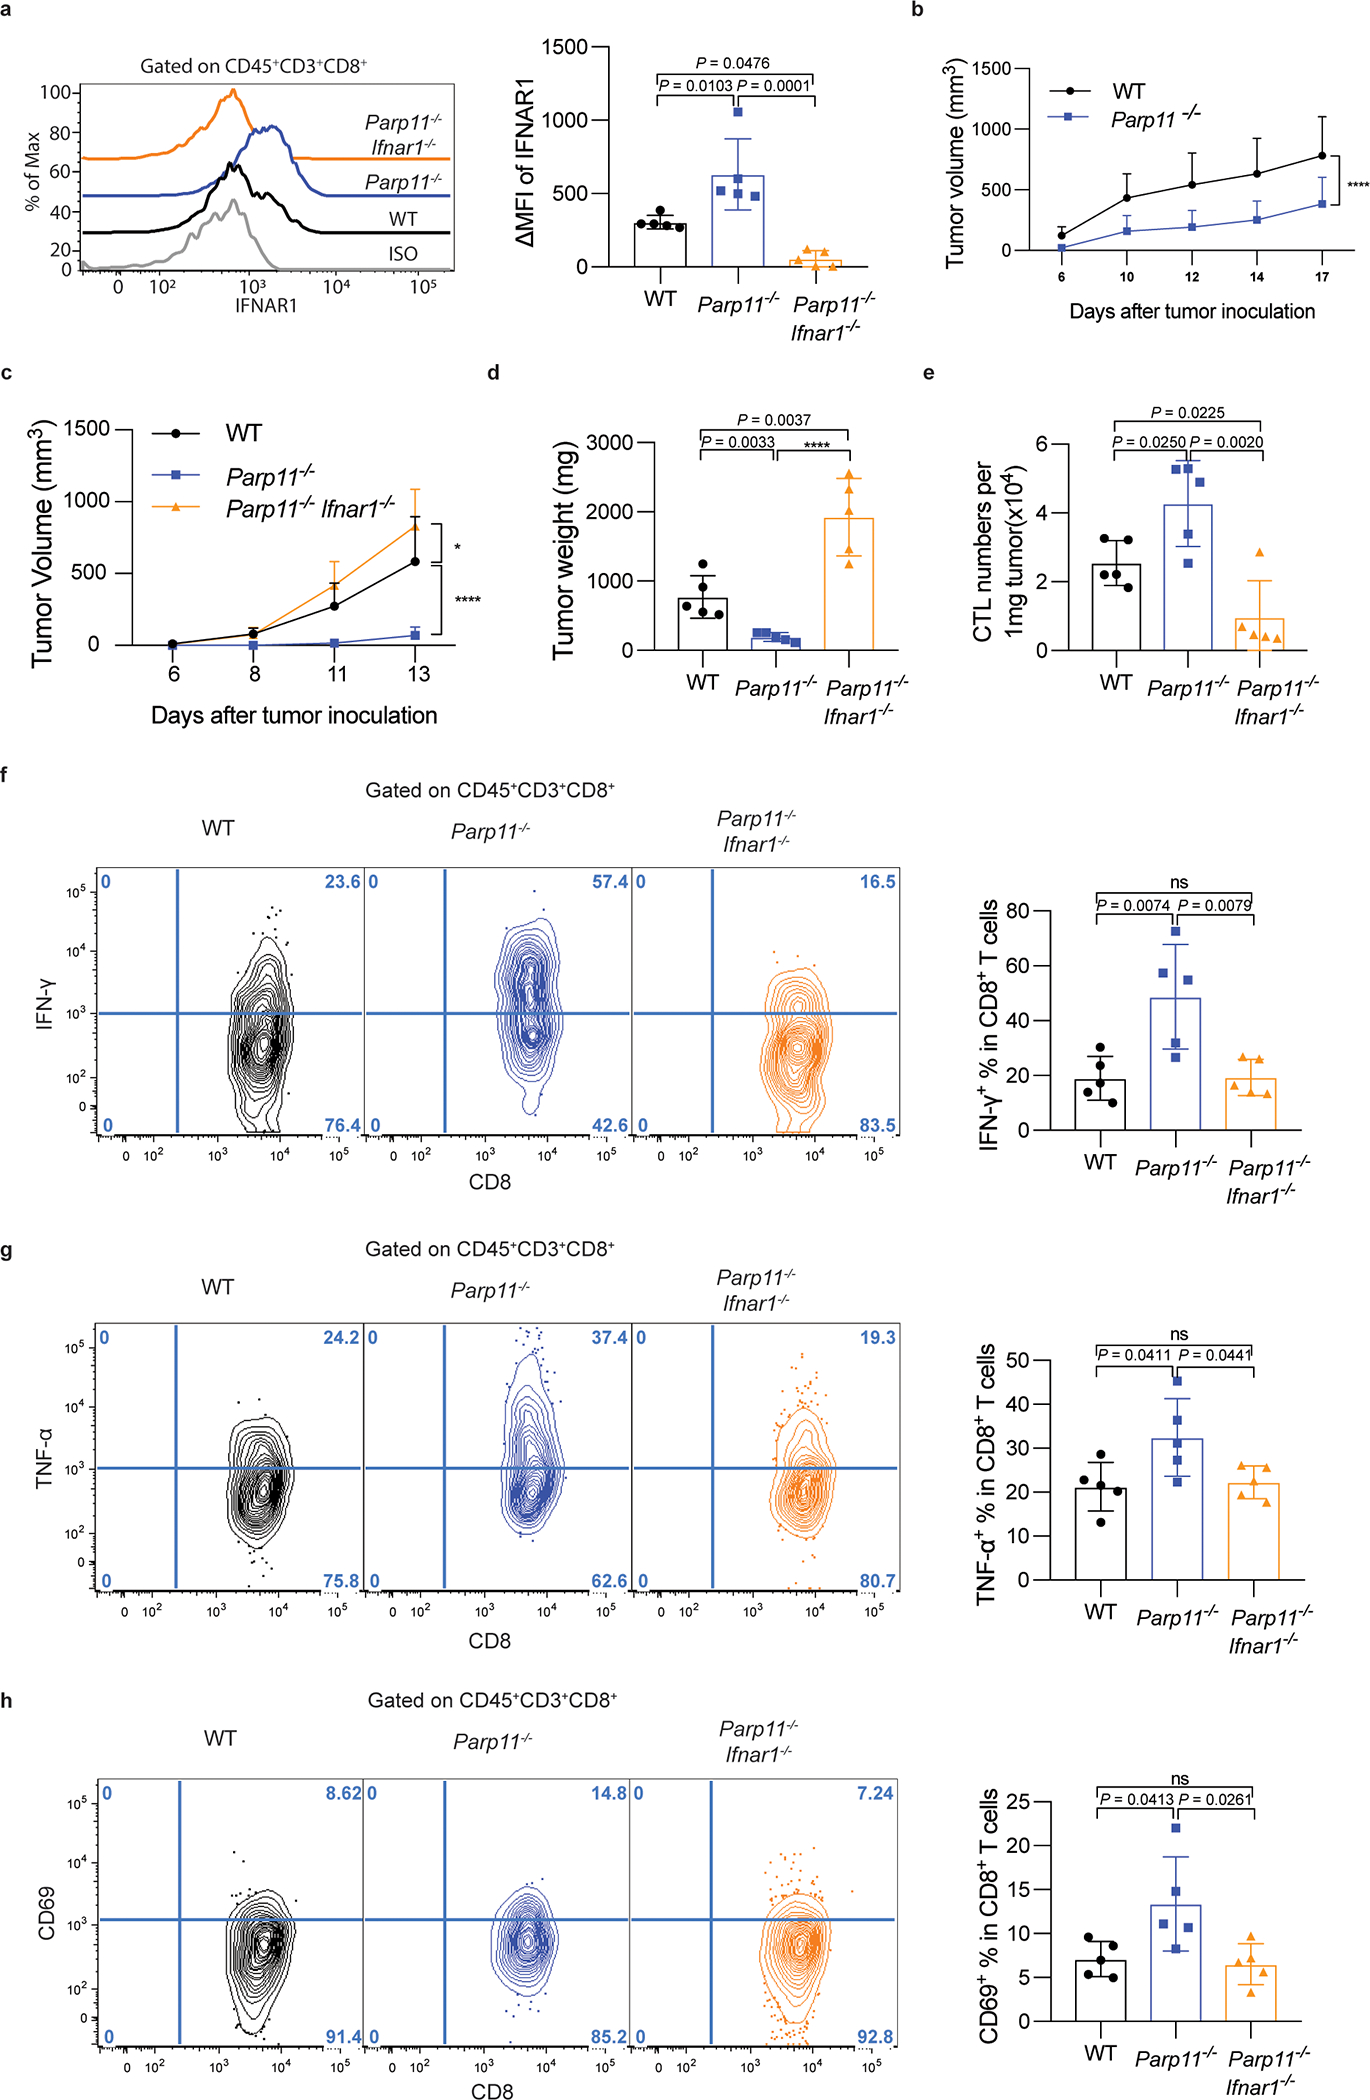
A. Flow cytometry analysis of levels of IFNAR1 on the surface of CD45+CD3+CD8+ T cells in tumor tissues from WT, Parp11−/−, and Parp11−/−Ifnar1−/− mice 13 days after inoculation of s.c. B16F10 tumors (0.5×10⁵/ mouse). Statistical analysis was performed using ordinary one-way ANOVA with Tukey`s multiple comparisons test. n = 5 mice.
B. Growth of s.c. LLC tumors (1×10⁶/ mouse) inoculated into WT or Parp11−/− mice. Statistical analysis was performed using two-way ANOVA with Tukey`s multiple comparisons test. ****P < 0.0001. WT, n = 6 mice; Parp11−/−, n= = 5 mice.
C. Growth of s.c. B16F10 tumor cells (0.5×10⁵/ mouse) inoculated into WT, Parp11−/−, or Parp11−/−Ifnar1−/− mice. Statistical analysis was performed using two-way ANOVA with Tukey`s multiple comparisons test. *P =0.0387, ****P < 0.0001. n = 5 mice.
D. Quantification of B16F10 tumor weights in mice of indicated genotypes at day 13 after inoculation. Statistical analysis was performed using ordinary one-way ANOVA with Tukey`s multiple comparisons test. ****P < 0.0001. n = 5 mice.
E. Flow cytometry analysis of numbers of CD8+ T cells in B16F10 tumors growing in indicated mice. Statistical analysis was performed using ordinary one-way ANOVA with Tukey`s multiple comparisons test. ***P = 0.0007. n = 5 mice.
F. Flow cytometry analysis of IFN-γ+ cells gated on CD45+CD3+CD8+ T cells in B16F10 tumors growing in indicated mice. Statistical analysis was performed using ordinary one-way ANOVA with Tukey`s multiple comparisons test. n = 5 mice.
G. Flow cytometry analysis of TNF-α+ cells gated on CD45+CD3+CD8+ T cells in B16F10 tumors growing in indicated mice. Statistical analysis was performed using ordinary one-way ANOVA with Tukey`s multiple comparisons test. n = 5 mice.
H. Flow cytometry analysis of CD69+ cells gated on CD45+CD3+CD8+ T cells in B16F10 tumors growing in indicated mice. Statistical analysis was performed using ordinary one-way ANOVA with Tukey`s multiple comparisons test. n = 5 mice.
Extended Data Fig. 5. PARP11 undermines tumoricidal activities of CAR T cells.
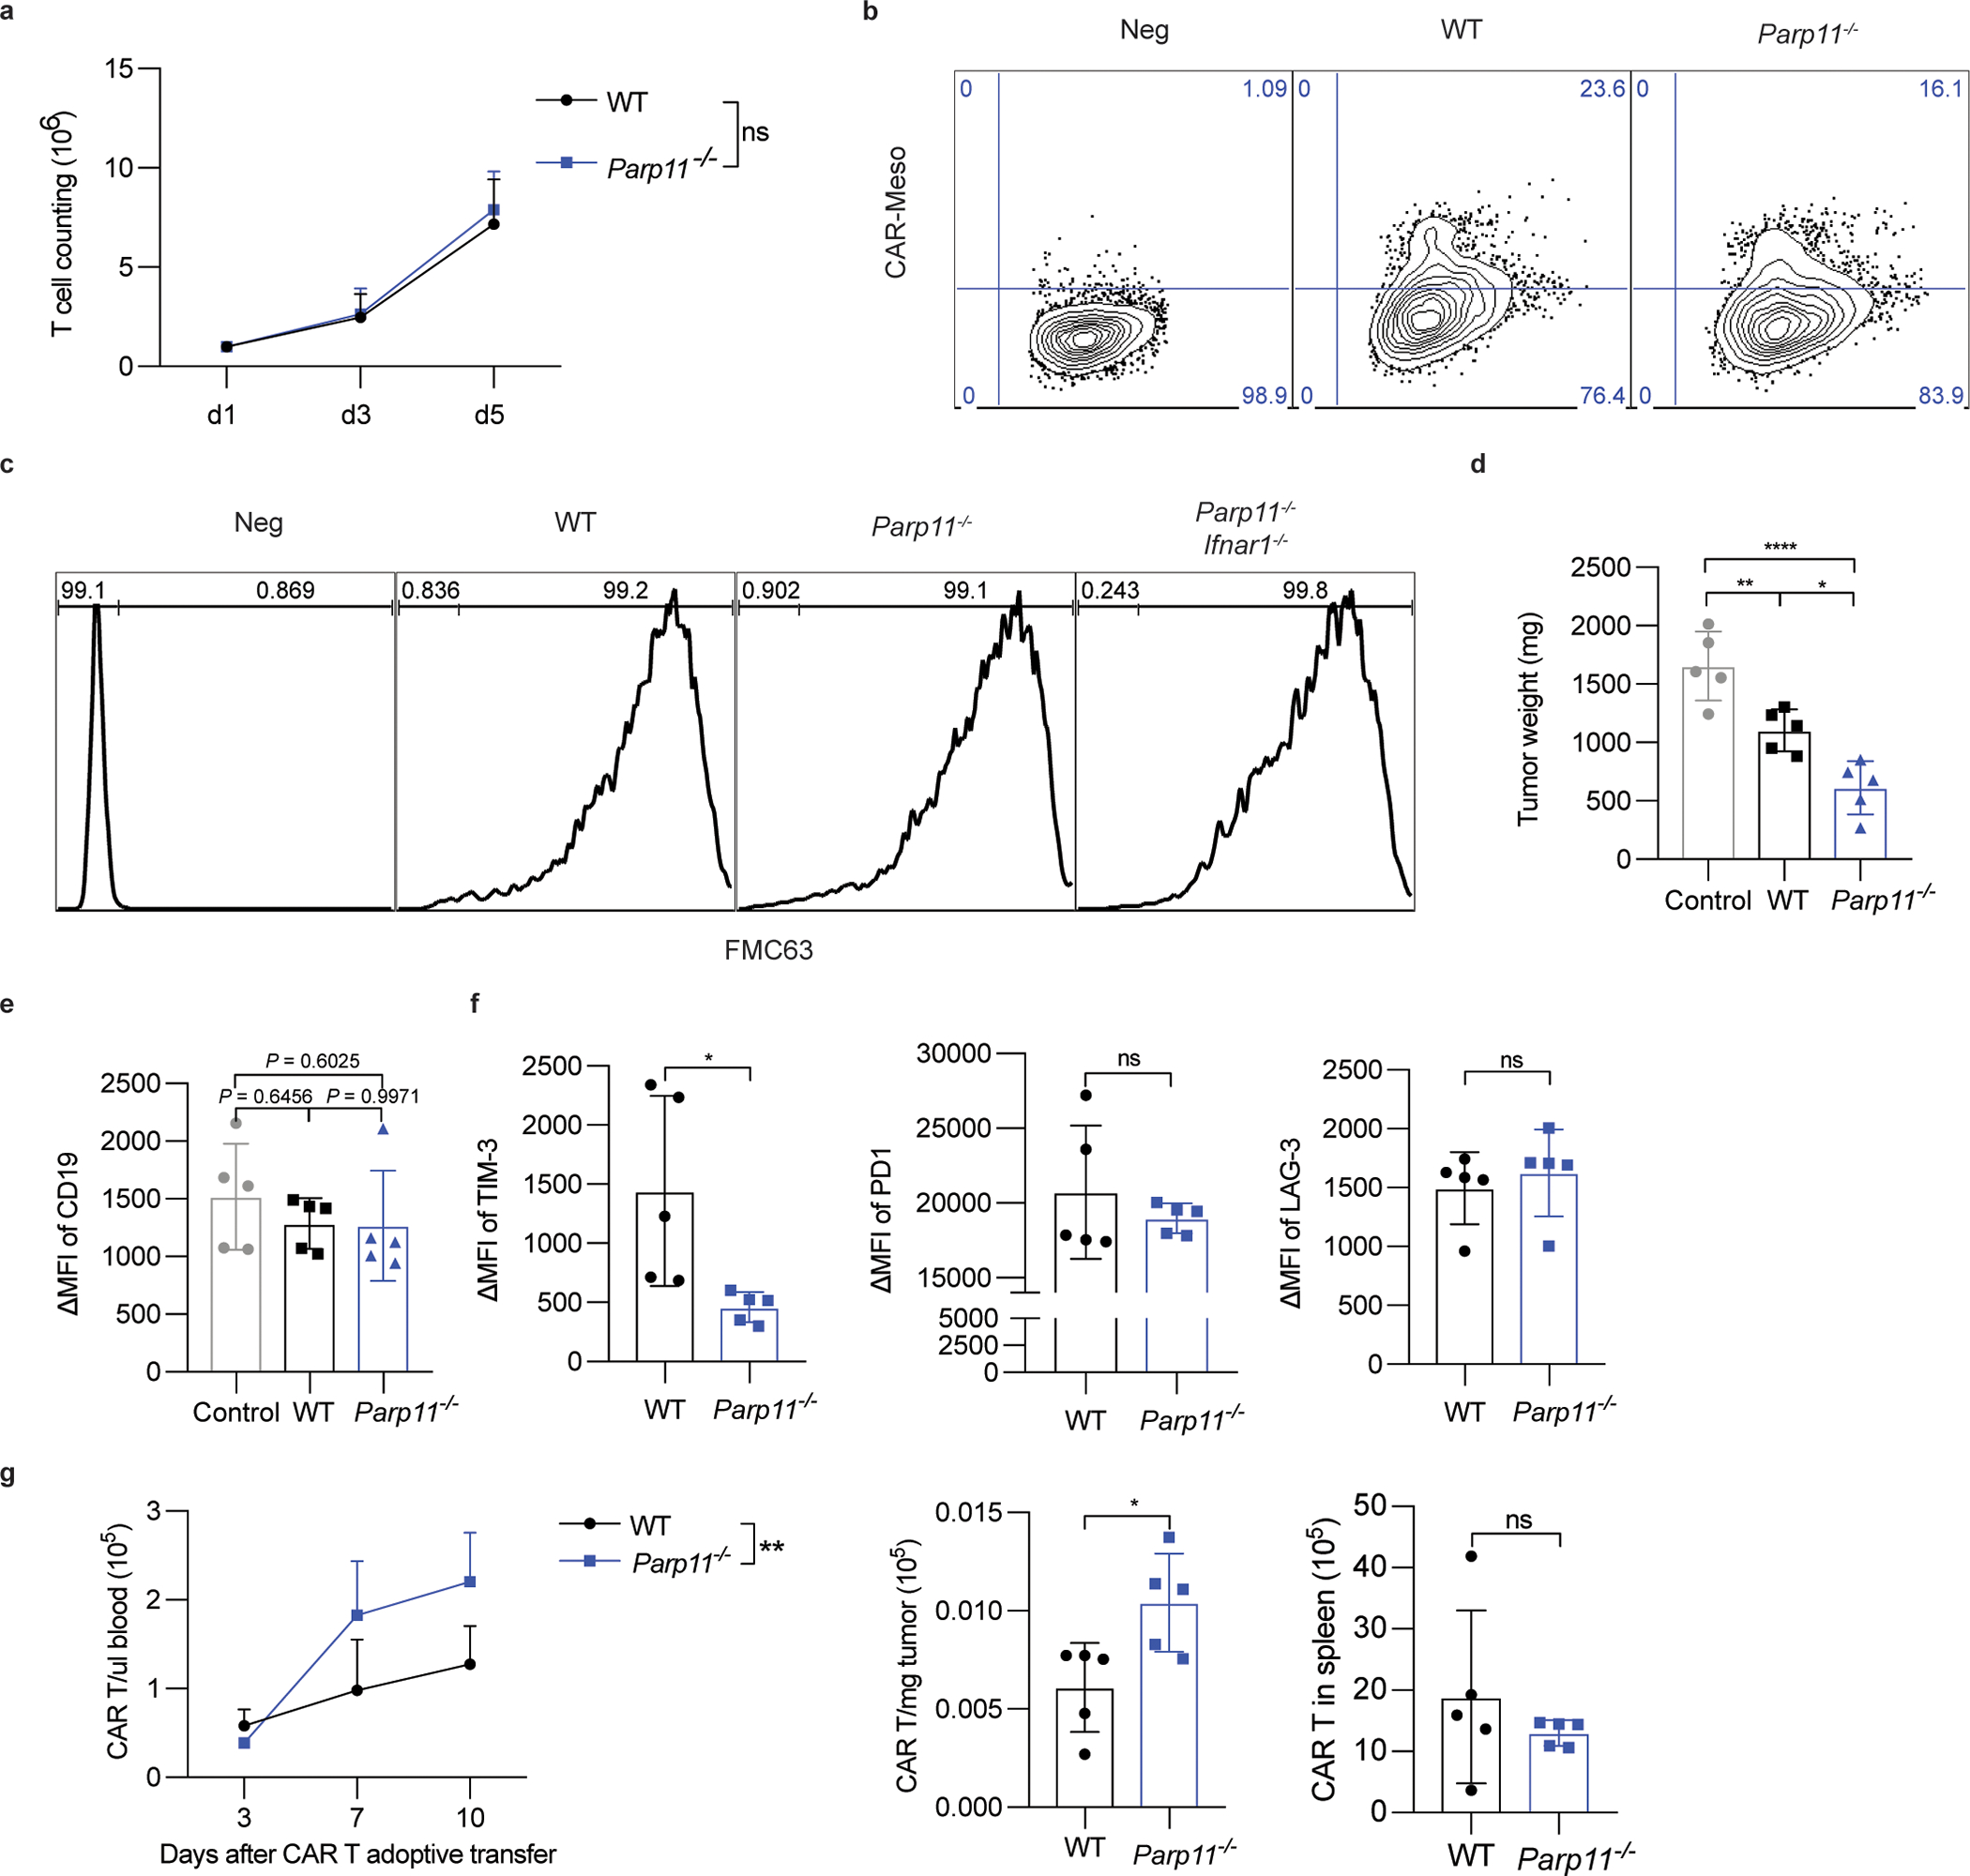
A. Proliferation of CD19-BBz CAR T cells prepared from WT or Parp11−/− mouse splenic T cells. Data are shown as mean ± SEM (n = 5 samples for each group). Statistical analysis was performed using two-way ANOVA with Tukey`s multiple comparisons test. ns, P = 0.6599.
B. Flow cytometry analysis of CAR expression in mouse T cells of indicated genotypes after Meso-BBz transduction.
C. Representative flow cytometry analysis of CAR expression in mouse T cells of indicated genotypes after CD19-BBz transduction.
D. Weight of hCD19-B16F10 s.c. tumors that grew in NSG mice treated with PBS (Control) or adoptively transferred with CD19-BBz CAR T cells (1×10⁶/ mouse, i.v) of indicated genotypes as in Fig 7D. Data are shown as mean ± SEM (n = 5 mice for each group). Statistical analysis was performed using ordinary one-way ANOVA with Tukey`s multiple comparisons test. **P = 0.0087, ****P < 0.0001, *P = 0.0175.
E. Cell surface expression of human CD19 on the surface of hCD19-B16F10 malignant cells is checked by flow cytometry. Data are shown as mean ± SEM (n = 5 mice for each group). Statistical analysis was performed using ordinary one-way ANOVA with Tukey`s multiple comparisons test.
F. Expression of TIM-3, PD-1, and LAG-3 exhaustion markers by WT or Parp11−/− CAR T cells isolated from hCD19-B16 subcutaneous tumors from mice described in Fig S5D. Data are shown as mean ± SEM (n = 5 mice for each group). Statistical analysis was performed using ordinary one-way ANOVA with Tukey`s multiple comparisons test. **P = 0.0270.
G. Numbers of WT or Parp11−/− CAR T cells in the blood, spleen or hCD19-B16 subcutaneous tumors from mice described in Fig S5D. Data are shown as mean ± SEM (n = 5 mice for each group). Statistical analysis was performed using ordinary one-way ANOVA with Tukey`s multiple comparisons test. **P = 0.0038, *P = 0.0212.
Extended Data Fig. 6. Increased efficacy of CAR T cells engineered to inactivate PARP11.
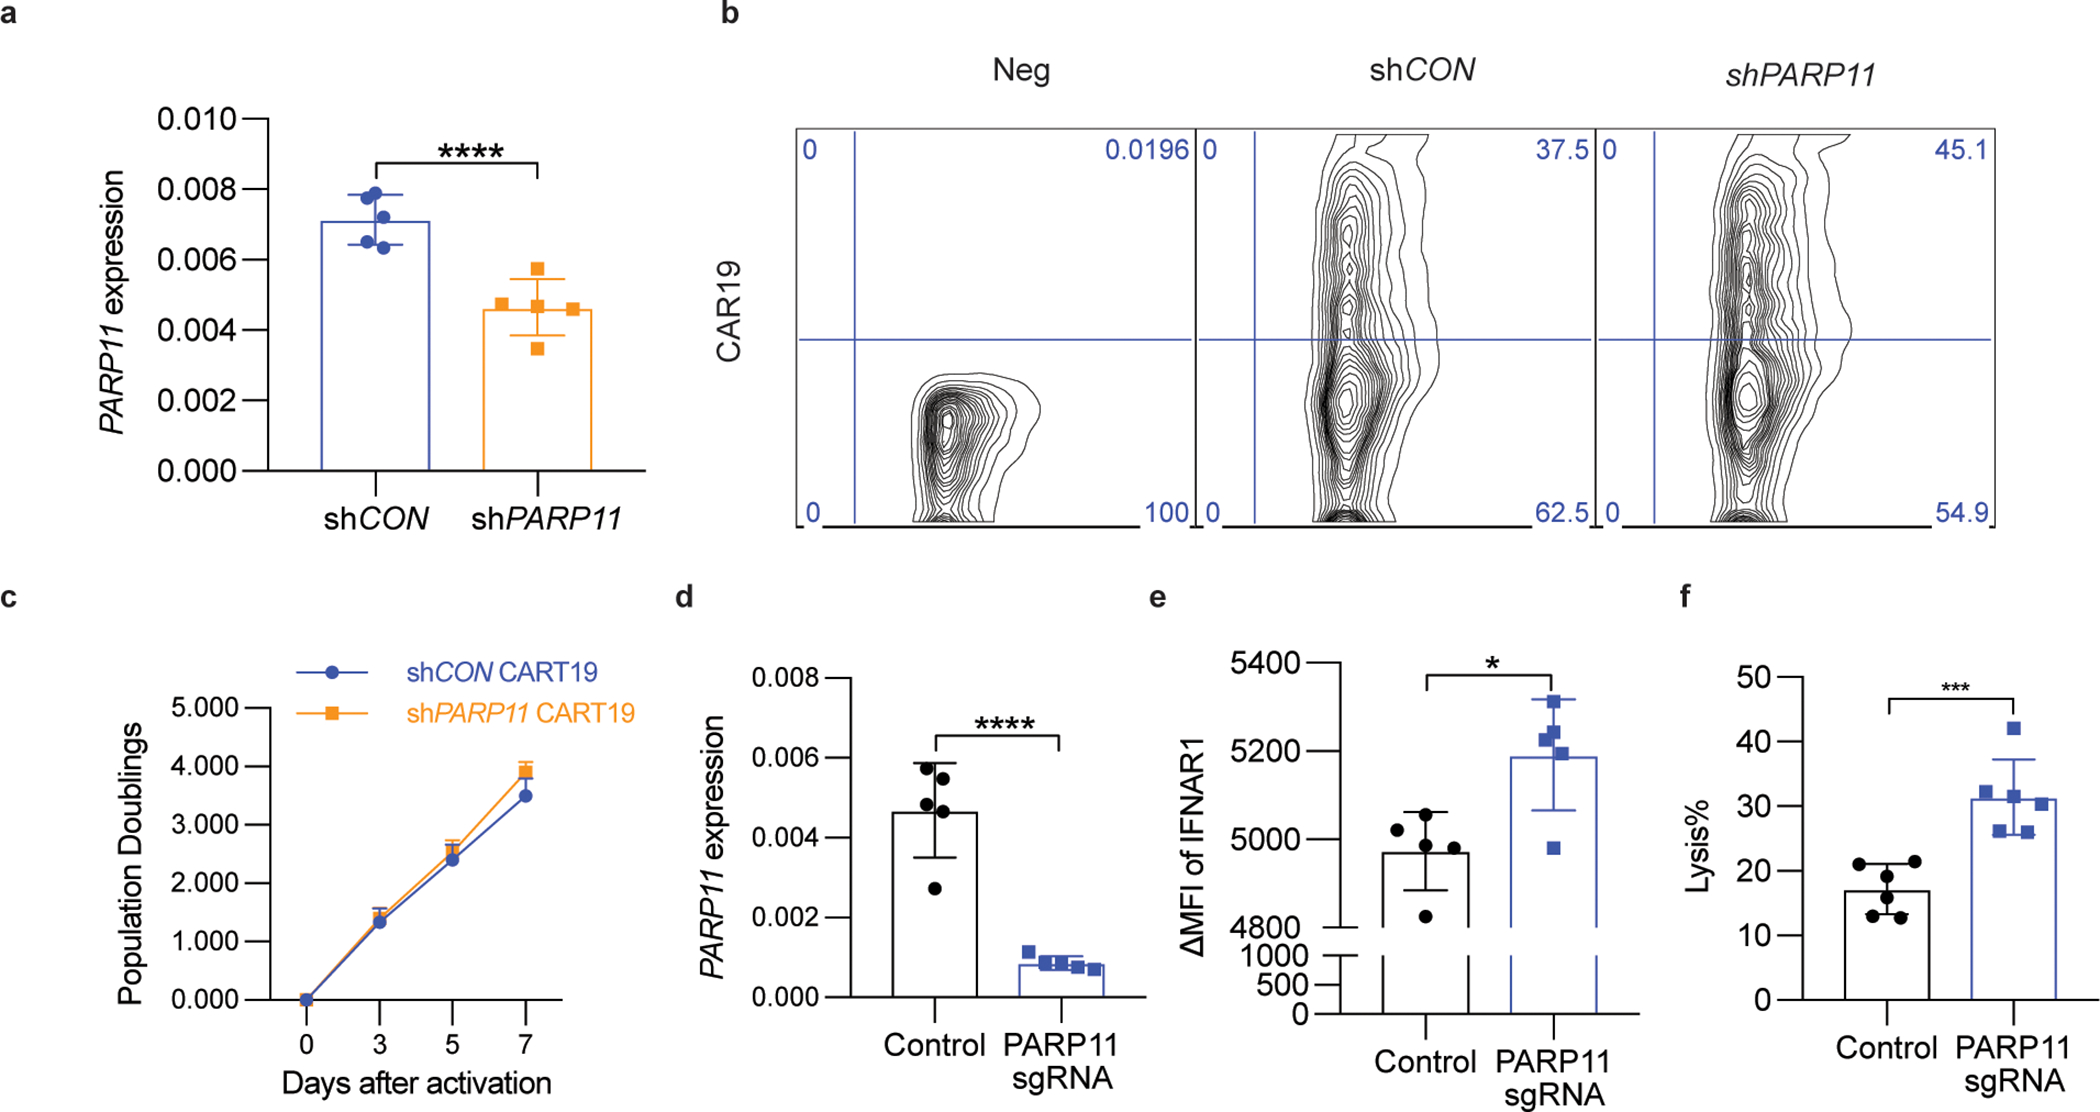
A. qPCR analysis of PARP11 mRNA in shCON-CD19-BBz or shPARP11-CD19-BBz CAR T cells. Data are shown as mean ± SEM (n = 5 independently treated cell cultures.). Two-tailed unpaired t-test was performed for the comparisons between groups. ****P < 0.0001.
B. Flow cytometry analysis of CAR expression in human T cells 3 days after shCON-CD19-BBz or shPARP11-CD19-BBz transduction.
C. In vitro proliferation of shCON-CD19-BBz and shPARP11-CD19-BBz CAR T cells following stimulation with anti-CD3/CD28 microbeads. Data are shown as mean ± SEM (n = 3 independently treated cell cultures). Statistical analysis was performed using two-way ANOVA with Tukey`s multiple comparisons test.
D. qPCR analysis of PARP11 mRNA in human WT or PARP11 knockout (PARP11 sgRNA) Meso-BBz CAR T cells. Data are shown as mean ± SEM (n = 5 independently treated cell cultures). Two-tailed unpaired t-test was performed for the comparisons between groups. ****P < 0.0001.
E. Flow cytometry analysis of IFNAR1 cell surface levels on human WT or PARP11 knockout (PARP11 sgRNA) Meso-BBz CAR T cells. Data are shown as mean ± SEM (n = 5 independently treated cell cultures). Two-tailed unpaired t-test was performed for the comparisons between groups. *P = 0.0128.
F. Analysis of killing of EM-Meso-GFP-Luc cells cocultured with human WT or PARP11 knockout (PARP11 sgRNA) Meso-BBz CAR T cells. Data are shown as mean ± SEM (n = 5 independently treated cell cultures). Two-tailed unpaired t-test was performed for the comparisons between groups. ***P = 0.0006.
Extended Data Fig. 7. Inhibitor of p38 kinase increases the efficacy of CAR T cell therapies.
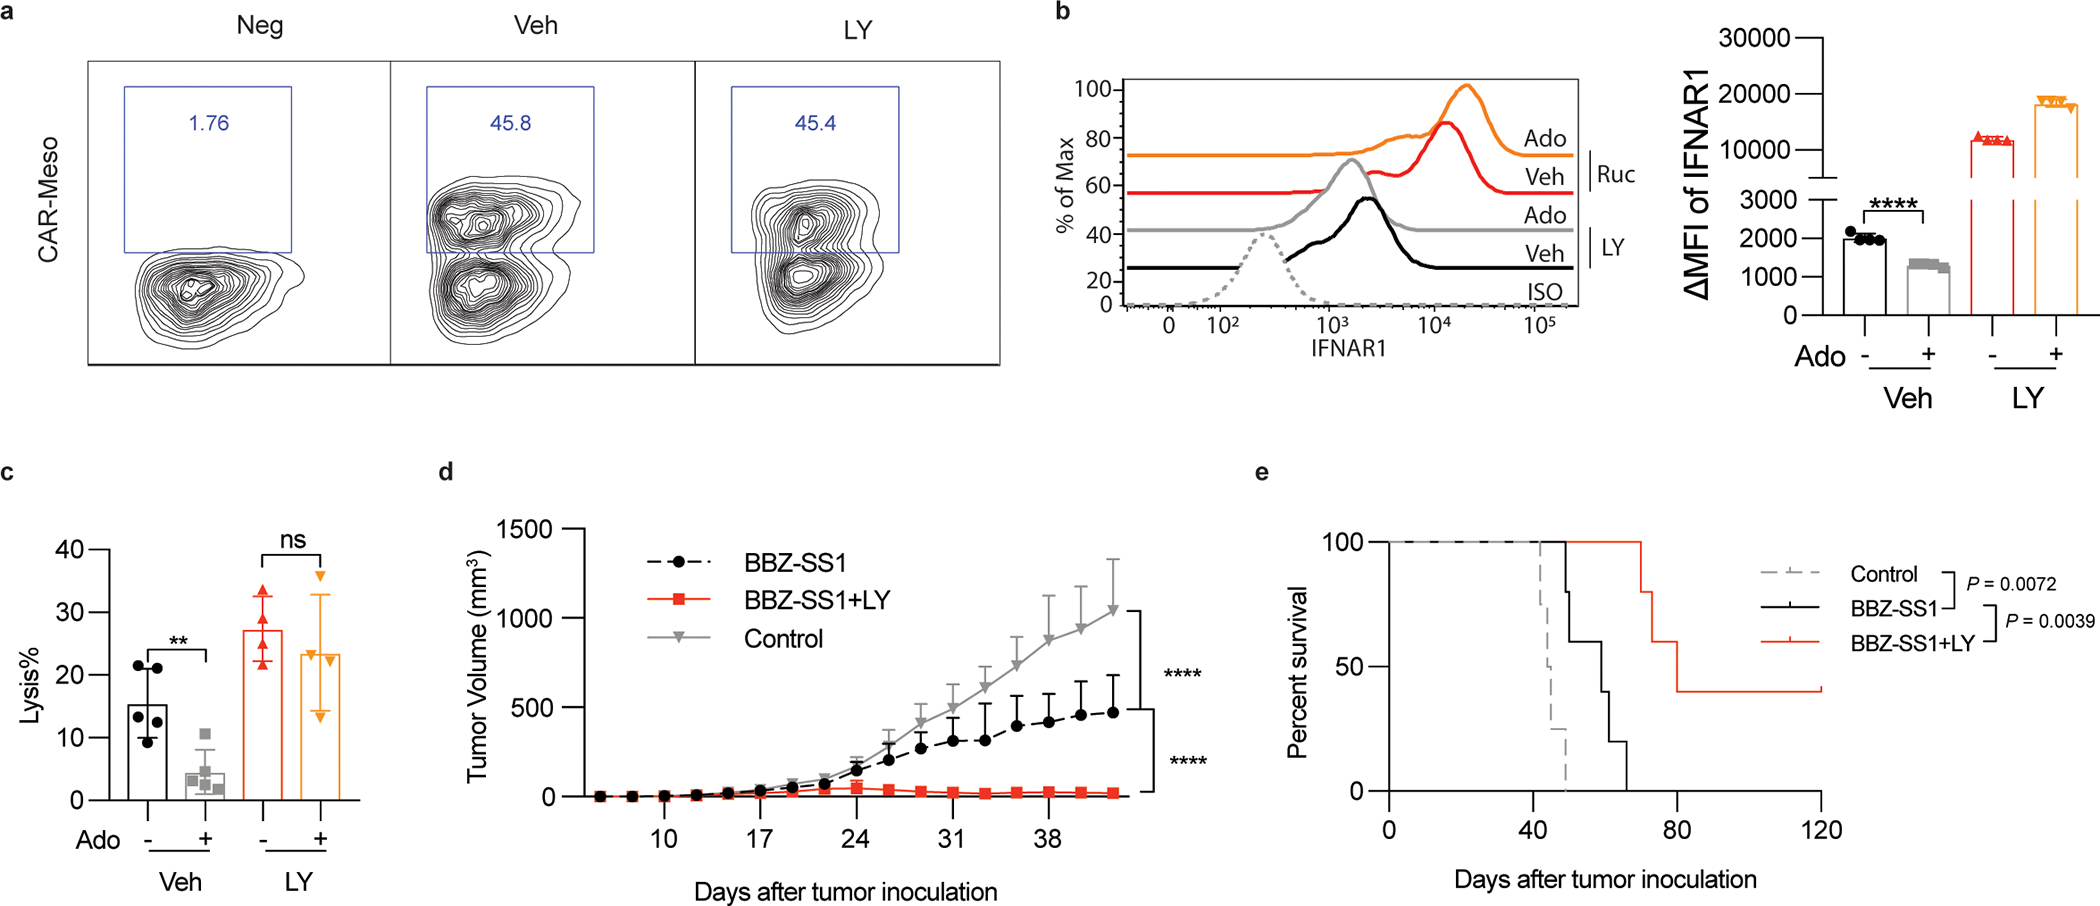
A. Representative flow cytometry analysis of CAR expression in human T cells after Meso-BBz transduction and treatment with vehicle or p38 inhibitor Ralimetinib (LY2228820, LY, 5μM, 72h).
B. Flow cytometry analysis of levels of IFNAR1 on the surface of Meso-BBz CAR T cells pretreated with indicated inhibitors (LY2228820, LY, 5μM, 72h) and then treated by adenosine (Ado, 1mM) for 24h. Data are shown as mean ± SEM (n = 4 independently treated cell cultures). Statistical analysis was performed using ordinary one-way ANOVA with Tukey`s multiple comparisons test. ****P < 0.0001.
C. Lysis of EM-Meso-GFP-Luc cells by Meso-BBz CAR T pretreated with inhibitors (LY2228820, LY, 5μM, 72h) at indicated conditions (E: T =10:1). Data are shown as mean ± SEM (Veh treated with or without Ado, n = 5 co-cultures; LY treated with or without Ado, n = 5 co-cultures.). Statistical analysis was performed using ordinary one-way ANOVA with Tukey`s multiple comparisons test. **P < 0.0056.
D. Tumor growth of NSG mice that were injected s.c. with 1×10⁶ EM-Meso-GFP-Luc cells. Mice were i.v. treated with 2×10⁶ BBZ-SS1 CAR T cells on day 7. BBZ-SS1 CAR T cells were pretreated with LY (5μM) or Veh for 72h before injected to mice. Data are shown as mean ± SEM (Control, n = 7 mice; BBZ-SS1, n = 9 mice; BBZ-SS1 +LY, n = 10 mice). Statistical analysis was performed using two-way ANOVA with Tukey`s multiple comparisons test. ****P < 0.0001.
E. The Kaplan-Meier analysis of survival of animals from experiment described in Fig S7D (n = 5 mice for each group). Statistical analysis was performed using Gehan-Breslow-Wilcoxon test.
Supplementary Material
ACKNOWLEDGMENTS
This work was supported by the by the NIH/NCI R01 grants CA247803 (to S.Y.F. and D.P.B.), R01 CA240814 (to S.Y.F. and A.B.) and P01 CA165997 grant (to J.A.D., C.K., and S.Y.F.), NIH/NICHD grant R15 HD100970 (to R.G.M), NIH/NIA grant R56 AG069745 (to M.M.F.), K08 CA252619 (to M.J.A.), and National Natural Science Foundation of China (31970846 for Hui Z.).
We thank the Human Immunology Core at the University of Pennsylvania for providing purified human leukocyte subsets for our research. We are grateful to Susan Ostrand-Rosenberg (University of Maryland, Baltimore MD, USA), and Edmund Moon (University of Pennsylvania, Philadelphia, USA) for reagents. We greatly appreciate technical advice from Drs. Anthony Phan, Lindsey Shallberg and Antonia Rotolo (University of Pennsylvania, Philadelphia, PA, USA). We also thank Dmitry Gabrilovich (Astra-Zeneca, Gaithersburg, MD, USA), Ana Gamero (Temple University, Philadelphia PA, USA) and the members of the Fuchs, Minn, and Koumenis Ryeom labs for critical suggestions.
Footnotes
Competing Interests Statement
The authors declare no potential conflicts of interest.
References
- 1.Jhunjhunwala S, Hammer C & Delamarre L Antigen presentation in cancer: insights into tumour immunogenicity and immune evasion. Nat Rev Cancer (2021). [DOI] [PubMed] [Google Scholar]
- 2.O’Donnell JS, Teng MWL & Smyth MJ Cancer immunoediting and resistance to T cell-based immunotherapy. Nat Rev Clin Oncol 16, 151–167 (2019). [DOI] [PubMed] [Google Scholar]
- 3.Swann JB & Smyth MJ Immune surveillance of tumors. J Clin Invest 117, 1137–1146 (2007). [DOI] [PMC free article] [PubMed] [Google Scholar]
- 4.Hanahan D & Coussens LM Accessories to the crime: functions of cells recruited to the tumor microenvironment. Cancer Cell 21, 309–322 (2012). [DOI] [PubMed] [Google Scholar]
- 5.Joyce JA & Fearon DT T cell exclusion, immune privilege, and the tumor microenvironment. Science 348, 74–80 (2015). [DOI] [PubMed] [Google Scholar]
- 6.Liu C, Workman CJ & Vignali DA Targeting regulatory T cells in tumors. FEBS J 283, 2731–2748 (2016). [DOI] [PubMed] [Google Scholar]
- 7.Veglia F & Gabrilovich DI Dendritic cells in cancer: the role revisited. Curr Opin Immunol 45, 43–51 (2017). [DOI] [PMC free article] [PubMed] [Google Scholar]
- 8.Vijayan D, Young A, Teng MWL & Smyth MJ Targeting immunosuppressive adenosine in cancer. Nat Rev Cancer 17, 709–724 (2017). [DOI] [PubMed] [Google Scholar]
- 9.Allard B, Allard D, Buisseret L & Stagg J The adenosine pathway in immuno-oncology. Nat Rev Clin Oncol 17, 611–629 (2020). [DOI] [PubMed] [Google Scholar]
- 10.Smyth MJ, Ngiow SF, Ribas A & Teng MW Combination cancer immunotherapies tailored to the tumour microenvironment. Nat Rev Clin Oncol 13, 143–158 (2016). [DOI] [PubMed] [Google Scholar]
- 11.Sharma P & Allison JP Immune checkpoint targeting in cancer therapy: toward combination strategies with curative potential. Cell 161, 205–214 (2015). [DOI] [PMC free article] [PubMed] [Google Scholar]
- 12.Fuchs SY Hope and fear for interferon: the receptor-centric outlook on the future of interferon therapy. J Interferon Cytokine Res 33, 211–225 (2013). [DOI] [PMC free article] [PubMed] [Google Scholar]
- 13.Parker BS, Rautela J & Hertzog PJ Antitumour actions of interferons: implications for cancer therapy. Nat Rev Cancer 16, 131–144 (2016). [DOI] [PubMed] [Google Scholar]
- 14.Zitvogel L, Galluzzi L, Kepp O, Smyth MJ & Kroemer G Type I interferons in anticancer immunity. Nat Rev Immunol 15, 405–414 (2015). [DOI] [PubMed] [Google Scholar]
- 15.Benci JL, et al. Tumor Interferon Signaling Regulates a Multigenic Resistance Program to Immune Checkpoint Blockade. Cell 167, 1540–1554 e1512 (2016). [DOI] [PMC free article] [PubMed] [Google Scholar]
- 16.Aichele P, et al. CD8 T cells specific for lymphocytic choriomeningitis virus require type I IFN receptor for clonal expansion. J Immunol 176, 4525–4529 (2006). [DOI] [PubMed] [Google Scholar]
- 17.Curtsinger JM, Valenzuela JO, Agarwal P, Lins D & Mescher MF Type I IFNs provide a third signal to CD8 T cells to stimulate clonal expansion and differentiation. J Immunol 174, 4465–4469 (2005). [DOI] [PubMed] [Google Scholar]
- 18.Hervas-Stubbs S, et al. Effects of IFN-alpha as a signal-3 cytokine on human naive and antigen-experienced CD8(+) T cells. Eur J Immunol 40, 3389–3402 (2010). [DOI] [PubMed] [Google Scholar]
- 19.Katlinski KV, et al. Inactivation of Interferon Receptor Promotes the Establishment of Immune Privileged Tumor Microenvironment. Cancer Cell 31, 194–207 (2017). [DOI] [PMC free article] [PubMed] [Google Scholar]
- 20.Bhattacharya S, et al. Anti-tumorigenic effects of Type 1 interferon are subdued by integrated stress responses. Oncogene 32, 4214–4221 (2013). [DOI] [PMC free article] [PubMed] [Google Scholar]
- 21.Bhattacharya S, et al. Triggering ubiquitination of IFNAR1 protects tissues from inflammatory injury. EMBO Mol Med 6, 384–397 (2014). [DOI] [PMC free article] [PubMed] [Google Scholar]
- 22.Ortiz A, et al. An Interferon-Driven Oxysterol-Based Defense against Tumor-Derived Extracellular Vesicles. Cancer Cell 35, 33–45 e36 (2019). [DOI] [PMC free article] [PubMed] [Google Scholar]
- 23.Huangfu WC, et al. Inflammatory signaling compromises cell responses to interferon alpha. Oncogene 31, 161–172 (2012). [DOI] [PMC free article] [PubMed] [Google Scholar]
- 24.Spiegelman VS, et al. Wnt/beta-catenin signaling induces the expression and activity of betaTrCP ubiquitin ligase receptor. Mol Cell 5, 877–882 (2000). [DOI] [PubMed] [Google Scholar]
- 25.Guo T, et al. ADP-ribosyltransferase PARP11 modulates the interferon antiviral response by mono-ADP-ribosylating the ubiquitin E3 ligase beta-TrCP. Nat Microbiol 4, 1872–1884 (2019). [DOI] [PubMed] [Google Scholar]
- 26.Bhattacharya S, et al. Role of p38 protein kinase in the ligand-independent ubiquitination and down-regulation of the IFNAR1 chain of type I interferon receptor. J Biol Chem 286, 22069–22076 (2011). [DOI] [PMC free article] [PubMed] [Google Scholar]
- 27.Gurusamy D, et al. Multi-phenotype CRISPR-Cas9 Screen Identifies p38 Kinase as a Target for Adoptive Immunotherapies. Cancer Cell 37, 818–833 e819 (2020). [DOI] [PMC free article] [PubMed] [Google Scholar]
- 28.Alicea-Torres K, et al. Immune suppressive activity of myeloid-derived suppressor cells in cancer requires inactivation of the type I interferon pathway. Nat Commun 12, 1717 (2021). [DOI] [PMC free article] [PubMed] [Google Scholar]
- 29.Josefowicz SZ, Lu LF & Rudensky AY Regulatory T cells: mechanisms of differentiation and function. Annu Rev Immunol 30, 531–564 (2012). [DOI] [PMC free article] [PubMed] [Google Scholar]
- 30.Kumar KG, et al. Site-specific ubiquitination exposes a linear motif to promote interferon-alpha receptor endocytosis. J Cell Biol 179, 935–950 (2007). [DOI] [PMC free article] [PubMed] [Google Scholar]
- 31.Kumar KG, Krolewski JJ & Fuchs SY Phosphorylation and specific ubiquitin acceptor sites are required for ubiquitination and degradation of the IFNAR1 subunit of type I interferon receptor. J Biol Chem 279, 46614–46620 (2004). [DOI] [PubMed] [Google Scholar]
- 32.Kumar KG, et al. SCF(HOS) ubiquitin ligase mediates the ligand-induced down-regulation of the interferon-alpha receptor. EMBO J 22, 5480–5490 (2003). [DOI] [PMC free article] [PubMed] [Google Scholar]
- 33.Li Y, Gazdoiu S, Pan ZQ & Fuchs SY Stability of homologue of Slimb F-box protein is regulated by availability of its substrate. J Biol Chem 279, 11074–11080 (2004). [DOI] [PubMed] [Google Scholar]
- 34.Meyer-Ficca ML, et al. Spermatid head elongation with normal nuclear shaping requires ADP-ribosyltransferase PARP11 (ARTD11) in mice. Biol Reprod 92, 80 (2015). [DOI] [PMC free article] [PubMed] [Google Scholar]
- 35.Khan O, et al. TOX transcriptionally and epigenetically programs CD8(+) T cell exhaustion. Nature 571, 211–218 (2019). [DOI] [PMC free article] [PubMed] [Google Scholar]
- 36.Yang R, et al. Distinct epigenetic features of tumor-reactive CD8+ T cells in colorectal cancer patients revealed by genome-wide DNA methylation analysis. Genome Biol 21, 2 (2019). [DOI] [PMC free article] [PubMed] [Google Scholar]
- 37.Larson RC & Maus MV Recent advances and discoveries in the mechanisms and functions of CAR T cells. Nat Rev Cancer 21, 145–161 (2021). [DOI] [PMC free article] [PubMed] [Google Scholar]
- 38.Kirby IT, et al. A Potent and Selective PARP11 Inhibitor Suggests Coupling between Cellular Localization and Catalytic Activity. Cell Chem Biol 25, 1547–1553 e1512 (2018). [DOI] [PubMed] [Google Scholar]
- 39.Slade D PARP and PARG inhibitors in cancer treatment. Genes Dev 34, 360–394 (2020). [DOI] [PMC free article] [PubMed] [Google Scholar]
- 40.Maj T, et al. Oxidative stress controls regulatory T cell apoptosis and suppressor activity and PD-L1-blockade resistance in tumor. Nat Immunol 18, 1332–1341 (2017). [DOI] [PMC free article] [PubMed] [Google Scholar]
- 41.Kohlmeier JE, Cookenham T, Roberts AD, Miller SC & Woodland DL Type I interferons regulate cytolytic activity of memory CD8(+) T cells in the lung airways during respiratory virus challenge. Immunity 33, 96–105 (2010). [DOI] [PMC free article] [PubMed] [Google Scholar]
- 42.Piehler J, Thomas C, Garcia KC & Schreiber G Structural and dynamic determinants of type I interferon receptor assembly and their functional interpretation. Immunol Rev 250, 317–334 (2012). [DOI] [PMC free article] [PubMed] [Google Scholar]
- 43.Anastas JN & Moon RT WNT signalling pathways as therapeutic targets in cancer. Nat Rev Cancer 13, 11–26 (2013). [DOI] [PubMed] [Google Scholar]
- 44.Liu J, et al. Virus-induced unfolded protein response attenuates antiviral defenses via phosphorylation-dependent degradation of the type I interferon receptor. Cell Host Microbe 5, 72–83 (2009). [DOI] [PMC free article] [PubMed] [Google Scholar]
- 45.Minn AJ & Wherry EJ Combination Cancer Therapies with Immune Checkpoint Blockade: Convergence on Interferon Signaling. Cell 165, 272–275 (2016). [DOI] [PubMed] [Google Scholar]
- 46.Minn AJ Interferons and the Immunogenic Effects of Cancer Therapy. Trends Immunol 36, 725–737 (2015). [DOI] [PMC free article] [PubMed] [Google Scholar]
- 47.Evgin L, et al. Oncolytic virus-derived type I interferon restricts CAR T cell therapy. Nat Commun 11, 3187 (2020). [DOI] [PMC free article] [PubMed] [Google Scholar]
- 48.Peyraud F & Italiano A Combined PARP Inhibition and Immune Checkpoint Therapy in Solid Tumors. Cancers (Basel) 12(2020). [DOI] [PMC free article] [PubMed] [Google Scholar]
- 49.Cho C, et al. Cancer-associated fibroblasts downregulate type I interferon receptor to stimulate intratumoral stromagenesis. Oncogene 39, 6129–6137 (2020). [DOI] [PMC free article] [PubMed] [Google Scholar]
- 50.Bhattacharya S, et al. Inducible priming phosphorylation promotes ligand-independent degradation of the IFNAR1 chain of type I interferon receptor. J Biol Chem 285, 2318–2325 (2010). [DOI] [PMC free article] [PubMed] [Google Scholar]
- 51.Goldman LA, et al. Characterization of antihuman IFNAR-1 monoclonal antibodies: epitope localization and functional analysis. J Interferon Cytokine Res 19, 15–26 (1999). [DOI] [PubMed] [Google Scholar]
Associated Data
This section collects any data citations, data availability statements, or supplementary materials included in this article.
Supplementary Materials
Data Availability Statement
Mouse scRNAseq data are all available on GEO (accession number: GSE171055). Source data have been provided as Source Data files. All other data supporting the findings of this study are available from the corresponding author on reasonable request.


