

Abstract
Background
Data on myopia prevalence and progression in European children are sparse. The aim of this work was to evaluate the progression of myopia in children and teenagers in a large prospective study.
Methods
A prospective study involving a nationwide cohort. Myopia was defined as a spherical equivalent (SE) of ≤ –0.50 diopters (D). Data on refractive error, gender and age were collected in 696 optical centres in France between 2013 and 2019, including 136 333 children (4–17 years old) in the analysis.
Progression of myopia was assessed between the first visit and the last visit over up to 6.5 years.
Results
Mean age was 11.3±3.8 years (55.0% of female). The proportion of children progressing more than –0.50 D per year was higher in age groups 7–9 years and 10–12 years and in children with SE ≤ –4.00 D at first visit, representing 33.1%, 29.4% and 30.0% of these groups, respectively. In multivariate analysis, progression during the first 11–24 months was higher in the 7–9 and 10–12 age groups (–0.43 D and –0.42 D, respectively), for higher SE at baseline (at least –0.33 D for SE ≤ –1 D) and for girls (–0.35 D).
Conclusion
This is the first French epidemiological study to investigate myopia progression in a large-scale cohort of children. Sex, age groups and myopia severity are associated with differing rates of progression.
Keywords: epidemiology
Introduction
A ‘myopia boom’ has been observed in many countries, not only in East Asia, but also worldwide, making myopia a major public health issue.1 Myopia is defined by a refractive error of −0.50 diopter (D) or less, and high myopia by refractive errors of −5 D or less, and in 2020 they affect 2.6 billion and 300 million people, respectively, worldwide (https://www.who.int/blindness/causes/MyopiaReportforWeb.pdf). Accelerated evolution of lifestyles over recent decades, with more time dedicated to close-range work and mid-distance activities, combined with marked reduction of outdoor activities and more extensive educational coverage, likely explain this epidemic to a far greater extent than genetic modifications, which usually require much more time.2–7
Myopia frequently appears in childhood, with a peak incidence occurring between 8 and 10 years of age.8 9 There is major disparity in the prevalence of myopia in children according to ethnic origin.10 The progression of myopia has been analysed in various studies,8 11–13 and a younger age of myopia onset or longer duration of myopia progression is strong predictors of high myopia.8 14 15
Epidemiologic data on European myopic children are scarce, particularly with respect to myopia progression, with most studies focusing on refractive error in adults. The aim of this study was to prospectively study myopia progression among children and adolescents in France.
Materials and methods
Dataset description and selection
The original dataset consisted of anonymised electronic data files collected from 696 French opticians’ stores located in all French metropolitan departments between 2013 and 2019. Information came from the optical prescriptions provided by ophthalmologists. Relevant variables were year of birth, sex, prescription date, purchase date, type of prescription (glasses, contact lenses), type of vision correction (near vision, distance vision, progressive glasses, others), sphere and cylinder characteristics for both eyes. The spherical equivalent (SE) of the right eye only was used to quantify myopia. Myopia was defined by an SE ≤ –0.50 D.16
Individuals with at least two prescriptions for myopia correction separated by at least 6 months were eligible, the first prescription for myopia correction in opticians’ stores participating in the study being considered as the baseline. One estimate of progression rate was calculated per individual, using the last prescription. Age of myopia incidence was not known, as baseline refractive error varied considerably.
Inclusion criteria were myopia age between 4 and 17 years at the date of first prescription. Children aged 0–3 years were excluded because of their relatively small number and because myopia aetiology is considered different for preschoolers.17 Preprocessing and further exclusion steps are summarised in figure 1. The most frequent reasons for exclusion were age and refractive error.
Figure 1.
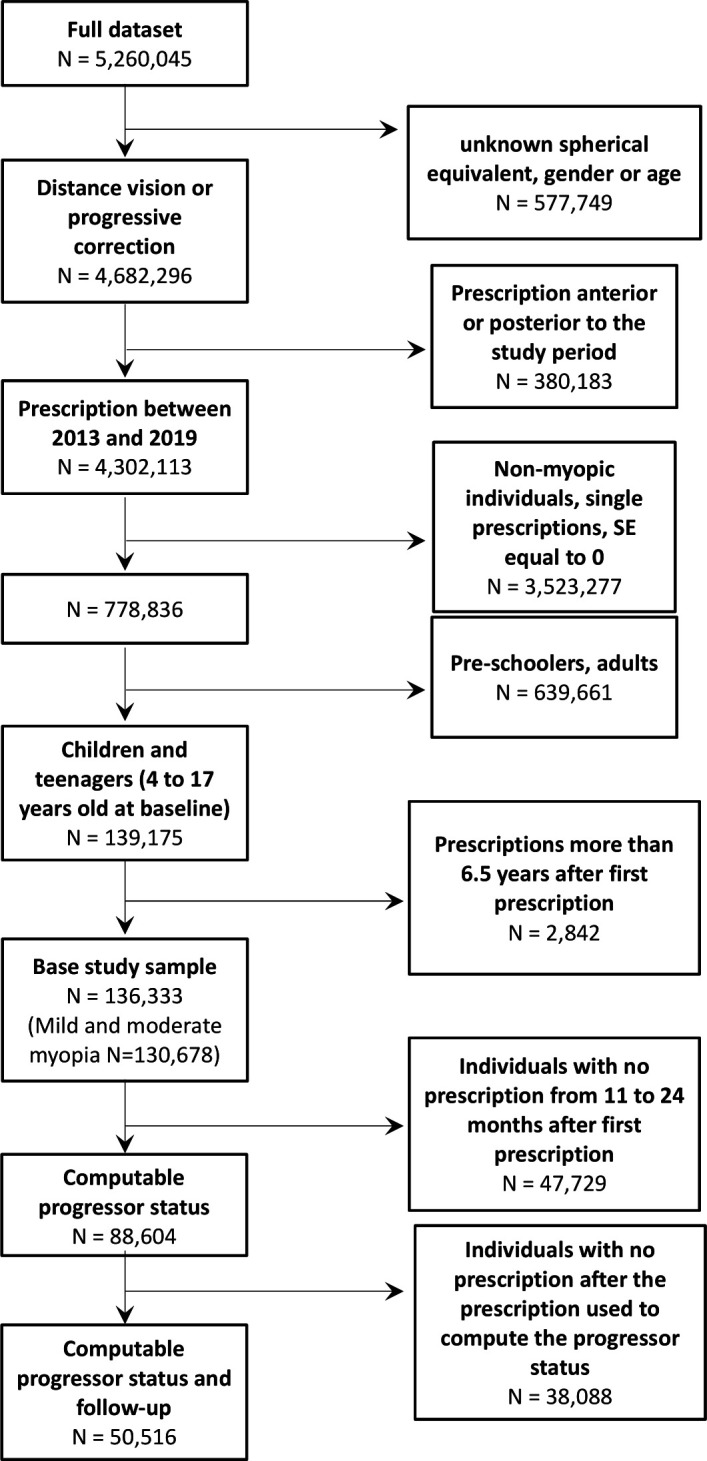
Flow diagram describing data selection. SE, spherical equivalent.
Myopia progression was defined as the difference in SE between baseline and subsequent prescriptions. Negative values represent myopia progression. Time intervals between visits were categorised into 6-month intervals. In cases of multiple prescriptions within an interval, the visit with the most myopic prescription was selected, usually the last one. Progressors were defined as individuals with a mean rate of progression of myopia exceeding –0.50 D/year in the period between baseline and a second prescription between 11 and 24 months after baseline. Individuals without prescription in this period were excluded from the corresponding analyses.
When comparing the progression of progressors and non-progressors, the second prescription was used as the new baseline.
High myopia was defined as SE ≤ –6D. For survival analysis, only individuals who did not have high myopia were selected. The incidence date of high myopia was set as the earliest prescription for high myopia. When high myopia did not occur, the latest prescription date was used (censored observation). To avoid bias due to low number of at-risk individuals, prescriptions that occurred more than 5.5 years after baseline were treated as censored at 5.5 years.
Modeling
We modelled progression with an analysis of variance (ANOVA). Covariates included age, SE at baseline and gender, and the main variable was progression between 11 and 24 months after baseline.
The p values for proportions of progressors were computed using logistic regression to model ‘progressor status’ (positive if the progression rate is < –0.50 D/year). Covariates were age group, SE at baseline and gender.
Survival analysis was performed with a multivariate Cox model including the following covariates age, SE at baseline and gender.
Patient and public involvement statement
Patients and the public were not involved in any way during this research.
Results
Dataset description
The dataset included 136 333 myopic children and teenagers (mean age: 11.3±3.8; 55.0% were female, 130 678 had SE > –6D). Median follow-up was 2.7 years. Follow-up duration was ≥2 years, ≥3 years, ≥4 years and ≥5 years for 90 706 (66.5%), 61 062 (44.8%), 36 989 (27.1%) and 17 995 (13.2%) participants, respectively. Progressor status could be determined for 88 604 of them (second prescription 11 to 24 months after baseline) and 50 516 of the latter had a visit following the second prescription to estimate later progression. Demographic characteristics and refractive data are detailed in table 1.
Table 1.
Sample demographic and refractive characteristics
| N | Age (mean±SD) |
Gender (female, %) | Sphere (mean±SD) | |
| Age groups | ||||
| All | 136 333 | 11.3±3.8 | 55.0 | −2.10±1.80 |
| 4–6 | 19 179 | 5.0±0.8 | 51.9 | −1.90±1.67 |
| 7–9 | 25 830 | 8.1±0.8 | 52.5 | −1.78±1.57 |
| 10–12 | 33 319 | 11.1±0.8 | 55.3 | −2.03±1.72 |
| 13–15 | 36 861 | 14.0±0.8 | 56.5 | −2.29±1.90 |
| 16–17 | 21 144 | 16.5±0.5 | 57.6 | −2.48±1.99 |
| With progression status | 88 604 | 11.0±3.8 | 54.8 | −2.12±1.80 |
| With progression status and follow-up | 50 516 | 10.4±3.6 | 53.4 | −2.20±1.84 |
| Progressors | 13 795 | 10.2±3.2 | 55.3 | −2.37±1.92 |
| Non-progressors | 36 721 | 10.7±3.7 | 52.7 | −2.14±1.81 |
| Mild or moderate myopia | 130 678 | 11.2±3.8 | 55.0 | −1.85±1.27 |
Progression of myopia
Progression among age groups was significantly different (p<0.0001), with a higher proportion of progressors among children aged 7–9 years (33.1 %) and 10–12 years (29.4%) compared with other groups (at most 22.1 %). Moreover, progression differed significantly in relation to SE (p<0.0001), with a higher proportion of progressors among individuals with SE ≤ –4.00 D (30.0%) than for others (at most 27.5 %). Finally, progression differed significantly between sexes, (p<0.0001) with a higher proportion of progression among girls (25.6%) than among boys (24.1 %). These numbers are detailed in table 2.
Table 2.
Proportion (%) of progressors by age at baseline, spherical equivalent (SE) at baseline and sex
| % progressors (N=88 604) | % with unknown progressor status (N=136 333) | |
| All | 24.9 | 35.0 |
| Age groups | ||
| 4–6 | 20.6 | 29.9 |
| 7–9 | 33.1 | 31.2 |
| 10–12 | 29.4 | 32.9 |
| 13–15 | 22.1 | 37.9 |
| 16–17 | 14.9 | 42.5 |
| SE | ||
| (−1; −0.5) | 19.3 | 36.2 |
| (−2; −1) | 25.6 | 34.6 |
| (−3; −2) | 27.3 | 35.0 |
| (−4; −3) | 27.5 | 34.1 |
| ≤ −4 | 30.0 | 34.3 |
| Gender | ||
| F | 25.6 | 35.3 |
| M | 24.1 | 34.7 |
Progression of myopia as a function of age at first myopia correction
The rate of myopia progression was essentially linear with time within age groups, the most rapid progression being observed for children aged 7–9 and 10–12 years at baseline (–0.43 D and –0.42 D) (figure 2A and table 3). Progression rate was lower for younger and older age groups, and the association between age and progression rate was non-linear.
Figure 2.

(A) Average progression of myopia (in diopters) as a function of time (in years) stratified by baseline age groups. Bars display 95% CIs. (B) Average progression of myopia (in diopters) as a function of time (in years) stratified by baseline spherical equivalent (SE). Bars display 95% CIs.
Table 3.
Average myopia progression (in diopters) between 11 and 24 months according to age, spherical equivalent at baseline and gender: univariate and multivariate analysis. Type 3 test p values for the multivariate model: age (p<0.0001), spherical equivalent (SE) (p<0.0001) and gender (p<0.0001)
| Univariate | Multivariate | |
| Progression | Progression | |
| Age | ||
| 4–6 | –0.15 (–0.17; –0.14) | –0.18 (–0.19; –0.16) |
| 7–9 | –0.40 (–0.41; –0.39) | –0.43 (–0.44; –0.42) |
| 10–12 | –0.41 (–0.42; –0.40) | –0.42 (–0.43; –0.41) |
| 13–15 | –0.35 (–0.36; –0.34) | –0.36 (–0.37; –0.35) |
| 16–17 | –0.29 (–0.30; –0.27) | –0.29 (–0.30; –0.28) |
| SE | ||
| (−1; −0.5) | –0.25 (–0.26; –0.24) | –0.23 (–0.24; –0.22) |
| (−2; −1) | –0.35 (–0.36; –0.34) | –0.33 (–0.34; –0.32) |
| (−3; −2) | –0.38 (–0.39; –0.37) | –0.36 (–0.37; –0.35) |
| (−4; −3) | –0.38 (–0.40; –0.37) | –0.37 (–0.38; –0.36) |
| ≤ −4 | –0.40 (–0.41; –0.39) | –0.38 (–0.39; –0.37) |
| Gender | ||
| F | –0.35 (–0.35; –0.34) | –0.35 (–0.35; –0.34) |
| M | –0.32 (–0.33; –0.32) | –0.32 (–0.33; –0.31) |
Progression as a function of SE on first myopia correction
Children with SE inferior to –1 D myopia at baseline had faster progression (at least –0.33 D in multivariate analysis) than those with milder myopia (–0.23 D) (figure 2B and table 3). Rates for the other four categories of myopia were very similar (between –0.38 and –0.40 D).
Regardless of baseline myopia, progression rate was highest for children aged 7–9 years. In particular, individuals with SE ≤ –4 D at 9 years had a mean progression of –1.6 D 4–5 years later. While the rate of progression was higher for more severe degrees of myopia, the pattern of progression followed a U shape similar between different myopia subgroups (figure 3).
Figure 3.

Average progression of myopia at 4–5 years after baseline; as a function of baseline age stratified by baseline spherical equivalent (SE). Bars display 95% CIs.
Myopia progression according to gender
Average progression of myopia was higher among girls (–0.35 D) than among boys (–0.32 D) (table 3). After a follow-up of 6–6.5 years, the mean myopia progression was of –1.42 D for girls and of –1.24 D for boys.
Later myopia progression according to initial progression rate
Progressors as defined during the first 11–24 months showed faster rates of progression than non-progressors in the follow-up period with change equal to –1.69 D (–1.56; –1.81) vs –0.87 D (–0.79; –0.95) 5–5.5 years after baseline. This was observed in all age groups (figure 4).
Figure 4.

Comparison of average progression of myopia (in diopters) as a function of time (in years) between progressors and non-progressors, stratified by age at baseline. (A) between 4 and 12 years, (B) between 13 and 17 years. ‘Second prescription’ refers to the prescription used to characterise the progression status with respect to baseline (first prescription). Bars display 95% CIs.
Time to develop high myopia
Univariate analysis showed that children with SE ≤ –4.00 D and > –6.00 D at baseline had a 58% risk of developing high myopia at 5.5 years of follow-up (figure 5). Multivariate analysis showed that younger individuals aged 4–12 years, girls and individuals with higher myopia at baseline were more likely to develop high myopia (table 4).
Figure 5.

Kaplan-Meier failure curves for the event ‘develops high myopia’ stratified by spherical equivalent at baseline.
Table 4.
Hazard ratios and 95% CI for the event ‘develops high myopia’ from a multivariate Cox model. Type 3 test p values are displayed
| Multivariate HR (95% CI) | |
| Age | P value<0.0001 |
| 4–6 | 2.07 (1.85 to 2.31) |
| 7–9 | 2.59 (2.34 to 2.86) |
| 10–12 | 2.06 (1.88 to 2.27) |
| 13–15 | 1.33 (1.21 to 1.46) |
| 16–17 | Reference |
| Spherical equivalent | p value<0.0001 |
| (−1; −0.5) | Reference |
| (−2; −1) | 4.78 (3.16 to 7.22) |
| (−3; −2) | 17.81 (11.96 to 26.52) |
| (−4; −3) | 56.73 (38.34 to 83.96) |
| ≤ −4 | 398.35 (270.80 to 585.99) |
| Gender | p value<0.0001 |
| M | Reference |
| F | 1.18 (1.12 to 1.25) |
Discussion
The objective of our study was to describe the progression of myopia in France using a cohort of individuals aged 4–17 years at baseline and followed for up to 6.5 years from 2013 to 2019.
This study showed that factors associated with faster myopia progression were gender, with girls being more prone to progression than boys, higher myopia at baseline, and age between 7 and 12 years. The large sample size results in a number of significant differences that are clinically unremarkable. For example, the faster progression in females amounts to only 0.18 D over 6 years. The differences among myopia levels less than –1 D are similarly small and not clinically meaningful.
In the current study, we observed a small difference of 0.03 D or a 9% difference in terms of myopia progression between girls and boys. The literature shows that myopic girls progress slightly faster than myopic boys. Hyman et al show a difference of 0.16 D over 3 years (p<0.05), but there was no difference in axial elongation.18 Similarly, Donovan et al considered the effect of gender in their meta-analysis on the rates of myopia progression. For an average baseline age of 8.8 years, estimated annual progression was significantly faster (p<0.01) for females (–0.80 D) than for males (–0.71 D).12 This difference has also been observed in Indian and Chinese studies19 20 along with other longitudinal studies of North American children.21
Despite these convergent results, it is difficult to explain this difference. Slightly more nearby work activities or less outdoor time among girls could be supposed, but this still remains speculative.
Age is the most important factor determining the mean progression rate and the proportion of fast progressors, but age is not a monotonic factor, with 7–9 year old myopes progressing faster and both younger and older children progressing more slowly. The slower progression in younger children, with very young onset of myopia could reflect a different aetiology. They have not been studied as frequently as school-age myopes and future research may cast light on this hypothesis.
Few prospective studies have shown the relationship between age at myopia onset and myopia severity.8 15 22 Most of them have focused on a particular age range, from 7 to 9 years8 22 or from 9 to 12.15 In the current study, given the large sample size, we were able to evaluate the progression of myopia in different age groups, from 4 to 17 years old, and showed that myopia progressed more rapidly in children aged 7–9 years old and 10–12 years old, with mean myopia progression of –0.40 D and –0.41 D over 11–24 months, respectively. These progression rates are smaller than those reported in different clinical trials conducted in Taiwan, Singapore, China and Hong Kong23–28 with reported values varying from –0.63 D/year to –2.00 D/year. Ethnicity is clearly an important factor in rate of progression with children of East Asian descent progressing faster than those of European ancestry.12 This difference could be partially explained by different exposure to environmental and genetic risk factors and by the fact that children included in interventional clinical trials may be more prone to faster progression than those in an observational study. However, the progression reported in our study is relatively close to the mean rate of progression reported in the control arm of children aged 6–15 years of the Houston Myopia Control Study (–0.34 D/year),29 and of myopic children aged 5–15 years in the North India Myopia Study (–0.27 D/year).30 The recently completed Bifocal Lenses In Nearsighted Kids Study reported a 3-year progression of –1.05 D in the control group wearing single vision soft lenses (–0.35 D/year).31 An earlier 3-year clinical trial reported a 3-year progression of –1.10 D in the control group wearing spectacles (–0.37 D/year).32 The majority of children in both studies were of European descent and the mean age at baseline was around 10 years.
We also analysed the percentage of children progressing by at least 0.50 D/year over the first 11–24 months, since this is a proposed criterion for the implementation of preventive strategies aimed at reducing myopia progression.33 In this context, higher proportions of progressors were observed within the 7–9 and 10–12 years old age groups, accounting for 33.1% and 29.4%, respectively, compared with 24.9% of the whole cohort (table 2).
Furthermore, the initial progressor profile defined within the 11–24-month period following the baseline correction was predictive of higher progression of myopia during the 5.5 years of follow-up for almost all age groups, except for 16–17 years (figure 4). This could be explained by the fact that the mean age at myopia stabilisation is usually close to this age range.11 We also observed that every diopter at baseline matters appreciably in terms of risk of developing high myopia during the follow-up. Indeed, between myopia ranges –3 to –4 and –4 to –6 D (–6 D being excluded), the risk of developing high myopia increased from 16% to 58% (figure 5). These observations call for precise screening and follow-up of myopic children during an era of preventive approaches regarding myopia progression.
The increased prevalence of myopia in industrialised countries could be largely due to lifestyle, notably a reduction in outdoor activities combined with an increase of close-range work activities and more intensive and extensive educational coverage.2–7 34–36 Estimates state that in children a reduction in the risk of myopia is obtained for each hour a week spent outdoors.34 Furthermore, early exposure to daylight could have a beneficial impact on the development of myopia. Indeed, a Chinese study showed that children born in winter are more prone to become myopic than children born in other seasons.37 More accurate estimation of myopia progression and its risk factors may be accompanied by more personalised preventive strategies combining a modification of life style2–7 35 38 and pharmacological19–27 or optical approaches31 39 in view of preventing myopia progression. In fact, it is likely that reduction of myopia progression during childhood could have an impact on myopia severity in adulthood and may thereby influence the incidence of myopia-related complications, that is, glaucoma, cataract, retinal detachment, myopic maculopathy and myopic neovascularisation.40
Strengths and limitations of this study
This is the first prospective study on myopia including a large sample of over 130 000 children and teenagers. The strength of this study is its design, which provided original data on myopia progression according to age, gender and degree of myopia in a very large, young population over a 6.5-year period. We also acknowledge several weaknesses in this study. First, information on cycloplegia prior to refractive error measurement was not included, even though, according to national recommendations, cycloplegia is usually used in children. This may have resulted in some of the children in the lowest myopia category being misclassified, perhaps accounting for the slower progression rate among these subjects. In longitudinal clinical studies and trials, autorefraction is preferred. Likewise, axial length was not measured in this study.
Second, children with more rapid and longer myopia progression could be over-represented, given that they would require more frequent changes of optical correction than those with more stable vision. This may explain a paradox in the data: while it is clear that older children progress more slowly (figure 2A), the different age groups do not appear to slow over time. This may be due to more stable children having shorter follow-up and only those who continue to progress attending examination later in the study. Furthermore, the fact that progression rates remain linear within each of the age groups can reflect the fact that prescription of optical correction prevents accelerated progression during the 7–9-year period. Progression in children wearing a myopic correction may be faster compared with those uncorrected, although deliberate undercorrection may accelerate progression.41 Thus, the inclusion of only children receiving prescriptions in the current study may have influenced progression rates. Furthermore, because it is likely that a new prescription was given in case of modification of refractive error of ±0.50 D and no lesser, smaller refractive changes were possibly not reported, despite smaller progression.
Conclusion
This is the first French prospective study on myopia in children with a large sample size, providing estimations of myopia progression according to age, gender and initial degree of myopia at first correction.
Acknowledgments
We acknowledge Krys Group for providing material support (anonymised data for study purpose).
Footnotes
Contributors: DT participated to research execution and manuscript preparation; SM participated to research execution and data analysis; PI participated to research execution, data analysis and manuscript revision; MAB participated to research execution, data analysis, manuscript preparation and manuscript revision; RRAB participated to research execution, data analysis, manuscript preparation and manuscript revision. NL performed research design, participated to research execution, data analysis, manuscript preparation and manuscript revision.
Funding: This work was supported by Krys Group grant number N° 2016/585.
Competing interests: None declared.
Provenance and peer review: Not commissioned; externally peer reviewed.
Data availability statement
Data may be available on request for further analyses please contact nicolas.leveziel@yahoo.fr.
Ethics statements
Patient consent for publication
Not required.
Ethics approval
The study adhered to the tenets of the Declaration of Helsinki and was approved by the Ethics Committee of the French Society of Ophthalmology (IRB 00008855).
References
- 1. Holden BA, Fricke TR, Wilson DA, et al. Global prevalence of myopia and high myopia and temporal trends from 2000 through 2050. Ophthalmology 2016;123:1036–42. 10.1016/j.ophtha.2016.01.006 [DOI] [PubMed] [Google Scholar]
- 2. Rose KA, Morgan IG, Ip J, et al. Outdoor activity reduces the prevalence of myopia in children. Ophthalmology 2008;115:1279–85. 10.1016/j.ophtha.2007.12.019 [DOI] [PubMed] [Google Scholar]
- 3. He M, Xiang F, Zeng Y, et al. Effect of time spent outdoors at school on the development of myopia among children in China: a randomized clinical trial. JAMA 2015;314:1142–8. 10.1001/jama.2015.10803 [DOI] [PubMed] [Google Scholar]
- 4. Ip JM, Saw S-M, Rose KA, et al. Role of near work in myopia: findings in a sample of Australian school children. Invest Ophthalmol Vis Sci 2008;49:2903. 10.1167/iovs.07-0804 [DOI] [PubMed] [Google Scholar]
- 5. Jin J-X, Hua W-J, Jiang X, et al. Effect of outdoor activity on myopia onset and progression in school-aged children in northeast China: the Sujiatun eye care study. BMC Ophthalmol 2015;15:73. 10.1186/s12886-015-0052-9 [DOI] [PMC free article] [PubMed] [Google Scholar]
- 6. Dirani M, Tong L, Gazzard G, et al. Outdoor activity and myopia in Singapore teenage children. Br J Ophthalmol 2009;93:997–1000. 10.1136/bjo.2008.150979 [DOI] [PubMed] [Google Scholar]
- 7. Nickels S, Hopf S, Pfeiffer N, et al. Myopia is associated with education: results from NHANES 1999-2008. PLoS One 2019;14:e0211196. 10.1371/journal.pone.0211196 [DOI] [PMC free article] [PubMed] [Google Scholar]
- 8. Chua SYL, Sabanayagam C, Cheung Y-B, et al. Age of onset of myopia predicts risk of high myopia in later childhood in myopic Singapore children. Ophthalmic Physiol Opt 2016;36:388–94. 10.1111/opo.12305 [DOI] [PubMed] [Google Scholar]
- 9. Kleinstein RN, Sinnott LT, Jones-Jordan LA, et al. New cases of myopia in children. Arch Ophthalmol 2012;130:1274. 10.1001/archophthalmol.2012.1449 [DOI] [PMC free article] [PubMed] [Google Scholar]
- 10. French AN, Morgan IG, Burlutsky G, et al. Prevalence and 5- to 6-year incidence and progression of myopia and hyperopia in Australian schoolchildren. Ophthalmology 2013;120:1482–91. 10.1016/j.ophtha.2012.12.018 [DOI] [PubMed] [Google Scholar]
- 11. Hyman L, Gwiazda M-T, COMET Group . Myopia stabilization and associated factors among participants in the correction of myopia evaluation trial (comet). Invest Ophthalmol Vis Sci 2013;54:7871. 10.1167/iovs.13-12403 [DOI] [PMC free article] [PubMed] [Google Scholar]
- 12. Donovan L, Sankaridurg P, Ho A, et al. Myopia progression rates in urban children wearing single-vision spectacles. Optom Vis Sci 2012;89:27–32. 10.1097/OPX.0b013e3182357f79 [DOI] [PMC free article] [PubMed] [Google Scholar]
- 13. Kurtz D, Hyman L, Gwiazda JE, et al. Role of parental myopia in the progression of myopia and its interaction with treatment in comet children. Invest Ophthalmol Vis Sci 2007;48:562. 10.1167/iovs.06-0408 [DOI] [PubMed] [Google Scholar]
- 14. Williams KM, Hysi PG, Nag A, et al. Age of myopia onset in a British population-based twin cohort. Ophthalmic Physiol Opt 2013;33:339–45. 10.1111/opo.12042 [DOI] [PubMed] [Google Scholar]
- 15. Jensen H. Myopia in teenagers. An eight-year follow-up study on myopia progression and risk factors. Acta Ophthalmol Scand 1995;73:389–93. 10.1111/j.1600-0420.1995.tb00294.x [DOI] [PubMed] [Google Scholar]
- 16. Flitcroft DI, He M, Jonas JB, et al. IMI - defining and classifying myopia: a proposed set of standards for clinical and epidemiologic studies. Invest Ophthalmol Vis Sci 2019;60:M20–30. 10.1167/iovs.18-25957 [DOI] [PMC free article] [PubMed] [Google Scholar]
- 17. Logan NS, Gilmartin B, Marr JE, et al. Community-Based study of the association of high myopia in children with ocular and systemic disease. Optom Vis Sci 2004;81:11–13. 10.1097/00006324-200401000-00004 [DOI] [PubMed] [Google Scholar]
- 18. Hyman L, Gwiazda J, Hussein M, et al. Relationship of age, sex, and ethnicity with myopia progression and axial elongation in the correction of myopia evaluation trial. Arch Ophthalmol 2005;123:977–87. 10.1001/archopht.123.7.977 [DOI] [PubMed] [Google Scholar]
- 19. Saxena R, Vashist P, Tandon R, et al. Incidence and progression of myopia and associated factors in urban school children in Delhi: the North India myopia study (nim study). PLoS One 2017;12:e0189774. 10.1371/journal.pone.0189774 [DOI] [PMC free article] [PubMed] [Google Scholar]
- 20. Zhou W-J, Zhang Y-Y, Li H, et al. Five-year progression of refractive errors and incidence of myopia in school-aged children in Western China. J Epidemiol 2016;26:386–95. 10.2188/jea.JE20140258 [DOI] [PMC free article] [PubMed] [Google Scholar]
- 21. COMET Group . Myopia stabilization and associated factors among participants in the correction of myopia evaluation trial (comet). Invest Ophthalmol Vis Sci 2013;54:7871–84. 10.1167/iovs.13-12403 [DOI] [PMC free article] [PubMed] [Google Scholar]
- 22. Saw S-M, Tong L, Chua W-H, et al. Incidence and progression of myopia in Singaporean school children. Invest Ophthalmol Vis Sci 2005;46:51. 10.1167/iovs.04-0565 [DOI] [PubMed] [Google Scholar]
- 23. Yen MY, Liu JH, Kao SC, et al. Comparison of the effect of atropine and cyclopentolate on myopia. Ann Ophthalmol 1989;21:180–2. [PubMed] [Google Scholar]
- 24. Chua W-H, Balakrishnan V, Chan Y-H, et al. Atropine for the treatment of childhood myopia. Ophthalmology 2006;113:2285–91. 10.1016/j.ophtha.2006.05.062 [DOI] [PubMed] [Google Scholar]
- 25. Yi S, Huang Y, Yu S-Z, et al. Therapeutic effect of atropine 1% in children with low myopia. J Aapos 2015;19:426–9. 10.1016/j.jaapos.2015.04.006 [DOI] [PubMed] [Google Scholar]
- 26. Wang Y-R, Bian H-L, Wang Q. Atropine 0.5% eyedrops for the treatment of children with low myopia: A randomized controlled trial. Medicine 2017;96:e7371. 10.1097/MD.0000000000007371 [DOI] [PMC free article] [PubMed] [Google Scholar]
- 27. Yam JC, Jiang Y, Tang SM, et al. Low-concentration atropine for myopia progression (LAMP) study: a randomized, double-blinded, placebo-controlled trial of 0.05%, 0.025%, and 0.01% atropine eye drops in myopia Control. Ophthalmology 2019;126:113–24. 10.1016/j.ophtha.2018.05.029 [DOI] [PubMed] [Google Scholar]
- 28. Fan DSP, Lam DSC, Lam RF, et al. Prevalence, incidence, and progression of myopia of school children in Hong Kong. Invest Ophthalmol Vis Sci 2004;45:1071. 10.1167/iovs.03-1151 [DOI] [PubMed] [Google Scholar]
- 29. Grosvenor T, Perrigin DM, Perrigin J, et al. Houston myopia control study: a randomized clinical trial. Part II. final report by the patient care team. Am J Optom Physiol Opt 1987;64:482–98. [PubMed] [Google Scholar]
- 30. Saxena R, Vashist P, Tandon R, et al. Incidence and progression of myopia and associated factors in urban school children in Delhi: the North India myopia study (nim study). PLoS One 2017;12:e01897746. 10.1371/journal.pone.0189774 [DOI] [PMC free article] [PubMed] [Google Scholar]
- 31. Walline JJ, Walker MK, Mutti DO, et al. Effect of high add power, medium add power, or Single-Vision contact lenses on myopia progression in children: the blink randomized clinical trial. JAMA 2020;324:571–80. 10.1001/jama.2020.10834 [DOI] [PMC free article] [PubMed] [Google Scholar]
- 32. Walline JJ, Jones LA, Sinnott L, et al. A randomized trial of the effect of soft contact lenses on myopia progression in children. Invest Ophthalmol Vis Sci 2008;49:4702–6. 10.1167/iovs.08-2067 [DOI] [PubMed] [Google Scholar]
- 33. Walline JJ, Lindsley K, Vedula SS, et al. Interventions to slow progression of myopia in children. Cochrane Database Syst Rev 2011:CD004916. 10.1002/14651858.CD004916.pub3 [DOI] [PMC free article] [PubMed] [Google Scholar]
- 34. Rose KA, Morgan IG, Smith W, et al. Myopia, lifestyle, and schooling in students of Chinese ethnicity in Singapore and Sydney. Arch Ophthalmol 2008;126:527–30. 10.1001/archopht.126.4.527 [DOI] [PubMed] [Google Scholar]
- 35. French AN, Ashby RS, Morgan IG, et al. Time outdoors and the prevention of myopia. Exp Eye Res 2013;114:58–68. 10.1016/j.exer.2013.04.018 [DOI] [PubMed] [Google Scholar]
- 36. Wang J, Li Y, Musch DC, et al. Progression of myopia in school-aged children after COVID-19 home confinement. JAMA Ophthalmol 2021:e206239. 10.1001/jamaophthalmol.2020.6239 [DOI] [PMC free article] [PubMed] [Google Scholar]
- 37. Ma Q, Xu W, Zhou X, et al. The relationship of season of birth with refractive error in very young children in eastern China. PLoS One 2014;9:e100472. 10.1371/journal.pone.0100472 [DOI] [PMC free article] [PubMed] [Google Scholar]
- 38. Wu P-C, Tsai C-L, Wu H-L, P-C W, H-L W, et al. Outdoor activity during class recess reduces myopia onset and progression in school children. Ophthalmology 2013;120:1080–5. 10.1016/j.ophtha.2012.11.009 [DOI] [PubMed] [Google Scholar]
- 39. Chamberlain P, Peixoto-de-Matos SC, Logan NS, et al. A 3-year randomized clinical trial of MiSight lenses for myopia control. Optom Vis Sci 2019;96:556–67. 10.1097/OPX.0000000000001410 [DOI] [PubMed] [Google Scholar]
- 40. Qiu M, Wang SY, Singh K, et al. Association between myopia and glaucoma in the United States population. Invest Ophthalmol Vis Sci 2013;54:830. 10.1167/iovs.12-11158 [DOI] [PMC free article] [PubMed] [Google Scholar]
- 41. Logan NS, Wolffsohn JS. Role of un-correction, under-correction and over-correction of myopia as a strategy for slowing myopic progression. Clin Exp Optom 2020;103:133–7. 10.1111/cxo.12978 [DOI] [PubMed] [Google Scholar]
Associated Data
This section collects any data citations, data availability statements, or supplementary materials included in this article.
Data Availability Statement
Data may be available on request for further analyses please contact nicolas.leveziel@yahoo.fr.