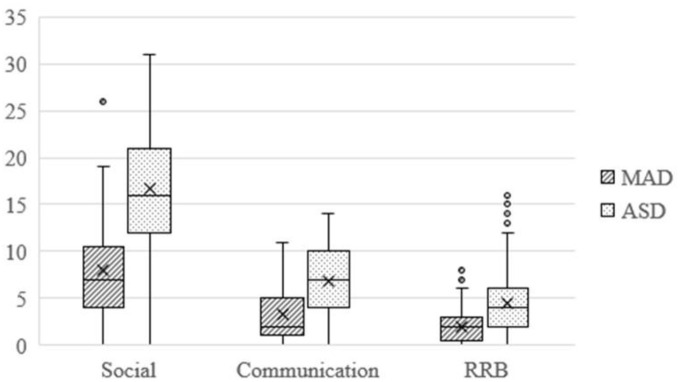
Figure 3.
Boxplot for algorithm scores of ADI-R.
It shows quartile range. Middle lines indicate medians. An X indicates the group’s mean. Dots indicate outliers. Social: social domain score; communication: communication domain score; RRB: restricted, repetitive behavior domain score; ADI-R: Autism Diagnostic Interview–Revised.

