Abstract
Background
Clustering key clinical characteristics of participants in the Severe Asthma Research Program (SARP), a large, multicenter prospective observational study of patients with asthma and healthy controls, has led to the identification of novel asthma phenotypes.
Purpose
To determine whether quantitative CT (qCT) could help distinguish between clinical asthma phenotypes.
Materials and Methods
A retrospective cross-sectional analysis was conducted with the use of qCT images (maximal bronchodilation at total lung capacity [TLC], or inspiration, and functional residual capacity [FRC], or expiration) from the cluster phenotypes of SARP participants (cluster 1: minimal disease; cluster 2: mild, reversible; cluster 3: obese asthma; cluster 4: severe, reversible; cluster 5: severe, irreversible) enrolled between September 2001 and December 2015. Airway morphometry was performed along standard paths (RB1, RB4, RB10, LB1, and LB10). Corresponding voxels from TLC and FRC images were mapped with use of deformable image registration to characterize disease probability maps (DPMs) of functional small airway disease (fSAD), voxel-level volume changes (Jacobian), and isotropy (anisotropic deformation index [ADI]). The association between cluster assignment and qCT measures was evaluated using linear mixed models.
Results
A total of 455 participants were evaluated with cluster assignments and CT (mean age ± SD, 42.1 years ± 14.7; 270 women). Airway morphometry had limited ability to help discern between clusters. DPM fSAD was highest in cluster 5 (cluster 1 in SARP III: 19.0% ± 20.6; cluster 2: 18.9% ± 13.3; cluster 3: 24.9% ± 13.1; cluster 4: 24.1% ± 8.4; cluster 5: 38.8% ± 14.4; P < .001). Lower whole-lung Jacobian and ADI values were associated with greater cluster severity. Compared to cluster 1, cluster 5 lung expansion was 31% smaller (Jacobian in SARP III cohort: 2.31 ± 0.6 vs 1.61 ± 0.3, respectively, P < .001) and 34% more isotropic (ADI in SARP III cohort: 0.40 ± 0.1 vs 0.61 ± 0.2, P < .001). Within-lung Jacobian and ADI SDs decreased as severity worsened (Jacobian SD in SARP III cohort: 0.90 ± 0.4 for cluster 1; 0.79 ± 0.3 for cluster 2; 0.62 ± 0.2 for cluster 3; 0.63 ± 0.2 for cluster 4; and 0.41 ± 0.2 for cluster 5; P < .001).
Conclusion
Quantitative CT assessments of the degree and intraindividual regional variability of lung expansion distinguished between well-established clinical phenotypes among participants with asthma from the Severe Asthma Research Program study.
© RSNA, 2022
Online supplemental material is available for this article.
See also the editorial by Verschakelen in this issue.
Summary
In patients with severe asthma, quantitative CT showed lung expansion characterized by lower magnitude and higher isotropy compared to those with non-severe asthma.
Key Results
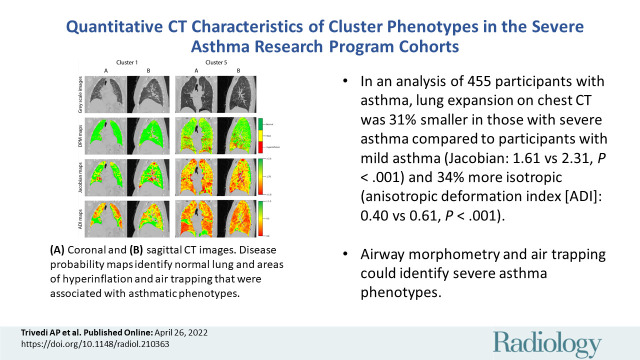
■ In a secondary analysis of 455 participants with asthma who underwent thoracic CT, expiration-to-inspiration lung expansion was 31% smaller in severe asthma than in mild asthma in magnitude (Jacobian: 1.61 vs 2.31, respectively, P < .001) and 34% more isotropic (anisotropic deformation index [ADI]: 0.40 vs 0.61, P < .001).
■ The Jacobian and ADI variability within lungs were 55% (0.41 vs 0.90, respectively) and 37% (0.33 vs 0.52) lower in severe versus mild asthma (P < .001).
■ Airway morphometry and air trapping could only help identify very severe asthma phenotypes.
Introduction
Asthma affects approximately 5% of the U.S. population, accounting for annual direct costs in excess of $50 billion (1). While only 5%–10% of patients with asthma have severe refractory disease (2), the treatment of severe refractory asthma is substantially more costly than that of non-severe asthma (3). The identification of novel "endotypes" of asthma with the use of techniques such as cluster analyses (4–7) has revolutionized the treatment of asthma and has led to the targeting of specific pathobiologic mechanisms (8). However, more than 60% of patients with severe asthma may not be eligible for biologic therapies (9).
New techniques are necessary to unravel the mechanisms underlying severe refractory asthma. Quantitative analyses of CT scans performed with standardized protocols allow for precise structural and functional measurements of lung and airway anatomy (10). Airway measurements of wall thickness and lumen diameter are associated with disease severity and histopathologic remodeling (11). Air trapping, defined by areas of low parenchymal attenuation on expiratory CT images, is associated with symptom burden and exacerbation frequency (12). Newer functional measurements measure regional changes in the degree and direction of lung expansion and offer insight into the physiologic characteristics of severe asthma (13).
Quantitative CT (qCT) assessments have primarily focused on distinguishing between traditional asthma severity classifications, which tend to include patients with a broad range of symptoms, exacerbations, and other clinical features and fail to capture the diversity of asthma phenotypes (14). The Severe Asthma Research Program (SARP) is a large, multicenter, prospective, observational study that has characterized patients with asthma with varying degrees of severity and healthy controls with clinical assessments, biomarkers, and thoracic imaging, including qCT (15–17). To better categorize heterogeneous asthma phenotypes, SARP investigators conducted unsupervised hierarchical cluster analyses to identify five distinct clinical phenotypes that differ in symptoms, severity, and health care utilization (4). We sought to determine whether qCT characteristics could help distinguish between these diverse asthma phenotypes in a cross-sectional analysis of SARP participants and potentially provide valuable insight into the structural and functional characteristics of the lungs and airways that underpin these phenotypes (4). Some results were previously reported in abstract form (18–20).
Materials and Methods
Participants
We performed a retrospective cross-sectional analysis of consecutive participants from three prospective SARP cohorts (SARP I: 2001–2006; SARP II: 2007–2012; SARP III: 2011–2015; ClinicalTrials.gov identifier: NCT01606826). Site-specific institutional review boards approved the study, and the study was compliant with the Health Insurance Portability and Accountability Act. All participants provided informed consent and underwent comprehensive testing and characterization (4). Current smokers and ex-smokers who smoked more than 10 packs-years (age ≥30 years) or more than 5 pack-years (age <30 years) were excluded. Full inclusion and exclusion criteria have been reported (16,17). This study includes participants from three SARP cohorts (Fig 1) with new qCT imaging assessments to characterize structural and functional differences between clusters.
Figure 1:
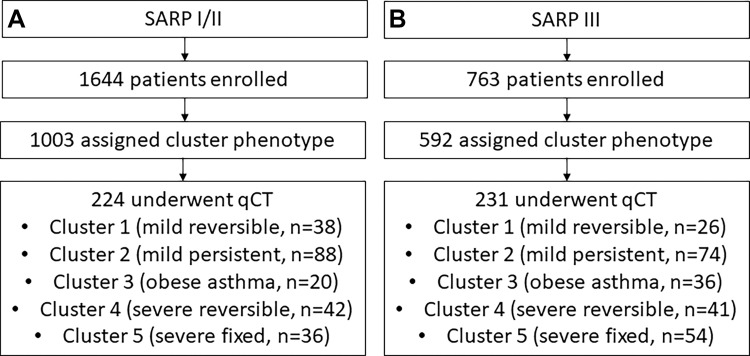
Flowcharts show the enrollment of the study cohort from the overall (A) Severe Asthma Research Program (SARP) I and II and (B) SARP III cohorts. qCT = quantitative CT.
Cluster Analysis
We have previously reported cluster definitions and have outlined the derivation in Appendix E2 (online) (4). Cluster 1 consisted of 88 women of 110 participants (80%) with normal forced expiratory volume in 1 second (FEV1) and low health care use. Cluster 2 participants were older than cluster 1 (mean age ± SD: 33 years ± 12 vs 27 years ± 8, respectively), with normal post-bronchodilator FEV1 but higher health care and medication use than cluster 1. Cluster 3 participants were older than clusters 1 and 2 (mean age: 50 years ± 8), with high body mass index (mean: 33 kg/m2 ± 9) and lower post-bronchodilator FEV1 (mean: 84% ± 9), despite short duration of asthma (mean: 9 years before enrollment ± 7). Cluster 4 had early-onset disease (mean age at onset: 8 years ± 10) with severely impaired prebronchodilator FEV1 (mean: 57% ± 12) that partially reversed with bronchodilators (mean FEV1: 76% ± 12). Cluster 5 participants had a later age of onset (mean: 21 years), long asthma duration (mean: 29 years ± 15), severe airflow obstruction (mean prebronchodilator FEV1: 43% ± 14), and more comorbidities (eg, hypertension).
CT Image Acquisition
All 455 participants from the SARP I and II (hereafter, SARP I/II) and III cohorts had baseline cluster and qCT data at full inspiration (total lung capacity [TLC]) and expiration (functional residual capacity [FRC]). Noncontrast inspiratory and expiratory CT images were obtained after maximal bronchodilation with the use of standardized protocols (21). CT acquisition parameters included the following: pitch of 0.984 (GE Healthcare) or 1.0 (Siemens Healthineers), 120 kVp, and 50–165 effective mAs, depending on body mass index (details in Appendix E2 [online]). Images were obtained per 360° rotation with the use of narrow section collimation (range, 0.625–1.25 mm).
CT Airway Morphometry
We quantitatively analyzed CT airway morphometry and lung attenuation using an Apollo Workstation (VIDA Diagnostics, with >20 years of qCT experience). Principal qCT analyses were overseen by three authors (S.M., J.S., and S.P., with 5–15 years of qCT experience) under the guidance of two other authors (E.A.H. and J.R., with >40 years and >20 years of qCT experience, respectively). Analysts were blinded to clinical data and cluster assignment. We used automated segmentation methods to identify five primary paths (RB1, RB4, RB10, LB1, and LB10) (22). We measured wall area, wall area percentage, wall thickness, wall thickness percentage, airway eccentricity, lumen area, and square root of bronchial wall area for a theoretical airway with an internal perimeter of 10 mm (Pi10); further calculations and reproducibility data are in Appendix E1 (online).
CT Lung Attenuation and Voxel-Level Expansion
We measured the following lung attenuation parameters at the whole-lung level: total lung volume at TLC and FRC, tissue and air volume (23), mean lung attenuation, air trapping percentage (percentage of lung –856 HU or less at FRC), and hyperinflation percent (percentage of lung –950 HU or less at TLC). These cutoffs have been previously validated in studies of asthma and chronic obstructive pulmonary disease (11,12,24). Calculations of lung, tissue, and air volumes are in Appendix E2 (online).
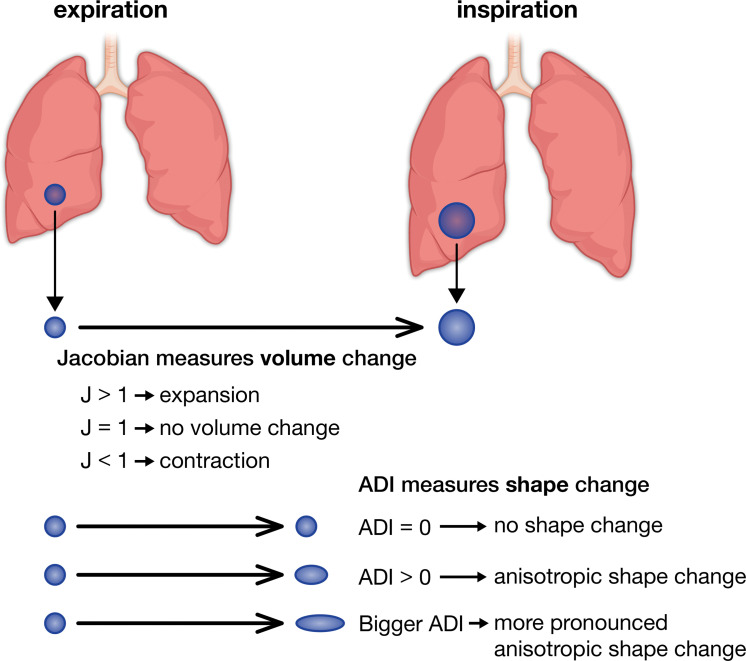
We used a mass-preserving deformable image registration to map corresponding voxels from TLC and FRC scans and capture the magnitude (Jacobian) and isotropy (anisotropic deformation index [ADI]) of expiratory-to-inspiratory voxel-level expansion (23,25). Figure 2 illustrates the concepts of Jacobian and ADI; increasing values imply increasing magnitude or anisotropy, respectively. Jacobian and ADI differences between the top and bottom 10% of the lung were calculated as craniocaudal gradients and differences between the anterior and posterior 10% as posteroanterior gradients. Gradient analyses excluded the outer 15% of the lung relative to the direction of interest (26). Finally, we used registered inspiratory and expiratory images to generate disease probability maps (DPMs) (27) and parametric response maps (28) that classify paired voxels as normal, functional small airway disease (fSAD) (parametric response map fSAD, TLC less than –950 HU, and FRC less than –856 HU), or hyperinflation (hyperinflation by parametric response map, TLC less than –950 HU and FRC less than –856 HU). Parametric response maps use discrete cutoffs to categorize voxels, while DPM uses a probabilistic method to do so. Because improvements in scanner technology and differences in clustering may have affected results (Appendix E3 [online]), we reported and analyzed SARP I/II and SARP III measurements separately.
Figure 2:
Visual representation of Jacobian (J) and anisotropic deformation index (ADI) values. A Jacobian greater than 1 implies expansion of a voxel between inspiration and expiration, a Jacobian of 1 implies no volume change, and a Jacobian of less than 1 implies voxel contraction. An ADI of 0 implies that a voxel completely preserves its shape between inspiration and expiration, while an increasing ADI implies more anisotropic expansion.
Statistical Analysis
We evaluated the association between cluster assignment and qCT measures using a linear mixed model approach. Cluster was treated as a fixed effect, and site was treated as a random effect. P < .05 was considered to indicate a significant difference. Overall differences between clusters were assessed using F tests. If F test results were significant, then pairwise comparisons were evaluated for prespecified clusters (1,2,4,5), excluding cluster 3, the smallest cluster in the derivation study, to limit pairwise comparisons (4). Baseline clinical and physiologic characteristics were compared between clusters with use of analysis of variance, the χ2 test, or the Fisher exact test. We tested associations between qCT measures using the Pearson correlation coefficients. All analyses were prespecified and conducted in SAS version 9.4 by two authors (D.L. and C.W.G., with 4 years and 7 years of experience, respectively).
Results
Patient Characteristics
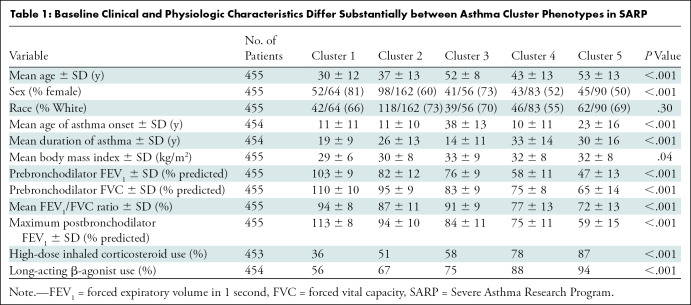
SARP I and II included an aggregate of more than 1644 participants with varying disease severity, and SARP III included 763 participants. Of these, 1595 SARP participants had an assigned cluster (1003 in SARP I/II, 592 in SARP III) and 455 participants from all SARP cohorts underwent qCT (224 in SARP I/II, 231 in SARP III). Figure 1 summarizes our cohort selection. Table 1 shows the baseline demographic characteristics of the SARP cohorts according to cluster assignment. As expected with the algorithms used to generate these clusters, there were notable clinical and physiologic differences. Table E1 (online) shows differences between participants who did or did not undergo qCT; the largest difference noted was that more SARP III participants who underwent qCT used high-dose inhaled corticosteroids (qCT: 166 of 231 participants, 72%; no qCT: 199 of 361 participants, 55%). While most of the clinical and physiologic parameters in clusters were not different when comparing SARP I/II and III clusters, some were notably different and are summarized in Table E2 (online). In particular, when comparing SARP III to SARP I/II, oral corticosteroid use was lower in clusters 4 (–45%) and 5 (–24%), cluster 3 participants developed asthma later (mean age at onset, 42 years ± 9 vs 33 years ± 17, respectively) and had 31% higher usage of long-acting β-agonists, and cluster 1 participants had 37% higher use of inhaled corticosteroids. Mean radiation dose for SARP III participants was 3.8 mSv ± 0.8 for inspiratory scans and 1.9 mSv ± 0.4 for expiratory scans. The mean radiation doses for SARP I and II were not available.
Table 1:
Baseline Clinical and Physiologic Characteristics Differ Substantially between Asthma Cluster Phenotypes in SARP
qCT Airway Morphometry
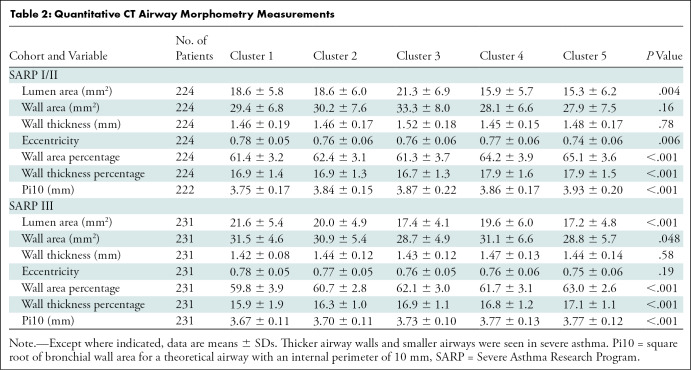
The following third-generation airway morphometric measurements differed between clusters in both cohorts: lumen area, wall area percentage, wall thickness percentage, and Pi10 (Table 2). Additionally, eccentricity differed between clusters in SARP I/II, and wall area differed between clusters in SARP III. In general, severe asthma clusters (4,5) were characterized by thicker airway walls relative to the lumen but smaller total airway size compared with mild clusters (1,2). Airway lumens in cluster 5 were smaller than those in cluster 1 in SARP I/II (–2.97 mm2, P = .03) and smaller than those in clusters 1 (–4.34 mm2, P < .001), 2 (–2.72 mm2, P = .003), and 4 (–2.69 mm2, P = .01) in SARP III (Fig E1A [online]). Wall thickness percentage was higher in cluster 4 (mean, 17.9% ± 1.6) and cluster 5 (mean, 17.9% ± 1.5) compared with clusters 1 (mean, 16.9% ± 1.4) and 2 (mean, 16.9% ± 1.3) in SARP I/II, and this pattern was repeated in SARP III and when Pi10 was used to estimate airway wall thickness, with the exception of wall thickness percentage in SARP III clusters 2 and 4 (difference in wall thickness percentage: 0.37%, P = .12) (Figs E1A–C [online]; P < .01 for all comparisons). This contributed to the significantly higher wall area percentage in clusters 4 (mean, 64.2% ± 3.9) and 5 (mean, 65.1% ± 3.6) compared with 1 (mean, 61.4% ± 3.2) and 2 (mean, 62.4% ± 3.1) in SARP I/II, with similar findings in SARP III with the exception of clusters 2 (mean, 60.7% ± 2.8) and 4 (mean, 61.7% ± 3.1) (Fig E1C [online]).
Table 2:
Quantitative CT Airway Morphometry Measurements
qCT Lung Attenuation Measurements
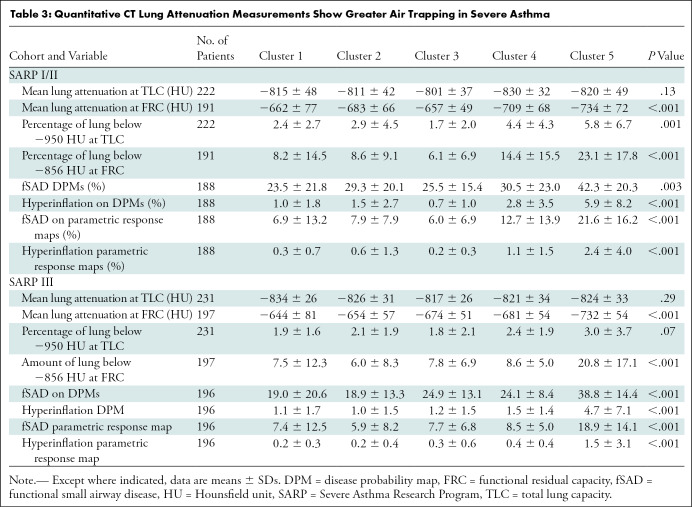
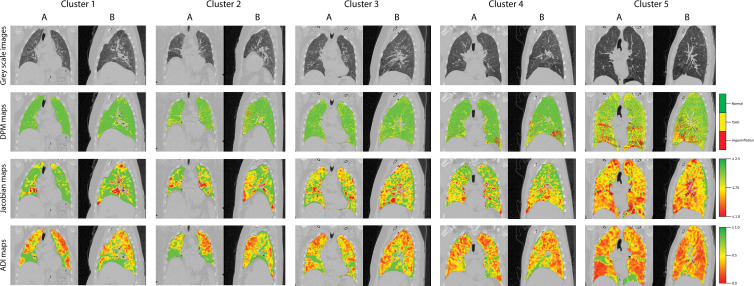
Table 3 shows the qCT lung attenuation measurements according to cluster. We found significant differences between clusters in both cohorts for mean lung attenuation at FRC, air trapping percentage (Hounsfield unit less than –856), and the percentage of lung classified as showing fSAD or hyperinflation on parametric response maps and DPMs. Hyperinflation percentage (Hounsfield unit less than –950) differed between clusters in SARP I/II but not SARP III. Pairwise comparisons showed that only cluster 5 had higher air trapping compared with clusters 1, 2, or 4, whether through the use of fSAD-parametric response maps (Fig E2A [online]), fSAD DPMs (Fig E2B [online]), or percentage air trapping (Fig E2C [online]). For example, the mean fSAD DPM in SARP II cluster 5 was 18.9% ± 1.5, compared with a mean of 5.9%–8.5% for clusters 1–4. Figure 3 shows representative gray-scale DPM, Jacobian, and ADI maps for SARP III clusters.
Table 3:
Quantitative CT Lung Attenuation Measurements Show Greater Air Trapping in Severe Asthma
Figure 3:
Representative (A) coronal and (B) sagittal gray-scale CT scans, disease probability maps (DPMs), Jacobian maps, and anisotropic deformation index (ADI) images from noncontrast CT scans in patients in the Severe Asthma Research Program III cohort according to cluster. For DPMs, green voxels represent normal lung tissue, yellow voxels represent functional air trapping, and red voxels represent hyperinflation. For Jacobian and ADI maps, voxels are represented on a gradient from green to yellow to red. For Jacobian maps, green voxels represent Jacobian values greater than or equal to 2.5, yellow voxels represent a Jacobian value of 1.75, and red voxels represent Jacobian values less than or equal to 1.0. For ADI maps, green voxels represent ADI values greater than or equal to 1.0, yellow voxels represent an ADI of 0.5, and red voxels represent an ADI of 0. fSAD = functional small airway disease.
qCT Voxel-Level Expansion Measurements
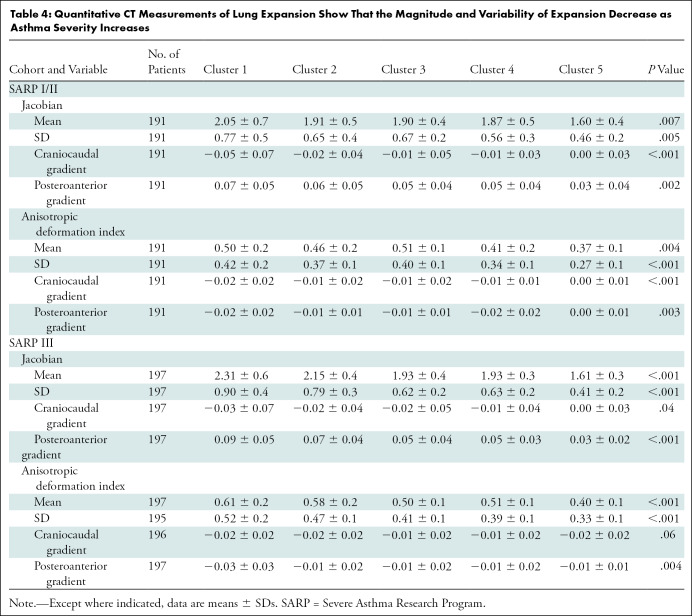
Table 4 shows qCT lung expansion according to cluster. We found significant differences between clusters in both cohorts for mean Jacobian and ADI, within-lung SDs of Jacobian and ADI, and Jacobian and ADI craniocaudal and posteroanterior gradients. Mean Jacobian was higher in the caudal and posterior portions of the lungs in clusters 1 and 2, but this normal variation (23,26) was diminished in clusters 4 and 5. Expansion was also more anisotropic in the caudal and anterior portions of the lungs in clusters 1 and 2, with diminished spatial variation in clusters 4 and 5. These observations were seen in both cohorts, although we found no difference in the craniocaudal ADI gradient in SARP III (P = .06). Taken together, these changes indicate a diminished capacity for the lungs to expand due to hyperinflation on full expiration. Pairwise comparisons generally revealed more isotropic expansion of smaller magnitude in clusters 4 and 5 (Fig E3 [online]). Table E3 (online) shows correlation coefficients for gradient-based assessments of lung expansion with whole-lung measurements of lung expansion and air trapping. The gradients of change in Jacobian and ADI measurements in the craniocaudal and posteroanterior dimensions are only weakly correlated with whole-lung ADI and Jacobian (range of Pearson correlations: –0.34 to 0.16 for craniocaudal gradients and –0.46 to 0.71 for posteroanterior gradients). This suggests that while both whole-lung and gradient-based assessments of lung expansion independently differ by cluster, the spatial variation of lung expansion measurements—particularly in the craniocaudal axis—may synergize with whole-lung expansion measurements when characterizing lung pathophysiology.
Table 4:
Quantitative CT Measurements of Lung Expansion Show That the Magnitude and Variability of Expansion Decrease as Asthma Severity Increases
Variability in qCT Measurements according to Clinical Asthma Clusters
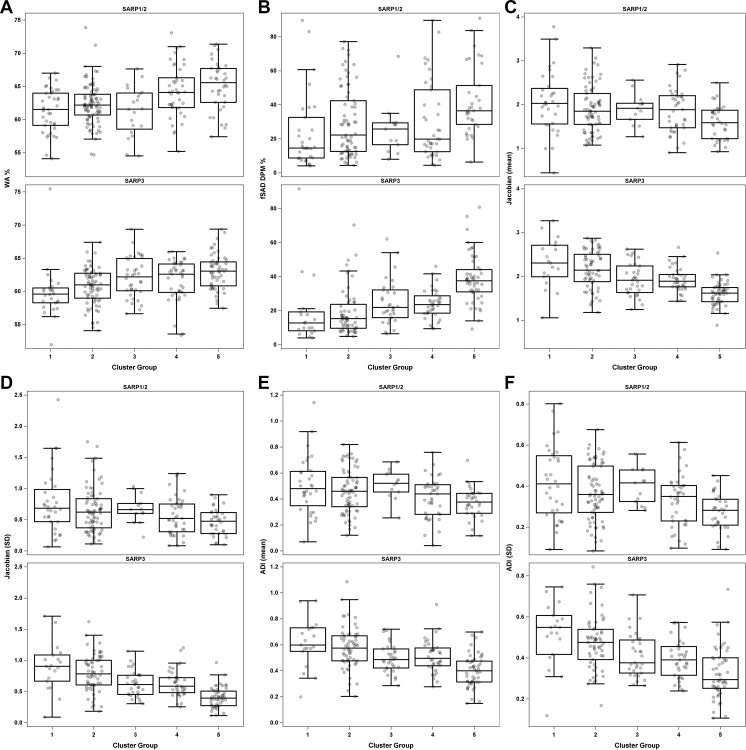
Figure 4 highlights the variability of qCT measurements among all five clinical clusters with use of select qCT measurements. In general, the newer scanners used in SARP III yielded fewer variable results than the older scanners used in SARP I/II. In particular, Jacobian and ADI measurements (Fig 4C–4F) showed a linear decrease from clusters 1 to 5.
Figure 4:
Box plots of means and SDs for key quantitative CT (qCT) measurements between clusters in Severe Asthma Research Program (SARP) I and II and SARP III, including (A) wall area (WA) percentage, (B) functional small airway disease (fSAD) on disease probability maps (DPM), (C) mean Jacobian, (D) SD of Jacobian, (E) mean anisotropic deformation index (ADI), and (F) SD of ADI.
Discussion
We evaluated 455 participants with cluster assignments and CT imaging and found that airway morphometry and air trapping could only help identify severe phenotypes, while assessments of the magnitude, direction, and variability of lung expansion differed more substantially between clusters. For example, air trapping, measured with disease probability mapping of functional small airway disease, was only clearly highest in participants with severe fixed asthma (Severe Asthma Research Program [SARP] III cluster 1: 19.0% ± 20.6; cluster 2: 18.9% ± 13.3; cluster 3: 24.9% ± 13.1; cluster 4: 24.1% ± 8.4; cluster 5: 38.8% ± 14.4; P < .001). On the other hand, whole-lung Jacobian and anisotropic deformation index [ADI] values decreased as cluster severity increased. Similarly, within-lung Jacobian and ADI SDs decreased as cluster severity increased (SARP III Jacobian SD cluster 1: 0.90 ± 0.4; cluster 2: 0.79 ± 0.3; cluster 3: 0.62 ± 0.2; cluster 4: 0.63 ± 0.2; cluster 5: 0.41 ± 0.2; P < .001). Whole-lung and spatial assessments of the magnitude and isotropy of lung expansion are promising quantitative CT biomarkers that can augment future phenotypic studies in asthma.
The precise and global nature of qCT is well suited to augment mechanistic studies in asthma by providing structural and functional information that is broadly applicable across phenotypes, unlike traditional biomarkers. qCT assessments, if implemented alongside clinical and biologic evaluations of patients with asthma, may help unravel the pathobiologic mechanisms that underpin asthma phenotypes. For example, current biomarkers that guide asthma treatment are primarily focused on eosinophilic or atopic inflammation (8) and may not apply to more than half of patients with severe asthma (9) (eg, severe paucigranulocytic asthma [29]). Because qCT parameters are structural or functional and not tethered to inflammation, they may be more broadly applied as novel markers of therapeutic response, such as for bronchial thermoplasty (30). qCT can potentially supplement traditional asthma biomarkers or be studied in subphenotypes where biomarkers remain unknown.
Older assessments of airway morphometry and air trapping could not consistently distinguish between asthma phenotypes. Early qCT studies found that airway wall thickness (31) correlated with airway wall remodeling (11). We found that cluster 5 participants, with severe asthma and fixed airflow obstruction, had thicker airway walls and smaller airways. However, airway morphometry was unable to consistently help distinguish between other clusters, especially clusters 2–4. Our findings echo those of prior work from SARP where qCT depicted thicker airway walls in severe refractory asthma but not in non-severe asthma, when compared with healthy controls (32). Similarly, qCT air trapping measurements were higher in cluster 5 but not different in other clusters. Others have shown that the amount of lung with fSAD may be similar in asthma compared with healthy controls (26). Furthermore, SARP investigators showed that, on average, 35% of healthy lungs have air trapping when attenuation thresholds are used to define disease (–856 HU at expiration), and air trapping percentage was higher in severe asthma (62%) but not non-severe asthma (41%), when compared with healthy controls (12). Our work confirms that qCT assessments of airway morphometry and air trapping lack precision to discern cluster phenotypes.
We found that measurements of voxel-wise lung expansion (Jacobian and ADI) consistently differed between clusters. Lung expansion was diminished in clusters with severe asthma (clusters 4 and 5), confirming prior reports (13,23,33). Additionally, the variability of expansion, measured with the SD of the Jacobian population, diminished as asthma severity worsened, indicating a loss of normal spatial heterogeneity (34). This finding has not been previously well established in the literature. Similar to other reports, mean Jacobian was greatest in the posterior and caudal portions of lung (13,23), but anterior lung expansion was more anisotropic. The normal spatial variability of lung expansion diminished with greater asthma severity. Furthermore, gradient-based Jacobian and ADI measurements added novel information to whole-lung measurements. Similarly, others have found that gradient-based, but not global, assessments of air trapping are associated with higher airway resistance and more asthma symptoms (26). Taken together, severe asthma clusters (clusters 4 and 5) had diminished isotropic lung expansion with less spatial heterogeneity of expansion than in mild clusters (1,2). Lung expansion parameters also differed between less severe clusters, indicating that unlike airway morphometry and air trapping, these parameters may be useful in non-severe asthma.
Our study has limitations. First, qCT assessments require manually coached inspiratory and expiratory scans to achieve target lung volumes, and qCT requires specialized analyses (21). Second, only a subset of SARP participants underwent qCT, though they were similar to those who did not. Third, the SARP III clustering algorithm differed slightly from that used in SARP I and II (detailed in Appendix E2 [online]) (4). Specifically, SARP III cluster 3 had more severe features, and cluster 4 had less severe features. Fourth, a priori pairwise analyses did not include cluster 3, given the small cluster size (4). Fifth, our results may not apply to patients with concomitant chronic obstructive pulmonary disease. Sixth, our study was cross-sectional, and longitudinal cluster reproducibility is unknown.
In summary, we found that quantitative CT (qCT) assessments of airway morphometry and air trapping could only identify severe asthma, while global and spatial assessments of lung expansion differed across a range of asthma phenotypes. qCT lung expansion can augment traditional asthma characterization and provide a tool to characterize asthma phenotypes that are not identified with traditional characterization. Future studies should include qCT when phenotyping asthma and examine whether combining clinical expertise with radiologist-led qCT assessments of lung expansion can improve therapeutic guidance for patients with severe asthma who do not qualify for biologic therapy.
Members of the NHLBI Severe Asthma Research Program (SARP) are listed in Appendix E1 (online).
Supported by the National Heart, Lung, and Blood Institute (NHLBI) (U10 HL109257). A.S. supported by the National Institutes of Health (NIH)/National Institute of Allergy and Infectious Diseases (K23 AI117024). J.G.K. supported by NIH (KL2TR002346).
Disclosures of Conflicts of Interest: A.P.T. Supported by Severe Asthma Research Program. C.H. Speaker payment or honoraria from VIDA Diagnostics. C.W.G. No relevant relationships. D.L. No relevant relationships. J.G.K. Previous grant to institution from NIH (2T32HL007317); consulting fees from Genentech. M.C.M. No relevant relationships. M.S. No relevant relationships. J.P.S. Stock options in VIDA Diagnostics that provides QCT analysis; employee of VIDA Diagnostics at the time of the QCT analysis. H.L. No relevant relationships. K.B.S. No relevant relationships. J.S. Stock and options held in VIDA Diagnostics; employee of VIDA Diagnostics. S.M. No relevant relationships. S.P. Stock options in VIDA; employee of VIDA. W.C.M. Grant to institution by NHLBI. E.R.B. Clinical trials administered through University of Arizona for AstraZeneca, Novartis, Regeneron, Sanofi, Genzyme; consulting fees from ALK-Abello, AstraZeneca, GlaxoSmithKline, Knopp Pharmaceuticals, Novartis, Regeneron, Sanofi, Genzyme; payment or honoraria from ALK-Abello, AstraZeneca, GlaxoSmithKline; financial support for the NHLBI SARP study activities at the Coordinating and Clinical Centers: AstraZeneca, Boehringer Ingelheim, Genentech, Sanofi-Genzyme-Regeneron, and TEVA; other financial or non-financial interests in NHLBI SARP. D.A.M. Supported for study activities at the Coordinating and Clinical Centers beyond the 3rd year of patient follow-up: AstraZeneca, Boehringer Ingelheim, Genentech, GlaxoSmithKline, Sanofi–Genzyme–Regeneron, and TEVA. E.I. Grant to institution by NHLBI. G.R.W. Payments made to institution from NIH, Boehringer Ingelheim, BTG, Interventional Medicine, Janssen Pharmaceuticals; consulting fees from PulmonX, Novartis, Janssen, Philips, Vertex; travel support through round trip plane ticket from Boston to Chicago from Philips; participation on a DataSafety Monitoring Board or Advisory Board from PulmonX; co-founder and equity share holder of Quantitative Imaging Solutions – a data analytics company. B.D.L. Supported by NHLBI and payments to institution for study activities at the Coordinating and Clinical Centers beyond the third year of patient follow-up: AstraZeneca, Boehringer Ingelheim, Genentech, GlaxoSmithKline, Sanofi–Genzyme–Regeneron, and TEVA; consulting fees from Gossamer Bio, Novartis, Pieris Pharmaceuticals. J.K.L. NIH funding to the University of Pittsburgh. S.E.W. Unrestricted funds to NHLBI, TEVA, and Boehringer Ingelheim to the University of Pittsburgh for support of Severe Asthma Research Program 3; multicenter clinical trials on anti-IL5R and anti-TSLP for AstraZeneca; multicenter clinical trial on Anti-IL33 for GSK; multicenter clinical trial on CRTH2 antagonist; multicenter clinical trial on anti-Eosinophil drug; consulting fees for anti-TSLP from AstraZeneca, for anti-IL-5 from GSK, for anti-TSLP from Novartis, for anti-IL-4R from Sanofi; participation on a DataSafety Monitoring Board or Advisory Board for University of Pittsburgh. J.V.F. Research grants from NHLBI/NIH paid to University of California, San Francisco; research grants paid to UCSF from the Severe Asthma Research program (SARP) Data Center using funds provided to SARP by Teva and Boehringer Ingelheim to support research in SARP; consulting fees from Sound Biologics for early stage drug development for asthma; inventor of WO2014153009A2 - Thiosaccharide mucolytic agents and WO2017197360 - "CT Mucus Score" - A new scoring system that quantifies airway mucus impaction using CT lung scans. Inventor - describes a mucus plug score on CT lung images; founder and board chairman for Aer Therapeutics; stock options in Connect Biopharma. M.L.S. Supported by NHLBI – SARP III and SARP IV; patents in CT mucus scoring; leadership or fiduciary role in Fleischner Society; shareholder in Stemina Biomarker Discovery, X-Vax, Healthmyne, Elucida Oncology, Elucent Medical; member of Radiology editorial board. S.B.F. Institution by NIH/NHLBI SARP 3, NIH/ORIP Pulmonary Ry Imaging Center S10; grants or contracts through institution/department form GE Healthcare; consulting fees from Polarean and Sanofi/Regeneron; payment or honoraria from Sanofi/Regeneron; receipt of services through institution from GE Healthcare. N.N.J. Grants or contracts from NIH funding; consulting fees from GSK, Pulmocide, and AstraZeneca. D.T.M. Supported for study activities at the Coordinating and Clinical Centers beyond the third year of patient follow-up: AstraZeneca, Boehringer Ingelheim, Genentech, GlaxoSmithKline, Sanofi–Genzyme–Regeneron, and TEVA; grant support to institution by NIH; consulting fees from Cohero Health; payments for participation on a DataSafety Monitoring Board or Advisory Board for NIH, Cystic Fibrosis Foundation, Biocryst, and Insmed. J.M.R. NIH grants and a grant from the Roy J. Carver Charitable Trust; royalties or licenses from VIDA Diagnostics; consulting fees from Desmarais; payment for expert testimony from Desmarais; U.S. Patent application 16/914,972 filed on June 27, 2019, and U.S. Patent application 62/846,394 filed on May 10, 2019; stock or stock options in VIDA Diagnostics. J.D.N. NIH grant support to the University of Iowa; grants or contracts from NIH (payments made to institution), VIDA (payments made to author), and Elsevier Publishers (future payments made to author); royalties or licenses from Elsevier Publishers; consulting fees from VIDA; payment or honoraria from VIDA and Elsevier Publishers; travel payments from VIDA; patents with VIDA and University of Iowa; participation with VIDA on multiple pharmaceutical trials; stock options in VIDA. E.A.H. NIH funding for lab to the radiology center for the multicenter study SARP; meeting attendance funded by NIH grant; founder and shareholder of VIDA Diagnostics; participation on the Siemens Photon Counting CT advisory committee. M.C. Payment to institution through the NIH/NHLBI Severe Asthma Research Program Grant; grants or contracts to institution from ALA, PCORI, AstraZeneca, GSK, Novartis, Pulmatrix, Sanofi-Aventis, Shionogi; royalties from Elsevier; consulting fees from Genentech, Teva, Sanofi-Aventis, Novartis; payment or honoraria from AstraZeneca, Genentech, GSK, Regeneron, Sanofi, and Teva; participation on a DataSafety Monitoring Board or Advisory Board for Pulmatrix, Gossamer Bio, ALA, AstraZeneca, Genentech, Chiesi. A.S. No relevant relationships.
Abbreviations:
- ADI
- anisotropic deformation index
- DPM
- disease probability map
- FEV1
- forced expiratory volume in 1 second
- FRC
- functional residual capacity
- fSAD
- functional small airway disease
- Pi10
- square root of bronchial wall area for a theoretical airway with an internal perimeter of 10 mm
- qCT
- quantitative CT
- SARP
- Severe Asthma Research Program
- TLC
- total lung capacity
Contributor Information
Mario Castro, Email: mcastro2@kumc.edu.
Collaborators: Elliot Israel, Bruce Levy, Manuela Cernadas, George R. Washko, Kathleen Haley, Juan C. Cardet, Melody Duvall, Victoria Forth, Meghan Le, Eva Fandozzi, Allison O'Neill, Katarina Gentile, Maria Cinelli, Abigail Tulchinsky, Guilberto Lawrance, Randall Czajkowski, Peter Lemole, William Antunes, Ann McGinnis, Kris Klokeid, Wanda Phipatanakul, William Sheehan, Lisa Bartnikas, Sachin Baxi, Elena Crestani, Brittany Etsy, Jonathan Gaffin, Marissa Hauptman, David Kantor, Peggy Lai, Margee Louisias, Kyle Nelson, Perdita Permaul, Lynda Schneider, Lakiea Wright, Samantha Minnicozzi, Michelle Maciag, Mehtap Haktanir-Abul, Sigfus Gunnlaugsson, Elizabeth Burke-Roberts, Amparito Cunningham, Ethan Ansel-Kelly, Sullivan Waskosky, Anna Ramsey, Laura Feloney, Sally Wenzel, Merritt Fajt, Juan Celedon, Allyson Larkin, Peter Di, Hong Wei Chu, Marc Gauthier, Wei Wu, Supriya Jain, Matthew Camiolo, Christine Rauscher, Faith Luyster, Paul Rebovich, Jessa Demas, Renee Wunderley, Catherine Vitari, Melissa Ilnicki, Diane Srollo, Crystal Takosky, Rose Lanzo, Joseph Leader, Daniel M. Lapic, Emily Etling, Donna Rhodes, Jeananne Burger, Erin Glover, Albert Peters, Carl Smith, Nicholas Bonfiglio, John Trudeau, Seo-Jin Bang, Qiao Lin, Chia-Hsin Liu, Saran Kupul, Nizar Jarjour, Loren Denlinger, Robert Lemanske, Sean Fain, Ravi Viswanathan, Mark Moss, Dan Jackson, Ronald Sorkness, Sima Ramratnam, Matthew Tattersall, Gina Crisafi, Danika Klaus, Lori Wollet, Julia Bach, Mats Johansson, Mark Schiebler, Stephane Esnault, Sameer Mathur, Jan Yakey, Heather Floerke, Arturo Guadarrama, Andrew Maddox, Brooke Peters, Katelin Beaman, Kaharu Sumino, Mario Castro, Leonard Bacharier, David Gierada, Jason Woods, Kenneth Schechtman, Brenda Patterson, Ajay Sheshadri, Andrea Coverstone, Adrian Shifren, James Quirk, Derek Byers, James Krings, Mary Clare McGregor, Maanasi Samant, Jaime Tarsi, Tammy Koch, Vanessa Curtis, Huiqing Yin-Declue, Jonathan Boomer, Melissa Saylor, Shirley Frei, Licia Rowe, Geneline Sajol, Jim Kozlowski, Eric Hoffman, Elizabeth Allard, Jarron Atha, Lin Ching-Long, John Fahy, Prescott Woodruff, Ngoc Ly, Nirav Bhakta, Michael Peters, Courtney Moreno, Ariana Baum, Donna Liu, Anjali Kalra, Xavier Orain, Annabelle Charbit, Ndidi Njoku, Eleanor Dunican, William Gerald Teague, Roby Greenwald, Mark DeBoer, Kristin Wavell, Kimberly deRonde, Serpil Erzurum, John Carl, Sumita Khatri, Raed Dweik, Suzy Comhair, Jackie Sharp, Jason Lempel, Samar Farha, Rachel Taliercio, Mark Aronica, Joe Zein, Michelle Koo, Tracy A. Painter, Kim Hopkins, Joy Lawrence, Simon Abi-Saleh, Monica Labadia, Elion Qirjaz, Ron Wehrmann, Debera Arbruster, Teresa Markle, Brittany Matuska, Sara Baicker-McKee, Patrick Wyszynski, Kelly Fitzgerald, Kristie Ross, Benjamin Gaston, Ross Myers, Daniel Craven, Erica Roesch, Ryan Thomas, Laurie Logan, Laura Veri, Adam Gluvna, Julie Wallace, Margaret Pryor, Sara Smith, Patricia Allerton, Traci Emrich, Jay Hilliard, Jeanne Krenicky, Laura Smith, Matthew Ferrebee, Wendy Moore, Eugene Bleecker, Deborah Meyers, Stephen Peters, Xingnan Li, Annette Hastie, Victor Ortega, Greg Hawkins, Jeff Krings, Elizabeth Ampleford, Anna Pippins, Paige Field, Brian Rector, Ryan Sprissler, Barbara Fransway, Anne Fitzpatrick, Susan Stephenson, David T. Mauger, and Brenda Phillips
References
- 1. Nurmagambetov T , Kuwahara R , Garbe P . The Economic Burden of Asthma in the United States, 2008-2013 . Ann Am Thorac Soc 2018. ; 15 ( 3 ): 348– 356 . [DOI] [PubMed] [Google Scholar]
- 2. Hekking PW , Wener RR , Amelink M , Zwinderman AH , Bouvy ML , Bel EH . The prevalence of severe refractory asthma . J Allergy Clin Immunol 2015. ; 135 ( 4 ): 896– 902 . [DOI] [PubMed] [Google Scholar]
- 3. Ivanova JI , Bergman R , Birnbaum HG , Colice GL , Silverman RA , McLaurin K . Effect of asthma exacerbations on health care costs among asthmatic patients with moderate and severe persistent asthma . J Allergy Clin Immunol 2012. ; 129 ( 5 ): 1229– 1235 . [DOI] [PubMed] [Google Scholar]
- 4. Moore WC , Meyers DA , Wenzel SE , et al . Identification of asthma phenotypes using cluster analysis in the Severe Asthma Research Program . Am J Respir Crit Care Med 2010. ; 181 ( 4 ): 315– 323 . [DOI] [PMC free article] [PubMed] [Google Scholar]
- 5. Moore WC , Hastie AT , Li X , et al . Sputum neutrophil counts are associated with more severe asthma phenotypes using cluster analysis . J Allergy Clin Immunol 2014. ; 133 ( 6 ): 1557– 63.e5 . [DOI] [PMC free article] [PubMed] [Google Scholar]
- 6. Haldar P , Pavord ID , Shaw DE , et al . Cluster analysis and clinical asthma phenotypes . Am J Respir Crit Care Med 2008. ; 178 ( 3 ): 218– 224 . [DOI] [PMC free article] [PubMed] [Google Scholar]
- 7. Sendín-Hernández MP , Ávila-Zarza C , Sanz C , et al . Cluster Analysis Identifies 3 Phenotypes within Allergic Asthma . J Allergy Clin Immunol Pract 2018. ; 6 ( 3 ): 955– 961.e1 . [DOI] [PubMed] [Google Scholar]
- 8. McGregor MC , Krings JG , Nair P , Castro M . Role of Biologics in Asthma . Am J Respir Crit Care Med 2019. ; 199 ( 4 ): 433– 445 . [DOI] [PMC free article] [PubMed] [Google Scholar]
- 9. Albers FC , Müllerová H , Gunsoy NB , et al . Biologic treatment eligibility for real-world patients with severe asthma: The IDEAL study . J Asthma 2018. ; 55 ( 2 ): 152– 160 . [DOI] [PubMed] [Google Scholar]
- 10. Trivedi A , Hall C , Hoffman EA , Woods JC , Gierada DS , Castro M . Using imaging as a biomarker for asthma . J Allergy Clin Immunol 2017. ; 139 ( 1 ): 1– 10 . [DOI] [PMC free article] [PubMed] [Google Scholar]
- 11. Aysola RS , Hoffman EA , Gierada D , et al . Airway remodeling measured by multidetector CT is increased in severe asthma and correlates with pathology . Chest 2008. ; 134 ( 6 ): 1183– 1191 . [DOI] [PMC free article] [PubMed] [Google Scholar]
- 12. Busacker A , Newell JD Jr , Keefe T , et al . A multivariate analysis of risk factors for the air-trapping asthmatic phenotype as measured by quantitative CT analysis . Chest 2009. ; 135 ( 1 ): 48– 56 . [DOI] [PMC free article] [PubMed] [Google Scholar]
- 13. Choi S , Hoffman EA , Wenzel SE , et al . Quantitative assessment of multiscale structural and functional alterations in asthmatic populations . J Appl Physiol (1985) 2015. ; 118 ( 10 ): 1286– 1298 . [DOI] [PMC free article] [PubMed] [Google Scholar]
- 14. Miller MK , Johnson C , Miller DP , et al . Severity assessment in asthma: An evolving concept . J Allergy Clin Immunol 2005. ; 116 ( 5 ): 990– 995 . [DOI] [PubMed] [Google Scholar]
- 15. Jarjour NN , Erzurum SC , Bleecker ER , et al . Severe asthma: lessons learned from the National Heart, Lung, and Blood Institute Severe Asthma Research Program . Am J Respir Crit Care Med 2012. ; 185 ( 4 ): 356– 362 . [DOI] [PMC free article] [PubMed] [Google Scholar]
- 16. Moore WC , Bleecker ER , Curran-Everett D , et al . Characterization of the severe asthma phenotype by the National Heart, Lung, and Blood Institute’s Severe Asthma Research Program . J Allergy Clin Immunol 2007. ; 119 ( 2 ): 405– 413 . [DOI] [PMC free article] [PubMed] [Google Scholar]
- 17. Teague WG , Phillips BR , Fahy JV , et al . Baseline Features of the Severe Asthma Research Program (SARP III) Cohort: Differences with Age . J Allergy Clin Immunol Pract 2018. ; 6 ( 2 ): 545– 554 . e4 . [DOI] [PMC free article] [PubMed] [Google Scholar]
- 18. Carlstrom L , Moore WC , Hoffman EA , et al . Asthma phenotypes using cluster analysis and MDCT chest In the Severe Asthma Research Program (SARP) . Am J Respir Crit Care Med 2010. ; 181: A5027. [DOI] [PMC free article] [PubMed] [Google Scholar]
- 19. Sheshadri A , Jiao J , Carlstrom L , et al . MDCT characteristics of pre-specified asthmatic cluster phenotypes in the Severe Asthma Research Program . Am J Respir Crit Care Med 2015. ; 191: A2490. https://www.atsjournals.org/doi/abs/10.1164/ajrccm-conference.2015.191.1_MeetingAbstracts.A2490 . [Google Scholar]
- 20. Trivedi AP , Hall C , Sood S , et al . The use of CT to characterize cluster phenotypes in the Severe Asthma Research Program . Am J Respir Crit Care Med 2017. ; 195: A5153. https://www.atsjournals.org/doi/abs/10.1164/ajrccm-conference.2017.195.1_MeetingAbstracts.A5153 . [Google Scholar]
- 21. Sieren JP , Newell JD Jr , Barr RG , et al . SPIROMICS Protocol for Multicenter Quantitative Computed Tomography to Phenotype the Lungs . Am J Respir Crit Care Med 2016. ; 194 ( 7 ): 794– 806 . [DOI] [PMC free article] [PubMed] [Google Scholar]
- 22. Tschirren J , Hoffman EA , McLennan G , Sonka M . Segmentation and quantitative analysis of intrathoracic airway trees from computed tomography images . Proc Am Thorac Soc 2005. ; 2 ( 6 ): 484– 487 , 503–504. [DOI] [PMC free article] [PubMed] [Google Scholar]
- 23. Choi S , Hoffman EA , Wenzel SE , et al . Registration-based assessment of regional lung function via volumetric CT images of normal subjects vs. severe asthmatics . J Appl Physiol (1985) 2013. ; 115 ( 5 ): 730– 742 . [DOI] [PMC free article] [PubMed] [Google Scholar]
- 24. Lynch DA , Moore CM , Wilson C , et al . CT-based Visual Classification of Emphysema: Association with Mortality in the COPDGene Study . Radiology 2018. ; 288 ( 3 ): 859– 866 . [DOI] [PMC free article] [PubMed] [Google Scholar]
- 25. Amelon R , Cao K , Ding K , Christensen GE , Reinhardt JM , Raghavan ML . Three-dimensional characterization of regional lung deformation . J Biomech 2011. ; 44 ( 13 ): 2489– 2495 . [DOI] [PMC free article] [PubMed] [Google Scholar]
- 26. Bell AJ , Foy BH , Richardson M , et al . Functional CT imaging for identification of the spatial determinants of small-airways disease in adults with asthma . J Allergy Clin Immunol 2019. ; 144 ( 1 ): 83– 93 . [DOI] [PubMed] [Google Scholar]
- 27. Kirby M , Yin Y , Tschirren J , et al . A Novel Method of Estimating Small Airway Disease Using Inspiratory-to-Expiratory Computed Tomography . Respiration 2017. ; 94 ( 4 ): 336– 345 . [DOI] [PubMed] [Google Scholar]
- 28. Hoff BA , Pompe E , Galbán S , et al . CT-Based Local Distribution Metric Improves Characterization of COPD . Sci Rep 2017. ; 7 ( 1 ): 2999. [DOI] [PMC free article] [PubMed] [Google Scholar]
- 29. Tliba O , Panettieri RA Jr . Paucigranulocytic asthma: Uncoupling of airway obstruction from inflammation . J Allergy Clin Immunol 2019. ; 143 ( 4 ): 1287– 1294 . [DOI] [PMC free article] [PubMed] [Google Scholar]
- 30. Hall CS , Quirk JD , Goss CW , et al . Single-Session Bronchial Thermoplasty Guided by 129Xe Magnetic Resonance Imaging. A Pilot Randomized Controlled Clinical Trial . Am J Respir Crit Care Med 2020. ; 202 ( 4 ): 524– 534 . [DOI] [PMC free article] [PubMed] [Google Scholar]
- 31. Arakawa H , Webb WR . Air trapping on expiratory high-resolution CT scans in the absence of inspiratory scan abnormalities: correlation with pulmonary function tests and differential diagnosis . AJR Am J Roentgenol 1998. ; 170 ( 5 ): 1349– 1353 . [DOI] [PubMed] [Google Scholar]
- 32. Witt CA , Sheshadri A , Carlstrom L , et al . Longitudinal changes in airway remodeling and air trapping in severe asthma . Acad Radiol 2014. ; 21 ( 8 ): 986– 993 . [DOI] [PMC free article] [PubMed] [Google Scholar]
- 33. Choi S , Hoffman EA , Wenzel SE , et al . Quantitative computed tomographic imaging-based clustering differentiates asthmatic subgroups with distinctive clinical phenotypes . J Allergy Clin Immunol 2017. ; 140 ( 3 ): 690– 700.e8 . [DOI] [PMC free article] [PubMed] [Google Scholar]
- 34. Hopkins SR , Henderson AC , Levin DL , et al . Vertical gradients in regional lung density and perfusion in the supine human lung: the Slinky effect . J Appl Physiol (1985) 2007. ; 103 ( 1 ): 240– 248 . [DOI] [PMC free article] [PubMed] [Google Scholar]


