Abstract
Background
Extremely preterm (EP) birth is associated with higher risks of perinatal white matter (WM) injury, potentially causing abnormal neurologic and neurocognitive outcomes. MRI biomarkers distinguishing individuals with and without neurologic disorder guide research on EP birth antecedents, clinical correlates, and prognoses.
Purpose
To compare multiparametric quantitative MRI (qMRI) parameters of EP-born adolescents with autism spectrum disorder, cerebral palsy, epilepsy, or cognitive impairment (ie, atypically developing) with those without (ie, neurotypically developing), characterizing sex-stratified brain development.
Materials and Methods
This prospective multicenter study included individuals aged 14–16 years born EP (Extremely Low Gestational Age Newborns–Environmental Influences on Child Health Outcomes Study, or ELGAN-ECHO). Participants underwent 3.0-T MRI evaluation from 2017 to 2019. qMRI outcomes were compared for atypically versus neurotypically developing adolescents and for girls versus boys. Sex-stratified multiple regression models were used to examine associations between spatial entropy density (SEd) and T1, T2, and cerebrospinal fluid (CSF)–normalized proton density (nPD), and between CSF volume and T2. Interaction terms modeled differences in slopes between atypically versus neurotypically developing adolescents.
Results
A total of 368 adolescents were classified as 116 atypically (66 boys) and 252 neurotypically developing (125 boys) participants. Atypically versus neurotypically developing girls had lower nPD (mean, 557 10 × percent unit [pu] ± 46 [SD] vs 573 10 × pu ± 43; P = .04), while atypically versus neurotypically developing boys had longer T1 (814 msec ± 57 vs 789 msec ± 82; P = .01). Atypically developing girls versus boys had lower nPD and shorter T2 (eg, in WM, 557 10 × pu ± 46 vs 580 10 × pu ± 39 for nPD [P = .006] and 86 msec ± 3 vs 88 msec ± 4 for T2 [P = .003]). Atypically versus neurotypically developing boys had a more moderate negative association between T1 and SEd (slope, –32.0 msec per kB/cm3 [95% CI: –49.8, –14.2] vs –62.3 msec per kB/cm3 [95% CI: –79.7, –45.0]; P = .03).
Conclusion
Atypically developing participants showed sexual dimorphisms in the cerebrospinal fluid–normalized proton density (nPD) and T2 of both white matter (WM) and gray matter. Atypically versus neurotypically developing girls had lower WM nPD, while atypically versus neurotypically developing boys had longer WM T1 and more moderate T1 associations with microstructural organization in WM.
© RSNA, 2022
Summary
For 368 adolescents born extremely preterm, multiparametric quantitative MRI measures of proton density, T1, and T2 and their associations with microstructure helped identify potential biologic markers of atypical brain development.
Key Results
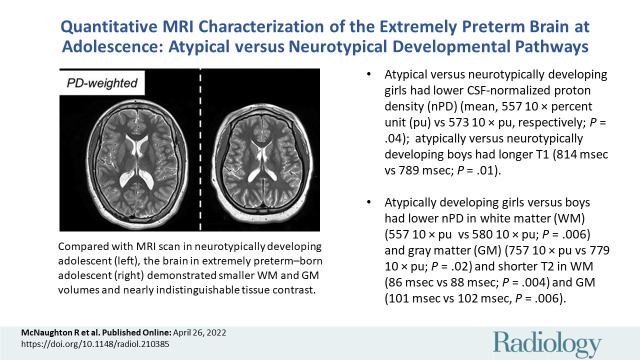
■ Atypically versus neurotypically developing girls had lower cerebrospinal fluid–normalized proton density (nPD) in white matter (WM) (mean, 557 10 × percent unit [pu] vs 573 10 × pu, respectively; P = .04); atypically versus neurotypically developing boys had longer T1 (814 msec vs 789 msec; P = .01) in WM.
■ Atypically developing girls versus boys had lower nPD in WM (557 10 × pu vs 580 10 × pu; P = .006) and gray matter (GM) (757 10 × pu vs 779 10 × pu; P = .02) and shorter T2 in WM (86 msec vs 88 msec; P = .003) and GM (101 msec vs 102 msec; P = .02).
Introduction
Survival rates for children born very preterm (gestational age, 28–32 weeks) and extremely preterm (EP) (gestational age, <28 weeks) have considerably increased due to advances in neonatal care (1). Nonetheless, a high incidence of neurologic disability affects EP survivors; seizures are noted in 12% (2), cerebral palsy in 5%–10%, other motor disturbances in 25%–40%, and cognitive, attentional, behavioral, and socialization disturbances in 25%–50% (3). Among these individuals, perinatal injury may alter development in white matter (WM) and gray matter (GM) and may disrupt myelination, leading to dysmaturation (3,4). Quantitative MRI (qMRI) neuroimaging generates rich information about the brain without the use of ionizing radiation and can serve as a potential biologic marker for these neurodevelopmental events in the study of neuroprotective and neurorestorative interventions (3).
The most studied qMRI parameters are measures of water mobility at diffusion MRI (5,6). Diffusion MRI studies identified WM microstructural differences between preterm and term-born cohorts through childhood (7,8), adolescence (9,10), and adulthood (11). Similar studies also identified sex-related WM microstructural differences at adolescence (12,13), although these differences are still poorly understood (14). These differences were detected in the absence of gross WM abnormalities, demonstrating the usefulness of MRI for uncovering subtle, subvoxel abnormalities (15). The spectrum of qMRI parameters also comprises measures of water content (16), macromolecular content reflected in the relaxation times (T1 and T2), and mobile-immobile water exchange, adding potentially valuable information about atypical brain development (17–21).
We hypothesized that multiparametric qMRI could reveal underlying brain tissue patterns and relationships that could further characterize the biologic features of tissue related to abnormal neurologic outcomes, specifically, relationships between tissue quantity (volumetry), tissue quality (water content, relaxometry), and tissue microstructure with use of spatial entropy mapping. We compared the multiparametric qMRI parameter distributions in four subgroups of adolescents born EP, distinguished by sex and the presence of neurologic disorders, specifically autism spectrum disorder, cerebral palsy, epilepsy, or full-scale intelligence quotient less than 85.
The purpose of this research was to study multiparametric qMRI measures of water content, relaxometry, microstructural organization, and tissue volumes as potential biologic markers of development, characterizing atypically and neurotypically developing states for brains of girls and boys born EP, defined by an integrated, semiautomated image processing pipeline (IPP).
Materials and Methods
Participants and Ethics
Enrollment in this prospective study was approved by the institutional review boards of all 12 participating institutions of the Extremely Low Gestational Age Newborns–Environmental Influences on Child Health Outcomes, or ELGAN-ECHO, Study (http://www.elganstudy.org). The study was Health Insurance Portability and Accountability Act–compliant, with obtained parental consent and participants’ assent.
From 2002 to 2004, 1249 mothers of 1506 infants born EP consented to participate in the ELGAN-ECHO Study (22). At age 15, 700 of 1198 (58%) surviving adolescents re-enrolled for additional follow-up, of whom 465 (66%) assented to undergo brain MRI. A total of 42 of 700 (6%) participants were previously studied to assess kidney disease risk factors (23). The analyses herein are independent of this prior report and others at earlier ages (http://www.elganstudy.org/publications).
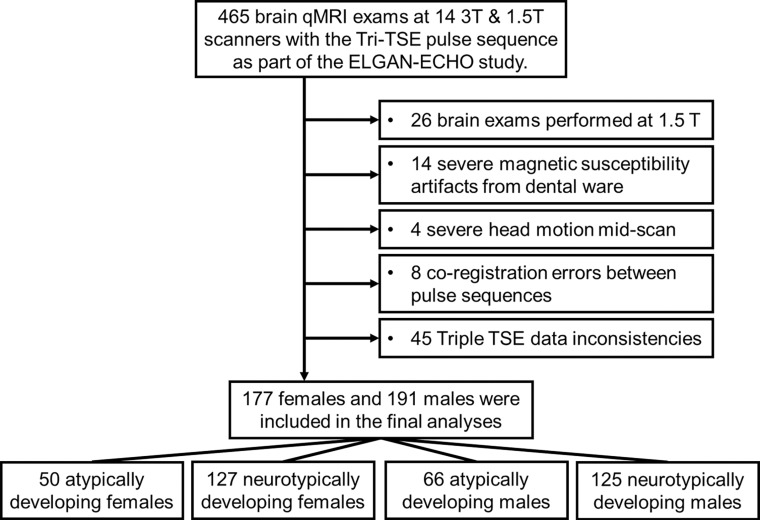
Cognitive evaluations were administered by certified child psychologists. Diagnosis of autism spectrum disorder (24), cerebral palsy (25), and epilepsy (2) was conducted by evaluators who were unaware of participants’ medical histories besides EP birth. Twenty-six participants were excluded because the MRI examinations were performed at 1.5-T field strength. Four participants were excluded due to severe motion artifacts. Fourteen participants were excluded for dental ware–induced magnetic susceptibility artifacts. Eight participants were excluded because of coregistration errors between concatenated qMRI acquisitions. Finally, 45 participants were excluded for incompatible voxel size and minor imaging protocol deviations (Fig 1). Participants were separated into atypically and neurotypically developing groups based on the presence of autism spectrum disorder, cerebral palsy, epilepsy, or full-scale intelligence quotient below 85.
Figure 1:
Flowchart of participant selection from each of the 12 participating institutions. ELGAN-ECHO = Extremely Low Gestational Age Newborns–Environmental Influences on Child Health Outcomes, qMRI = quantitative MRI, TSE = turbo spin echo.
Image Acquisition
The ELGAN-ECHO MRI protocol included two concatenated scans implemented with identical geometry and receiver settings, namely a dual-echo turbo spin-echo (TSE) and a single-echo TSE, referred together as a triple TSE (fast spin-echo [FSE]) (Figs 2, E1 [online]: triple FSE for GE and triple TSE for Philips and Siemens). It is a triple-weighting acquisition: directly acquired image (ie, DA) 1 = proton density–weighted, DA2 = T2-weighted, and DA3 = T1-weighted. Typical imaging parameters (Siemens) were as follows: voxel = 0.5 × 0.5 × 2 mm; first and second effective echo times = 12 msec, 102 msec; long repetition time = 10 seconds and short repetition time = 0.5 second, with a scanning time of 7 minutes 34 seconds. Timing parameters varied among the 14 scanners (Table 1). Highly refocused TSE readouts minimized adverse metallic artifact effects.
Figure 2:
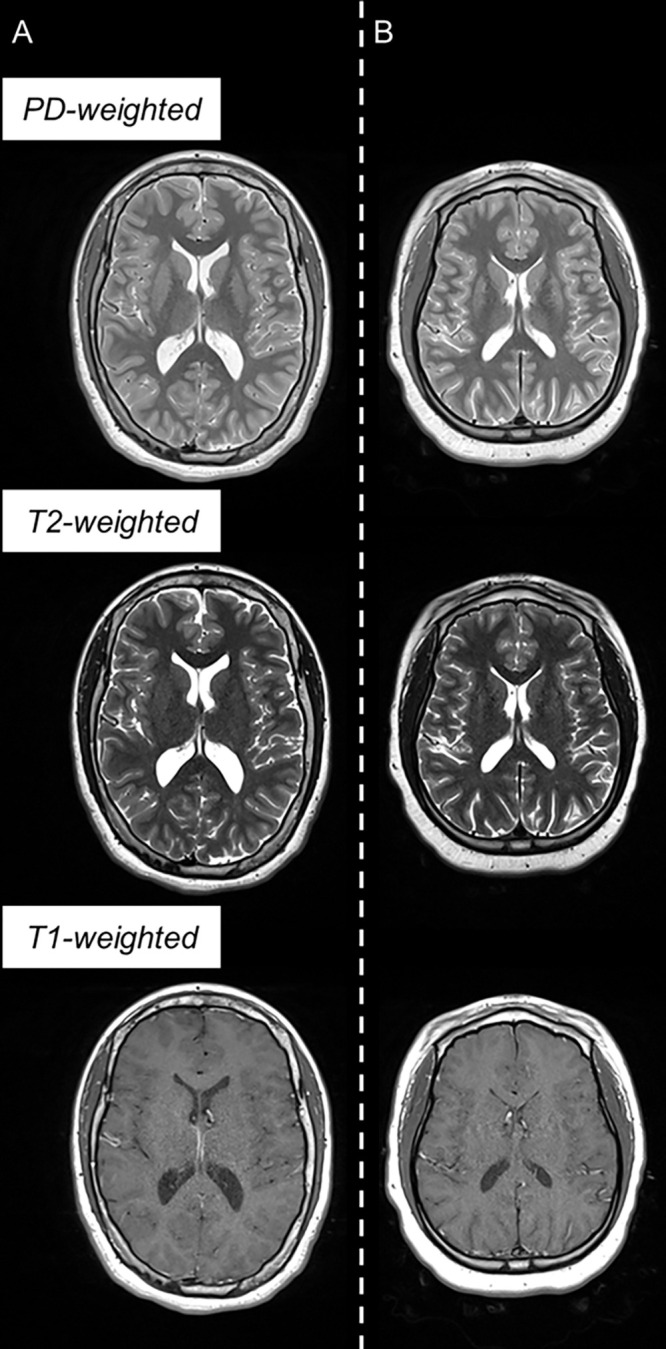
Example triple turbo spin-echo brain MRI scans in (A) neurotypically developing and (B) atypically developing extremely preterm–born adolescents. Proton density (PD)–weighted, T2-weighted, and T1-weighted images are provided. MRI scans in the atypically developing participant (full-scale intelligence quotient <85) demonstrated qualitatively smaller white and gray matter volumes and nearly indistinguishable tissue contrast compared with the neurotypically developing participant.
Table 1:
Triple TSE Imaging Parameters
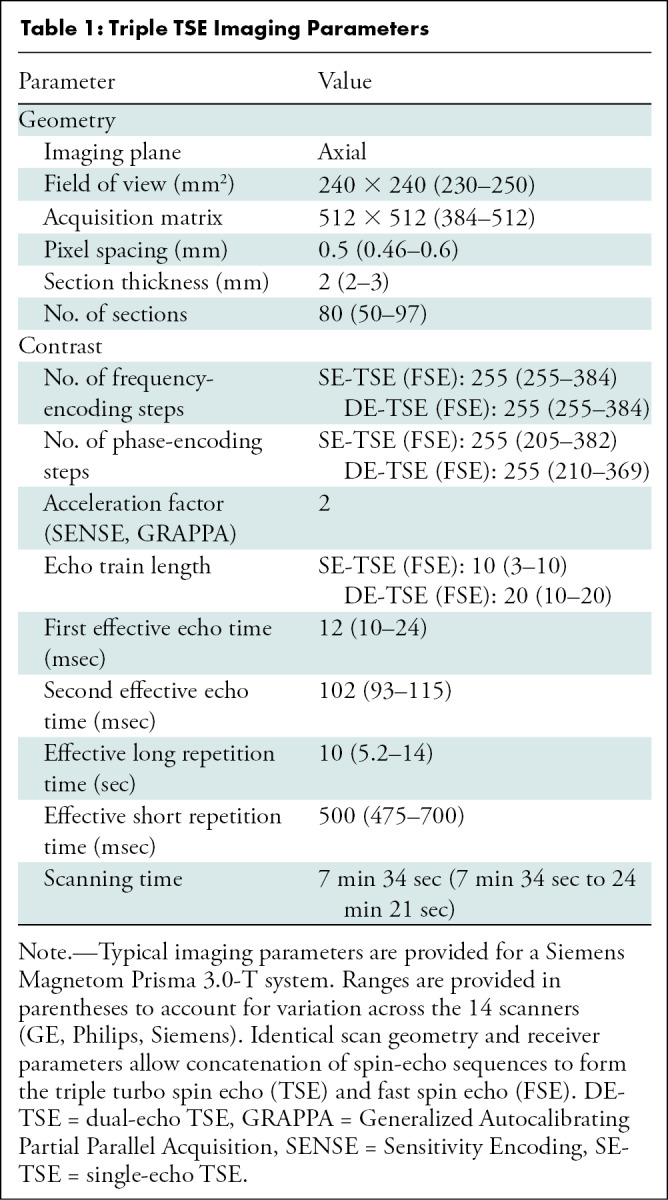
Image Processing Pipeline
The IPP consisted of segmentation and mapping algorithms programmed in Python (version 3.8.11) with the Anaconda Navigator (version 2.0.4) (Appendix E2 [online]). This automated, multisubject IPP required two Fiji-based preparation steps (version 2.1.0, National Institutes of Health) (26): (a) editing the intracranial matter (ICM) and (b) delineating the cerebellum. The IPP then consecutively processed images from all study participants unattended at 30 minutes per individual at native spatial resolution (Table 1, Fig E2 [online]). The cerebrospinal fluid (CSF)–normalized proton density (nPD), T1, and T2 qMRI maps, histograms, and mean values were exported for the ICM, cerebrum, and cerebellum (Fig E3 [online]).
Multiparametric qMRI harmonization.—Although the physical principles of the triple TSE (FSE) are fundamentally equivalent across vendors, manufacturer-specific variations cannot be ruled out. Three harmonization parameters (cf1, cf2, and cf3, for nPD, T1, and T2, respectively) were incorporated into the triple TSE (FSE) Bloch equation model, which is a function of pulse sequence control variables (Appendix E3 [online]). The IPP was run at half spatial resolution (voxel = 1.0 × 1.0 × 2 mm) to reduce total processing time, until the calibration parameters minimized interscanner discontinuities of cerebral WM nPD, T1, and T2 values. The IPP was then run at full resolution (Fig E4, Table E1 [online]).
WM texture at R1-weighted synthetic MRI.—WM texture hidden in nPD maps was uncovered with use of R1-weighted synthetic MRI (27,28):
 |
where the useful range of the weighting parameter is Ω = {0, 5R1(WM)}. This parameter was automatically adjusted for each participant with Ωopt = 4R1(WM) to generate consistent texture conspicuity (Fig E5 [online]).
Spatial entropy.—The spatial entropy of an image A at pixel (m, n) was calculated with (29)
 |
in which h(m, n) is the histogram of gray levels in a disk of radius R, centered about pixel (m, n). We used the entropy function of Scikit-Image (30) to generate spatial entropy maps of ISynth (Eq [1]) with an optimized four-pixel disk radius (Appendix E4, Fig E6B [online]). Spatial entropy density (SEd) was calculated as the spatial entropy per unit volume of the WM microstructure.
Statistical Analysis
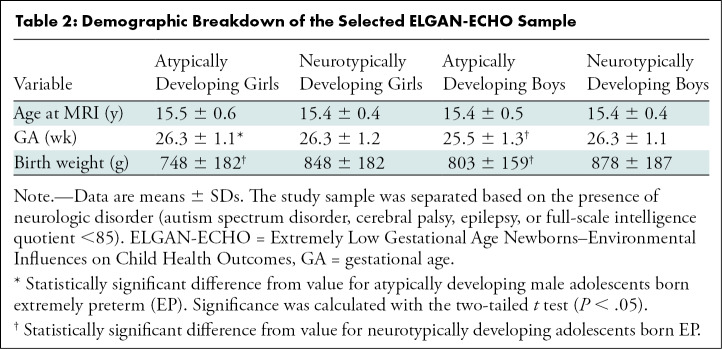
Demographic characteristics describe the sample (Table 2) and were not controlled for in later analyses. Tissue volumes and qMRI measures were compared for atypically versus neurotypically developing adolescents, stratified by sex, and for girls versus boys. Mean comparisons were performed with two-sample unequal variance two-tailed t tests, with P < .05 indicating statistically significant difference and 95% CIs provided for differences in means. Sex-stratified multiple regression models examined differences in the relationship between SEd (independent variable) and T1, T2, or nPD (dependent variables), summarized by the regression coefficients (ie, slopes) and 95% CIs of the independent variable. Interaction terms modeled differences in the slopes of these associations for atypically versus neurotypically developing adolescents, with P < .05 indicating statistically significant difference. Similar models examined differences in the association between the CSF volume and CSF T2. Scatterplots were inspected for outliers and violations in the linearity and normality assumptions of linear regression.
Table 2:
Demographic Breakdown of the Selected ELGAN-ECHO Sample
Results
Participant Characteristic Differences: Demographic Factors
A subsample of 368 adolescents was selected from all participating institutions as described in the participant selection flowchart (Fig 1) and was representative of the enrolled participants at age 15. Demographic characteristics of this sample are shown in Table 2. Participants were classified as atypically developing female participants (Atypf) (n = 50; mean age, 15.5 years ± 0.6 [SD]), neurotypically developing female participants (Ntypf) (n = 127; mean age, 15.4 years ± 0.4), atypically developing male participants (Atypm) (n = 66; mean age, 15.4 years ± 0.5), or neurotypically developing male participants (Ntypm) (n = 125; mean age, 15.4 years ± 0.4). Atypm versus Ntypm had 0.8 week (95% CI: 0.3, 1.1; P < .001) shorter gestational age. No evidence of a difference in mean gestational age was found between Atypf and Ntypf (26.3 weeks ± 1.1 vs 26.3 weeks ± 1.2; P = .97). Participant birth weight was 100 g lower (95% CI: 37, 163; P = .003) in Atypf versus Ntypf and 75 g lower (95% CI: 22, 127; P = .006) in Atypm compared with Ntypm. The age at MRI was not different for atypically versus neurotypically developing boys (P = .82) or girls (P = .12). Finally, atypically developing girls had longer gestational age than boys (26.3 weeks ± 1.1 vs 25.5 weeks ± 1.3; P = .001).
Multiparametric qMRI Differences between Atypically and Neurotypically Developing Participants
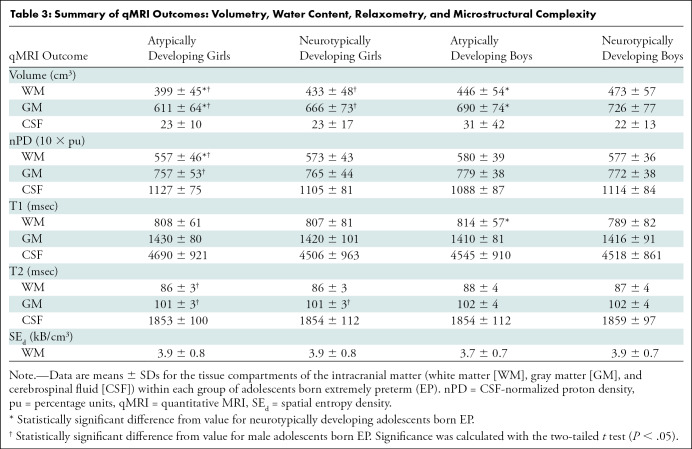
Atypically and neurotypically developing participants were distinguished by several volumetric measures and qMRI tissue metrics of WM and GM. Processing of the images in the EP participants with the IPP took approximately 7 days. ICM, cerebrum, and cerebellum volumes were smaller in Atypf versus Ntypf and Atypm versus Ntypm. In the ICM (Table 3), Atypf versus Ntypf WM volume was 34 cm3 smaller (95% CI: 19.4, 49.8; P < .001) and GM volume was 55 cm3 smaller (95% CI: 33.0, 77.3; P < .001). For Atypm versus Ntypm, WM volume was 27 cm3 smaller (95% CI: 10.2, 43.6; P = .002) and GM volume was 36 cm3 smaller (95% CI: 14.2, 59.4; P = .002). Mean CSF volumes were not different for atypically versus neurotypically developing girls (23 cm3 ± 10 vs 23 cm3 ± 17; P = .72) or boys (31 cm3 ± 42 vs 22 cm3 ± 13; P = .07). See Tables E2 and E3 (online) for cerebrum and cerebellum volumes and qMRI metrics.
Table 3:
Summary of qMRI Outcomes: Volumetry, Water Content, Relaxometry, and Microstructural Complexity
Atypically developing and neurotypically developing participants differed in nPD, T1, and SEd. In the ICM, Atypf had lower mean WM nPD than Ntypf (557 10 × percent unit [pu] ± 46 vs 573 10 × pu ± 43; P = .04) and Atypm had longer mean WM T1 than Ntypm (814 msec ± 57 vs 789 msec ± 82; P = .01). Mean GM and CSF nPD, T1, and T2 were not different for atypically versus neurotypically developing adolescents (Table 3). The cerebrum and cerebellum had similar differences for nPD, T1, and T2 of WM, GM, and CSF between atypically and neurotypically developing adolescents. Atypm also had lower SEd than Ntypm in the cerebellar WM (4.7 kB/cm3 ± 1.0 vs 5.2 kB/cm3 ± 1.3; P = .02).
Multiparametric qMRI Differences between Girls and Boys
EP-born adolescents were also observed to have sex-related differences in WM and GM volumes and qMRI metrics (Table 3). In the ICM, WM volume in Atypf versus Atypm was 47 cm3 smaller (95% CI: 29.1, 66.0; P < .001) and GM volume was 79 cm3 smaller (95% CI: 53.5, 104.7; P < .001). For Ntypf versus Ntypm, WM volume was 40 cm3 smaller (95% CI: 26.6, 53.0; P < .001) and GM volume was 60 cm3 smaller (95% CI: 42.0, 79.5; P < .001). CSF volumes were not different between Atypf and Atypm (23 cm3 ± 10 vs 31 cm3 ± 42; P = .11) and Ntypf versus Ntypm (23 cm3 ± 17 vs 22 cm3 ± 13; P = .37). See Tables E2 and E3 (online) for cerebrum and cerebellum volumes and qMRI metrics.
Sex-related differences were also observed in nPD, T2, and SEd (Table 3). WM in Atypf versus Atypm had 23 10 × pu (95% CI: 7.0, 39.1; P = .006) lower nPD, and GM had 22 10 × pu (95% CI: 4.0, 39.4; P = .02) lower nPD. Atypf versus Atypm also had shorter mean WM T2 (86 msec ± 3.3 vs 88 msec ± 3.7; P = .003) and shorter mean GM T2 (101 msec ± 3.0 vs 102 msec ± 4.1; P = .02). Ntypf had shorter GM T2 than Ntypm (101 msec ± 2.9 vs 102 msec ± 3.7; P = .03). We did not find evidence of sex differences between Ntypf and Ntypm WM or GM nPD and T1. The cerebrum had similar sex differences (Table E2 [online]). Cerebellums in Atypf versus Atypm had shorter mean WM T2 (89 msec ± 3.5 vs 91 msec ± 3.1; P = .001) and on average 0.5 kB/cm3 (95% CI: 0.1, 0.9; P = .03) greater SEd. Cerebellums in Ntypf had shorter mean WM T2 than in Ntypm (89 msec ± 3.4 vs 90 msec ± 3.2; P = .04) (Table E3 [online]).
Multiple Regression of Multiparametric qMRI and Spatial Entropy
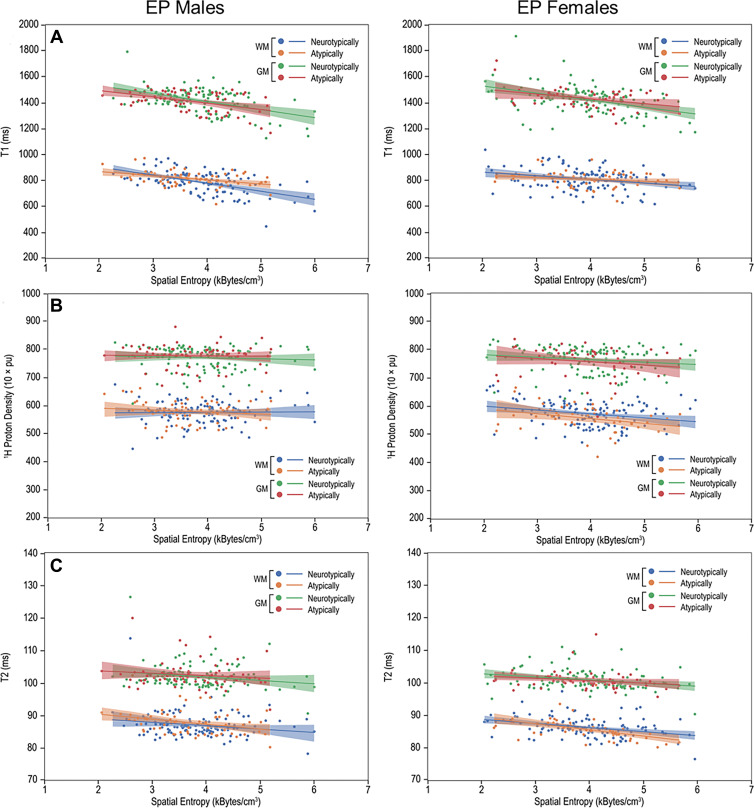
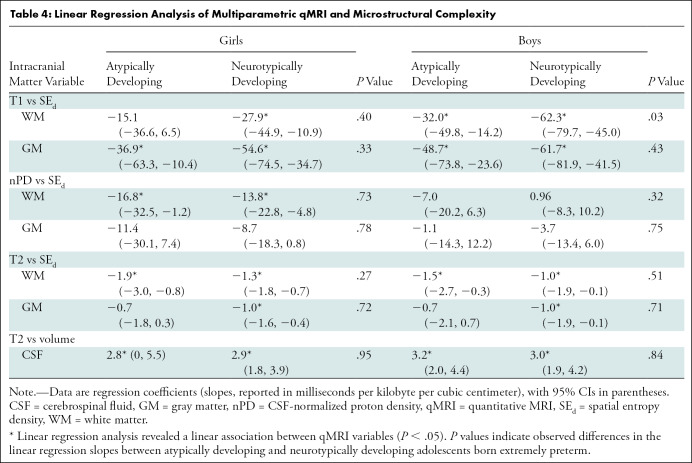
Multiple regression models revealed negative associations between mean T1, nPD, and T2 and SEd in the WM and GM of Atypf, Ntypf, Atypm, and Ntypm (Fig 3, Table 4). Comparison of the regression coefficients with use of an interaction term showed differences between Atypm and Ntypm. In the ICM, Atypm WM had a more moderate negative association between T1 and SEd compared with that of Ntypm (slope, –32.0 msec per kB/cm3 [95% CI: –49.8, –14.2] vs –62.3 msec per kB/cm3 [95% CI: –79.7, –45.0]; P = .03). This difference was also observed in the cerebrum (Fig E9A, Table E4 [online]): Atypm versus Ntypm also had a more moderate negative association between T1 and SEd (–61.5 msec per kB/cm3 [95% CI: –78.7, –44.4] vs –31.3 msec per kB/cm3 [95% CI: –49.3, –13.4]; P = .03). While the association of mean nPD on SEd was negative in cerebellar WM in Atypm, it was positive in Ntypm (–8.0 10 × pu per kB/cm3 [95% CI: –19.0, 2.9] vs 5.4 10 × pu per kB/cm3 [95% CI: –0.2, 11.1]; P = .02) (Fig E10A, Table E5 [online]). The regression coefficients of qMRI associations with SEd for ICM, cerebrum, or cerebellum WM or GM in female participants did not differ.
Figure 3:
Multiparametric quantitative MRI parameters versus spatial entropy density (SEd). Scatterplots and linear fitting of the mean (A) T1, (B) normalized proton density, and (C) T2 values versus SEd of the white matter (WM) and gray matter (GM) for neurotypically and atypically developing extremely preterm (EP)–born adolescents. Differences in the associations of T1 and SEd were observed in the WM between atypically and neurotypically developing boys. pu = percent unit.
Table 4:
Linear Regression Analysis of Multiparametric qMRI and Microstructural Complexity
Multiple Regression of Multiparametric qMRI and CSF
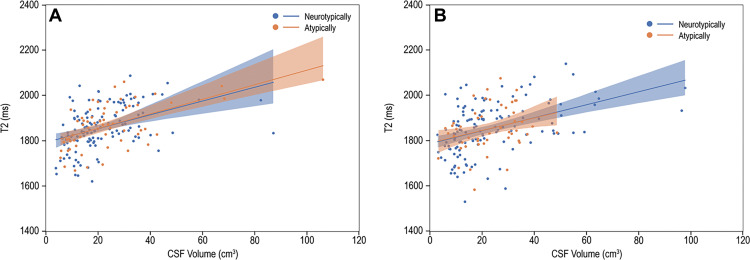
Multiple regression parameters of ventricular CSF relaxation times and volume are shown in Table 4. Among Atypf, Ntypf, Atypm, and Ntypm, mean T2 of ventricular CSF was positively associated with the volume of ventricular CSF (Fig 4). Comparisons of the regression coefficients for the association of mean CSF T2 on the volume of ventricular CSF with use of an interaction term did not show differences between Atypf and Ntypf (2.8 msec/cm3 [95% CI: 0, 5.5] vs 2.9 msec/cm3 [95% CI: 1.8, 3.9]; P = .95). The coefficients for Atypm and Ntypm also did not differ (3.2 msec/cm3 [95% CI: 2.0, 4.4] vs 3.0 msec/cm3 [95% CI: 1.9, 4.2]; P = .84).
Figure 4:
T2 versus cerebrospinal fluid (CSF) volume. Scatterplots and linear fitting of ventricular CSF relaxation times and volume for (A) boys and (B) girls. The presence of functional abnormality had limited impact on the association between the T2 relaxation and volume of CSF.
Discussion
Despite advances in neonatal care of individuals born extremely preterm (EP), there remains a high incidence of adverse neurologic outcomes. In our study, we hypothesized that multiparametric quantitative MRI (qMRI) could reveal insights into the underlying biologic characteristics of abnormal neurologic outcomes. A Python-programmed image processing pipeline generated high-spatial-resolution maps of cerebrospinal fluid–normalized proton density (nPD), T1, T2, and spatial entropy and calculated volumes of the intracranial volume, cerebrum, and cerebellum for 368 atypically and neurotypically developing adolescents born EP, stratified by sex. Multicenter harmonization, segmentation, and complete qMRI processing of triple turbo spin-echo brain MRI scans took approximately 30 minutes per participant. We detected sex-related group differences for nPD and T2 of white matter (WM) and gray matter (GM), with atypically developing female participants (Atypf) having lower nPD and shorter T2 than atypically developing male participants (Atypm). In addition to reduced WM and GM volumes, nPD was lower in Atypf versus neurotypically developing female participants, and T1 relaxation was longer in Atypm versus neurotypically developing male participants (Ntypm). Furthermore, the negative association of T1 and spatial entropy density was more moderate in Atypm compared with Ntypm. Atypical development went beyond expected tissue quantity reductions, as implied by changes in qMRI.
Inflammation-inducing perinatal exposures may disrupt brain development through dysmaturation of preoligodendrocytes and WM axons (3). Changes in fractional anisotropy, apparent diffusion coefficient, and mean, axial, and radial diffusivity have been shown in neonates, school-aged children, and adolescents born premature as possible biomarkers of disrupted WM microstructure (9,18,20,31). These outcomes also reflect sex-related WM microstructural differences at adolescence (12,13). Furthermore, T1 has been shown to correlate with apparent diffusion coefficient, fractional anisotropy, and radial diffusivity in preterm neonates (18,20) and school-aged children (31). Our results complement the existing body of evidence that abnormal developmental pathways can be potentially understood with use of multiparametric qMRI, with potential implications for improving diagnosis and therapeutic intervention—specifically, that nPD, T1, and T2 carry differential information distinguishing neurologically atypically and neurotypically developing girls and boys born EP and the associations with SEd (29,32) can provide additional insight into differences in the structural underpinnings of MRI relaxation.
Enlarged ventricular spaces are common complications of EP birth, which may accompany neurologic disorders. Compared with term-born individuals, those born preterm demonstrated increased CSF volume (33), with 12% of those born EP experiencing ventriculomegaly before discharge from neonatal intensive care (22). In our study, we found atypically and neurotypically developing adolescents have no detectable differences in ventricular CSF volume and have positive associations between these volumes and the T2 of CSF. Previous studies demonstrated alterations in CSF T2 from carbon dioxide (34) or glucose level changes (35). Observed volume-related CSF variabilities may reflect the ability of the brain to modulate and maintain the homeostasis of parenchymal brain cells (36) following EP birth.
Our study has limitations. First, there were residual data harmonization imperfections. Although the triple TSE (FSE) has shared operational principles, its implementation can vary among vendors and even between scanner models and software releases. Differences can exist in the TSE (FSE) readouts, variables, and phase encoding order implementations, which are not necessarily reported in the Digital Imaging and Communications in Medicine headers. Such differences manifest in qMRI parameter values, inducing discontinuities between sites and scanners and requiring corrective measures in the mapping algorithms. Ultimately, harmonization success relies on being discriminative for the biologic variable of interest while being indistinguishable with respect to the scanner used to acquire the data (37). As the radiology practice shifts to generating more quantitative measures, manufacturers will likely move toward image acquisition preharmonization, facilitating large-scale multisite multivendor studies and clinical practice. Second, the prevalence of metallic braces and dental implants during adolescence restricted the number of processable data sets.
In conclusion, the brain of adolescents born extremely preterm has a broad distribution of developmental states that can be quantified with use of volumetry, normalized proton density, T1, and T2, including their association with spatial entropy density (SEd), which differs based on the presence of neurologic disorder and the patient sex. Differences in the measured parameters and their relationships with tissue organization were found when comparing atypically and neurotypically developing adolescents stratified by sex. Notably, atypically developing participants show more marked sexual dimorphisms in cerebrospinal fluid–normalized proton density (nPD) and T2 than neurotypically developing participants, perhaps further characterizing the known heightened vulnerabilities of atypically developing boys. Atypically developing girls had lower nPD than neurotypically developing girls. Furthermore, atypically developing boys had longer T1 and more moderate associations of T1 and SEd compared with neurotypically developing boys, possibly indicating lessened tissue architecture organization. Further studies are needed to complement these findings with nonimaging clinical outcomes and perinatal inflammatory antecedents.
Acknowledgments
Acknowledgments
The authors gratefully acknowledge the contributions of the study participants and their families. We also acknowledge Kathryn Keenan, PhD; Stephen Russek, PhD; and the Magnetic Imaging Group for the loan of an International Society for Magnetic Resonance in Medicine/National Institute of Standards and Technology (NIST) system phantom via the NIST/National Institute of Biomedical Imaging and Bioengineering Medical Imaging Phantom Library: https://www.nist.gov/programs-projects/nistnibib-medical-imaging-phantom-lending-library.
The complete list of group members appears in Appendix E1 (online).
Supported in part by the National Institute of Neurological Disorders and Stroke (5U01NS040069-05 and 2R01NS040069-09), National Institutes of Health Office of the Director (5UH3OD023348-06), and the National Institute of Child Health and Human Development (5P30HD018655-28).
Disclosures of conflicts of interest: R.M. Patent pending MR fibrography assigned to Boston University and/or Boston Medical Center. C.P. No relevant relationships. O.S. Royalties from Gakken Medical Shujunsha and Medical Sciences International; consulting fees from Boston Imaging Core Lab; honorarium from Bayer Yakuhin. J.V.R. No relevant relationships. X.Z. No relevant relationships. D.N.K. Grants from the National Institutes of Health (R01 MH083320, P41 EB019936, R24EB029173, and R25DA051675); treasurer elect of the Organization for Human Brain Mapping. J.A.F. Grants to institution from Autism Speaks, National Institute of Mental Health, Eagles Foundation, Healix, National Library of Medicine, Riccio Fund, Fulcrum, and Roche; honorarium for grand rounds from the University of Michigan. L.D. No relevant relationships. T.H. No relevant relationships. R.C.F. No relevant relationships. T.M.O. No relevant relationships. K.K.K. No relevant relationships. H.J. Book royalties from World Scientific Publishing; patents or patents pending on qMRI techniques and MR fibrography assigned to Boston University and/or Boston Medical Center; member of the Radiology Editorial Board.
Abbreviations:
- Atypf
- atypically developing female participants
- Atypm
- atypically developing male participants
- CSF
- cerebrospinal fluid
- EP
- extremely preterm
- FSE
- fast spin echo
- GM
- gray matter
- ICM
- intracranial matter
- IPP
- image processing pipeline
- nPD
- CSF-normalized proton density
- Ntypf
- neurotypically developing female participants
- Ntypm
- neurotypically developing male participants
- qMRI
- quantitative MRI
- SEd
- spatial entropy density
- TSE
- turbo spin echo
- WM
- white matter
Contributor Information
Hernán Jara, Email: hjara@bu.edu.
Collaborators: Julie V. Rollins, Bhavesh Shah, Rachana Singh, Ruben Vaidya, Linda Van Marter, Camilla Martin, Janice Ware, Caitlin Rollins, Cynthia Cole, Ellen Perrin, Christina Sakai, Frank Bednarek, Jean Frazier, Richard Ehrenkranz, Jennifer Benjamin, Angela Montgomery, T. Michael O'Shea, Lisa Washburn, Semsa Gogcu, Carl Bose, Diane Warner, T. Michael O'Shea, Steve Engelke, Amanda Higginson, Jason Higginson, Kelly Bear, Mariel Poortenga, Steve Pastyrnak, Padu Karna, Nigel Paneth, Madeleine Lenski, Michael Schreiber, Scott Hunter, Michael Msall, Danny Batton, Judith Klarr, Young Ah Lee, Rawad Obeid, Karen Christianson, Deborah Klein, Katie Wagner, Maureen Pimental, Collen Hallisey, Taryn Coster, Maddie Dolins, Maggie Mittleman, Hannah Haile, Julia Rohde, Ellen Nylen, Emily Neger, Kathryn Mattern, Catherine Ma, Deanna Toner, Elizabeth Vitaro, Lauren Venuti, Beth Powers, Ann Foley, Taylor Sacco, Joanne Williams, Elaine Romano, Christine Henry, Debbie Hiatt, Nancy Peters, Patricia Brown, Emily Ansusinha, Jazmyne Smith, Nou Yang, Gennie Bose, Janice Wereszczak, Janice Bernhardt, Joan Adams, Donna Wilson, Nancy Darden-Saad, Bree Williams, Emily Jones, Dinah Sutton, Julie Rathbun, Stephanie Fagerman, William Boshoven, Jalen Johnson, Brandon James, Karen Miras, Carolyn Solomon, Deborah Weiland, Grace Yoon, Rugile Ramoskaite, Suzanne Wiggins, Krissy Washington, Ryan Martin, Barbara Prendergast, Emma Lynch, Beth Kring, Anne Smith, Susan McQuiston, Samantha Butler, Rachel Wilson, Kirsten McGhee, Patricia Lee, Aimee Asgarian, Anjali Sadhwani, Brandi Henson, Cecelia Keller, Jenifer Walkowiak, Susan Barron, Alice Miller, Brian Dessureau, Molly Wood, Jill Damon-Minow, Elaine Romano, Linda Mayes, Kathy Tsatsanis, Katarzyna Chawarska, Sophy Kim, Susan Dieterich, Karen Bearrs, Ellen Waldrep, Jackie Friedman, Gail Hounshell, Debbie Allred, Rebecca Helms, Lynn Whitley, Gary Stainback, Lisa Bostic, Amanda Jacobson, Joni McKeeman, Echo Meyer, Joan Price, Megan Lloyd, Susan Plesha-Troyke, Megan Scott, Katherine M. Solomon, Kara Brooklier, and Kelly Vogt
References
- 1. Whitfield JM , Peters BA , Shoemaker C . Conference summary: a celebration of a century of neonatal care . Proc Bayl Univ Med Cent 2004. ; 17 ( 3 ): 255– 258 . [DOI] [PMC free article] [PubMed] [Google Scholar]
- 2. Douglass LM , Heeren TC , Stafstrom CE , et al . Cumulative incidence of seizures and epilepsy in ten-year-old children born before 28 weeks’ gestation . Pediatr Neurol 2017. ; 73 : 13– 19 . [DOI] [PMC free article] [PubMed] [Google Scholar]
- 3. Volpe JJ . Dysmaturation of premature brain: importance, cellular mechanisms, and potential interventions . Pediatr Neurol 2019. ; 95 : 42– 66 . [DOI] [PubMed] [Google Scholar]
- 4. Back SA . White matter injury in the preterm infant: pathology and mechanisms . Acta Neuropathol (Berl) 2017. ; 134 ( 3 ): 331– 349 . [DOI] [PMC free article] [PubMed] [Google Scholar]
- 5. Lebel C , Treit S , Beaulieu C . A review of diffusion MRI of typical white matter development from early childhood to young adulthood . NMR Biomed 2019. ; 32 ( 4 ): e3778. [DOI] [PubMed] [Google Scholar]
- 6. Novikov DS , Fieremans E , Jespersen SN , Kiselev VG . Quantifying brain microstructure with diffusion MRI: theory and parameter estimation . NMR Biomed 2019. ; 32 ( 4 ): e3998. [DOI] [PMC free article] [PubMed] [Google Scholar]
- 7. Thompson DK , Inder TE , Faggian N , et al . Characterization of the corpus callosum in very preterm and full-term infants utilizing MRI . Neuroimage 2011. ; 55 ( 2 ): 479– 490 . [DOI] [PMC free article] [PubMed] [Google Scholar]
- 8. Nagy Z , Westerberg H , Skare S , et al . Preterm children have disturbances of white matter at 11 years of age as shown by diffusion tensor imaging . Pediatr Res 2003. ; 54 ( 5 ): 672– 679 . [DOI] [PubMed] [Google Scholar]
- 9. Vangberg TR , Skranes J , Dale AM , Martinussen M , Brubakk A-M , Haraldseth O . Changes in white matter diffusion anisotropy in adolescents born prematurely . Neuroimage 2006. ; 32 ( 4 ): 1538– 1548 . [DOI] [PubMed] [Google Scholar]
- 10. Mullen KM , Vohr BR , Katz KH , et al . Preterm birth results in alterations in neural connectivity at age 16 years . Neuroimage 2011. ; 54 ( 4 ): 2563– 2570 . [DOI] [PMC free article] [PubMed] [Google Scholar]
- 11. Kontis D , Catani M , Cuddy M , et al . Diffusion tensor MRI of the corpus callosum and cognitive function in adults born preterm . Neuroreport 2009. ; 20 ( 4 ): 424– 428 . [DOI] [PubMed] [Google Scholar]
- 12. Herting MM , Maxwell EC , Irvine C , Nagel BJ . The impact of sex, puberty, and hormones on white matter microstructure in adolescents . Cereb Cortex 2012. ; 22 ( 9 ): 1979– 1992 . [DOI] [PMC free article] [PubMed] [Google Scholar]
- 13. Bava S , Boucquey V , Goldenberg D , et al . Sex differences in adolescent white matter architecture . Brain Res 2011. ; 1375 : 41– 48 . [DOI] [PMC free article] [PubMed] [Google Scholar]
- 14. van Hemmen J , Saris IMJ , Cohen-Kettenis PT , Veltman DJ , Pouwels PJW , Bakker J . Sex differences in white matter microstructure in the human brain predominantly reflect differences in sex hormone exposure . Cereb Cortex 2017. ; 27 ( 5 ): 2994– 3001 . [DOI] [PubMed] [Google Scholar]
- 15. Dubner SE , Dodson CK , Marchman VA , Ben-Shachar M , Feldman HM , Travis KE . White matter microstructure and cognitive outcomes in relation to neonatal inflammation in 6-year-old children born preterm . Neuroimage Clin 2019. ; 23 : 101832. [DOI] [PMC free article] [PubMed] [Google Scholar]
- 16. Lorio S , Tierney TM , McDowell A , et al . Flexible proton density (PD) mapping using multi-contrast variable flip angle (VFA) data . Neuroimage 2019. ; 186 : 464– 475 . [DOI] [PMC free article] [PubMed] [Google Scholar]
- 17. Vandewouw MM , Young JM , Shroff MM , Taylor MJ , Sled JG . Altered myelin maturation in four year old children born very preterm . Neuroimage Clin 2019. ; 21 : 101635. [DOI] [PMC free article] [PubMed] [Google Scholar]
- 18. Schneider J , Kober T , Bickle Graz M , et al . Evolution of T1 relaxation, ADC, and fractional anisotropy during early brain maturation: a serial imaging study on preterm infants . AJNR Am J Neuroradiol 2016. ; 37 ( 1 ): 155– 162 . [DOI] [PMC free article] [PubMed] [Google Scholar]
- 19. Dingwall N , Chalk A , Martin TI , et al . T2 relaxometry in the extremely-preterm brain at adolescence . Magn Reson Imaging 2016. ; 34 ( 4 ): 508– 514 . [DOI] [PMC free article] [PubMed] [Google Scholar]
- 20. Nossin-Manor R , Card D , Morris D , et al . Quantitative MRI in the very preterm brain: assessing tissue organization and myelination using magnetization transfer, diffusion tensor and T1 imaging . Neuroimage 2013. ; 64 : 505– 516 . [DOI] [PubMed] [Google Scholar]
- 21. Counsell SJ , Kennea NL , Herlihy AH , et al . T2 relaxation values in the developing preterm brain . AJNR Am J Neuroradiol 2003. ; 24 ( 8 ): 1654– 1660 . [PMC free article] [PubMed] [Google Scholar]
- 22. O'Shea TM , Allred EN , Dammann O , et al . The ELGAN study of the brain and related disorders in extremely low gestational age newborns . Early Hum Dev 2009. ; 85 ( 11 ): 719– 725 . [DOI] [PMC free article] [PubMed] [Google Scholar]
- 23. Sanderson KR , Chang E , Bjornstad E , et al . Albuminuria, hypertension, and reduced kidney volumes in adolescents born extremely premature . Front Pediatr 2020. ; 8 : 230. [DOI] [PMC free article] [PubMed] [Google Scholar]
- 24. Joseph RM , O'Shea TM , Allred EN , et al . Prevalence and associated features of autism spectrum disorder in extremely low gestational age newborns at age 10 years . Autism Res 2017. ; 10 ( 2 ): 224– 232 . [DOI] [PMC free article] [PubMed] [Google Scholar]
- 25. Kuban KC , Allred EN , O'Shea M , et al . An algorithm for identifying and classifying cerebral palsy in young children . J Pediatr 2008. ; 153 ( 4 ): 466– 472 . [DOI] [PMC free article] [PubMed] [Google Scholar]
- 26. Schindelin J , Arganda-Carreras I , Frise E , et al . Fiji: an open-source platform for biological-image analysis . Nat Methods 2012. ; 9 ( 7 ): 676– 682 . [DOI] [PMC free article] [PubMed] [Google Scholar]
- 27. Jara H , Sakai O , Heeren T , Kuban K , O'Shea TM . Connectome of the extremely preterm brain at adolescence and measures of cognitive functioning: early experience with white matter fibrography (WMF) [abstr] . In: Proceedings of the Twenty-Sixth Meeting of the International Society for Magnetic Resonance in Medicine . Berkeley, Calif : International Society for Magnetic Resonance in Medicine , 2018. . [Google Scholar]
- 28. Jara H , Sakai O , Anderson SW , Soto JAMR . Fibrography: an application of correlation time diffusion synthetic MRI (1.5T and 3.0T) [abstr] . In: Proceedings of the RSNA . Oak Brook, Ill : Radiological Society of North America , 2016. . [Google Scholar]
- 29. Celik T . Spatial entropy-based global and local image contrast enhancement . IEEE Trans Image Process 2014. ; 23 ( 12 ): 5298– 5308 . [DOI] [PubMed] [Google Scholar]
- 30. van der Walt S , Schönberger JL , Nunez-Iglesias J , et al . scikit-image: image processing in Python . PeerJ 2014. ; 2 : e453. [DOI] [PMC free article] [PubMed] [Google Scholar]
- 31. Travis KE , Castro MRH , Berman S , et al . More than myelin: probing white matter differences in prematurity with quantitative T1 and diffusion MRI . Neuroimage Clin 2019. ; 22 : 101756. [DOI] [PMC free article] [PubMed] [Google Scholar]
- 32. Batty M , Morphet R , Masucci P , Stanilov K . Entropy, complexity, and spatial information . J Geogr Syst 2014. ; 16 ( 4 ): 363– 385 . [DOI] [PMC free article] [PubMed] [Google Scholar]
- 33. Kesler SR , Ment LR , Vohr B , et al . Volumetric analysis of regional cerebral development in preterm children . Pediatr Neurol 2004. ; 31 ( 5 ): 318– 325 . [DOI] [PMC free article] [PubMed] [Google Scholar]
- 34. Daoust A , Dodd S , Nair G , et al . Transverse relaxation of cerebrospinal fluid depends on glucose concentration . Magn Reson Imaging 2017. ; 44 : 72– 81 . [DOI] [PMC free article] [PubMed] [Google Scholar]
- 35. Piechnik SK , Evans J , Bary LH , Wise RG , Jezzard P . Functional changes in CSF volume estimated using measurement of water T2 relaxation . Magn Reson Med 2009. ; 61 ( 3 ): 579– 586 . [DOI] [PubMed] [Google Scholar]
- 36. Illes S . More than a drainage fluid: the role of CSF in signaling in the brain and other effects on brain tissue . Handb Clin Neurol 2018. ; 146 : 33– 46 . [DOI] [PubMed] [Google Scholar]
- 37. Dinsdale NK , Jenkinson M , Namburete AIL . Deep learning-based unlearning of dataset bias for MRI harmonisation and confound removal . Neuroimage 2021. ; 228 : 117689. [DOI] [PMC free article] [PubMed] [Google Scholar]


