

ABSTRACT
Little is known of the impact of individual SFAs and their isoenergetic substitution with other SFAs or unsaturated fatty acids (UFAs) on the prevention of cardiometabolic disease (CMD). This systematic literature review assessed the impact of such dietary substitutions on a range of fasting CMD risk markers, including lipid profile, markers of glycemic control and inflammation, and metabolic hormone concentrations. Eligible randomized controlled trials (RCTs) investigated the effect of isoenergetic replacements of individual dietary SFAs for ≥14 d on ≥1 CMD risk markers in humans. Searches of the PubMed, Embase, Scopus, and Cochrane CENTRAL databases on 14 February, 2021 identified 44 RCTs conducted in participants with a mean ± SD age of 39.9 ± 15.2 y. Studies’ risk of bias was assessed using the Cochrane Risk of Bias tool 2.0 for RCTs. Random-effect meta-analyses assessed the effect of ≥3 similar dietary substitutions on the same CMD risk marker. Other dietary interventions were described in qualitative syntheses. We observed reductions in LDL-cholesterol concentrations after the replacement of palmitic acid (16:0) with UFAs (−0.36 mmol/L; 95% CI: −0.50, −0.21 mmol/L; I2 = 96.0%, n = 18 RCTs) or oleic acid (18:1n–9) (−0.16 mmol/L; 95% CI: −0.28, −0.03 mmol/L; I2 = 89.6%, n = 9 RCTs), with a similar impact on total cholesterol and apoB concentrations. No effects on other CMD risk markers, including HDL-cholesterol, triacylglycerol, glucose, insulin, or C-reactive protein concentrations, were evident. Similarly, we found no evidence of a benefit from replacing dietary stearic acid (18:0) with UFAs on CMD risk markers (n = 4 RCTs). In conclusion, the impact of replacing dietary palmitic acid with UFAs on lipid biomarkers is aligned with current public health recommendations. However, owing to the high heterogeneity and limited studies, relations between all individual SFAs and biomarkers of cardiometabolic health need further confirmation from RCTs. This systematic review was registered at www.crd.york.ac.uk/prospero/ as CRD42020084241.
Keywords: palmitic acid, stearic acid, myristic acid, medium-chain fatty acids, saturated fatty acids, unsaturated fatty acids, lipoproteins, fasting lipid profile, glucose, insulin
Statement of Significance: This is the first systematic review and meta-analysis of randomized controlled trials that assessed the impact of individual SFAs and their isoenergetic substitution on a wide range of risk markers of cardiometabolic diseases (including lipid profile, markers of glycemic control, markers of inflammation, and metabolic hormones).
Introduction
Cardiovascular diseases (CVDs) are the main cause of death worldwide with an estimated 17.9 million deaths from CVDs in 2019 (1). The etiology of CVD is complex and often results from a combination of risk factors, including the presence of other metabolic disorders and cardiometabolic diseases (CMDs) such as type 2 diabetes, hypertension, or hyperlipidemia (1). In particular, the fasting lipid profile and markers of glycemic control are routinely used as clinical biomarkers of risks of CVD and type 2 diabetes, but other risk factors such as markers of inflammation or blood hemostasis have been less extensively studied (2, 3). Changes in environmental and behavioral factors, such as dietary habits, tobacco use, and physical activity, have been identified as important strategies to help prevent CMD risk at a population level (4).
Among dietary factors, public health guidelines around the world advocate a reduction of dietary SFAs in favor of unsaturated fatty acids (UFAs), with a general consensus that dietary SFAs should not exceed ∼10% total energy (%TE) intakes (5, 6). These recommendations are supported by systematic literature reviews (SLRs) and meta-analyses, such as the 2020 updated analysis of 12 randomized controlled trials (RCTs) from Hooper et al. (7) which reported a 17% decrease in CVD event risk associated with reduced dietary SFAs and showed an inverse linear relation between the amount of SFA removed from the diet and CVD risk. However, in the context of isoenergetic dietary replacements, a reduction of SFAs can only be achieved with a concomitant increase in another type of dietary fat or another macronutrient. Current epidemiologic evidence suggests that replacing dietary SFAs with PUFAs might lead to a greater reduction of CMD risk than with other nutrients which have been less extensively studied (e.g., MUFAs or other nutrients like carbohydrates) (7, 8).
Importantly, dietary guidelines currently consider dietary SFAs as a whole group, but emerging evidence suggests that individual SFAs might have differential impacts on cardiometabolic health (9, 10). In a 2016 WHO SLR and regression analysis on the effect of SFAs on serum lipids and lipoproteins, Mensink (11) predicted that total cholesterol (TC), HDL-cholesterol, and LDL-cholesterol concentrations would increase when dietary carbohydrates were replaced with lauric (12:0), myristic (14:0), or palmitic (16:0) acids, but not stearic acid (18:0). This potential distinction of individual fatty acids (FAs) in the context of cardiometabolic health is reflected in current French dietary guidelines, which have recommended since 2011 that the sum of dietary lauric, myristic, and palmitic acids should not exceed 8%TE in adults (12), but this is not the case in other countries.
Despite the growing interest in the differential roles of individual SFAs in cardiometabolic health, to our knowledge there are no published SLRs or meta-analyses of well-controlled intervention studies investigating this research topic. Therefore, the objective of this SLR and meta-analysis was to address this knowledge gap. The hypothesis of this analysis was that the chronic consumption of individual dietary SFAs will have differential effects on circulating lipids and other markers of CMD risk.
Methods
This SLR and meta-analysis was conducted according to guidelines from the Cochrane Network and the Preferred Reporting Items for Systematic Reviews and Meta-Analyses (PRISMA) guidelines (13). It was registered in the International Prospective Register of Systematic Reviews (PROSPERO) as CRD42020084241.
Eligibility criteria and search strategy
This SLR included RCTs which investigated the impact of the dietary replacement of individual SFAs with other individual SFAs or UFAs on markers of cardiometabolic health. Eligible studies included in this SLR were defined as full-text, peer-reviewed, original research reports of RCTs published in the English language, which investigated food-based isoenergetic dietary fat interventions implemented for ≥14 d on humans aged >3 y old, and presented ≥1 fasting biomarker for circulating lipids, inflammation, glycemic control, hemostasis, or hormones. The groups considered for synthesis were defined as dietary interventions replacing 1 out of 8 groups of dietary SFAs defined by their carbon-chain length [i.e., medium-chain SFAs < 12:0, lauric acid, myristic acid, pentadecanoic acid (15:0), palmitic acid, heptadecanoic acid (17:0), stearic acid, long-chain SFAs > 18:0] or trans FAs with another group of SFAs, UFAs, or trans FAs. Only dietary interventions exchanging ≥1.5%TE of palmitic or stearic acid, or ≥1%TE of other FAs were considered eligible for inclusion. Studies were excluded if any of the foregoing criteria was not met, if >1 group of SFAs was exchanged, if the amount of dietary fat exchanged could not be expressed as %TE, if studies reported results from parenteral/enteral nutrition interventions, or if they included critically ill patients (e.g., cancer).
RCTs published before 14 February, 2021 were searched in PubMed, Embase, Scopus, and the Cochrane CENTRAL register for clinical trials using 2 predefined comprehensive query syntaxes (Supplemental Method 1). The first search focused on serum lipids and lipoproteins, whereas the second search aimed to identify RCTs presenting all other predefined eligible outcomes. Finally, additional references were identified from previous systematic reviews of RCTs on dietary fat and cardiometabolic health.
Selection and data collection process
Results from literature searches were imported into reference manager software packages [Zotero 5.0 (Corporation for Digital Scholarship) and Endnote X9 (Clarivate)] to remove duplicates. References were then uploaded to the Covidence systematic review software (Veritas Health Innovation) for further identification of duplicates and the screening process. Each title/abstract imported into Covidence was randomly assigned to 2 independent reviewers for screening, and decision conflicts were addressed by a third reviewer where necessary. Full texts of selected titles/abstracts were retrieved and screened following the same process. Finally, full-text articles deemed eligible were allocated to 2 independent reviewers who each used a predefined extraction table template to collect all relevant data items. Pairs of extracted data were then compared and combined into a single final version for each eligible study. Numerical data items from figures were extracted using the WebPlotDigitizer web-based tool version 4.4 (available at: https://apps.automeris.io/wpd/).
Data items
Outcome data items to be extracted were classified into 5 categories of biomarkers of CMD risk: circulating lipid profiles, markers of inflammation, markers of glycemic control, markers of hemostasis, or metabolic hormone concentrations (Supplemental Table 1). Results from FA profiles in plasma/serum or other blood fractions were not considered in this SLR, because they are mostly reported in dietary fat replacement RCTs to assess compliance to the intervention diets rather than considered as biomarkers of cardiometabolic health. Data from each reported outcome were sought at baseline and at the end of intervention. Because this SLR assessed the effect of chronic dietary fat replacements, only measurements performed on participants in the fasting state were extracted.
In addition, study characteristic details were extracted for each eligible RCT and included country, year of publication, industrial funding source (yes/no), participant information (i.e., biological sex, age, BMI, body weight, health status, medication, physical activity level, smoking habits, occupation, ethnicity), study design (i.e., crossover or parallel), duration of intervention and any run-in or washout periods (d), level of participant feeding control (i.e., full control of all foods consumed, control of intervention foods only, or dietary advice only without any food provided), and composition of intervention diets (type of food, macronutrient composition, energy provided, detailed FA composition). No assumption was made in case of missing data from 1 of the aforementioned variables, and these data were reported as not specified. However, studies were excluded if detailed FA compositions of the intervention diets were not available or could not be expressed as %TE.
Study risk of bias assessment
Risk of bias of included studies was assessed using the Cochrane Risk of Bias Tool 2.0 for parallel or crossover RCTs where appropriate, with the aim to quantify the effect of adhering to the intervention as specified in the study protocol (i.e., “per-protocol”) (14). Briefly, the tool assessed the risk of bias arising from 5 domains: 1) randomization process, 2) deviations from the intended interventions, 3) missing outcome data, 4) measurement of the outcomes, and 5) selection of the reported results. An additional domain was assessed in crossover RCTs for potential risk of bias arising from period and carryover effects. Each domain was attributed a risk of bias score (i.e., low-risk, some concerns, high-risk), which was used to calculate the overall risk of bias score for each included RCT. The overall risk of bias score was judged as “low-risk” if all domains were also judged as low risk, “some concerns” if 1 domain was judged as concerning but no domain was judged as high risk, and “high-risk” if ≥1 domain was judged as high risk or if several domains were scored as concerning in a way that may substantially affect the confidence in the reported results. Risk of bias was first assessed by 1 reviewer and then independently validated by a second reviewer, using full-text articles as the main source of information for the assessments along with secondary publications or the RCT's registered information (e.g., clinicaltrials.gov) where necessary.
Eligibility and preparation for synthesis
Outcomes were selected for synthesis in this SLR if presented in ≥2 of the eligible RCTs. Quantitative meta-analyses were performed separately for every outcome that was reported in ≥3 independent RCTs which conducted similar dietary fat replacements, and if the outcome of interest could be reasonably assumed to follow a normal distribution. In quantitative syntheses, outcome data items at the end of intervention were expressed as means ± SDs in SI units. Missing data items (missing time point, or item not expressed as mean ± SD) were obtained either by contacting the authors of the original full-text articles, or by converting median values, SEs, or IQRs using the methods proposed by Hozo et al. (15). Because the outcomes of interest were all continuous and measured on similar scales across studies, intervention effects were measured as a weighted mean difference (WMD) between 2 dietary interventions. To account for within-participant variance in crossover RCTs as opposed to between-participant variance in parallel trials, we calculated effect measures and their SDs in crossover RCTs using correlation coefficients from 1 of the crossover trials included in the meta-analyses (16) (Supplemental Table 2). Forest plots were generated for each suitable outcome to display results from meta-analyses, grouped by type of dietary fat replacement. Findings ineligible for quantitative meta-analyses were described in qualitative syntheses and tabulated to report details on dietary fat replacements, number of participants, and outcome measurements in each dietary intervention arm.
Statistical analyses
Statistical synthesis
All statistical analyses were conducted in Stata version 16.1 (StataCorp), and P values < 0.05 were considered statistically significant. Studies in sufficient number were pooled using an inverse variance random-effect meta-analysis model to account for potential heterogeneity. The restricted maximum likelihood (REML) method was used to estimate heterogeneity variance. This method is recommended for meta-analyses of continuous outcomes containing a small number of studies (approximately n ≤ 10) as an improvement of the traditional DerSimonian-Laird approach (17, 18). In addition, we used the Hartung-Knapp-Sidik-Jonkman (HKSJ) correction to estimate the 95% CIs of the summary effects (19, 20). This method provides more conservative 95% CIs than the commonly used Wald-type method when pooling a small number of studies (18, 21, 22). Statistical heterogeneity was quantified using the τ2 and I2 values along with Cochran's Q statistic for heterogeneity.
Sensitivity analyses were performed by repeating the meta-analyses without studies for which the confidence in some of the reported results was particularly low, e.g., when reviewers suspected typing errors in values or units reported. This issue was particularly prevalent in articles published between 1980 and 2000 and for which original authors could not be contacted.
Methods to explore heterogeneity and publication bias
In meta-analyses including n ≥ 10 studies, substantial heterogeneity was investigated using meta-regression analyses for the impact of the amount of dietary fat exchanged (per 5%TE) on the observed summary effect, expecting that a larger amount of exchanged dietary fat would lead to greater observed effects. Meta-regression analyses were based on the REML-HKSJ approach and were presented as bubble plots if statistically significant. To comply with Cochrane recommendations on meta-analyses including a small number of studies, no further methods were planned or conducted to explore substantial heterogeneity (23). In meta-analyses including n ≥ 10 studies we investigated potential publication bias using visual inspection of funnel plots and Egger's statistical test (24). Statistically significant Egger's tests were addressed using the trim-and-fill method based on a linear estimator to correct any funnel plot asymmetry (25).
Results
Study selection and characteristics
Figure 1 summarizes the selection process and the included RCTs. We identified 14,050 records, of which 7155 were screened after removal of duplicates. After the exclusion of 6472 records at the first stage of screening based on titles and abstracts, 683 records were assessed in detail using the full-text articles. A total of 639 records were further excluded for not meeting the predefined inclusion criteria, mainly because they did not report sufficient information about the dietary intervention (n = 286); reported ineligible dietary interventions (n = 225), outcomes (n = 7), or study designs (n = 55); or because no English full-text article was available (n = 66). Overall, 44 full-text articles met the inclusion criteria and were included in this SLR (16, 26–68). Among those, 35 articles reporting 34 RCTs were included in quantitative meta-analyses, whereas 9 articles reporting 10 RCTs were included solely in the qualitative synthesis.
FIGURE 1.

Preferred Reporting Items for Systematic Reviews and Meta-Analyses (PRISMA) flow diagram of included RCTs. RCT, randomized controlled trial.
Table 1 presents characteristics of the included RCTs along with details of the dietary interventions. Among the 44 included RCTs, 36 were conducted in a crossover design and 8 in a parallel design. The most common interventions investigated were the dietary substitution of palmitic acid with a mixture of UFAs (n = 20) (26, 27, 29–31, 34, 35, 37, 40, 41, 44–46, 51, 54–58, 67), followed by the replacement of palmitic with oleic acid (18:1n–9) (n = 10) (32, 33, 36, 47, 49–53, 62), the substitution of palmitic with stearic acid (n = 5) (16, 28, 43, 48, 56), and the substitution of stearic acid with a mixture of UFAs (n = 4) (26, 38, 39, 42, 56). The number of participants included in the studies ranged from 6 to 101 (42, 59, 60), and intervention duration varied between 14 and 112 d (26, 42, 64, 67). Most of the RCTs included enrolled both men and women (n = 21), apart from 12 RCTs conducted in men only (32, 41, 42, 46, 51, 52, 54, 56, 57, 64, 65, 68) and 5 RCTs conducted in women only (35, 43, 44, 48, 58). Finally, most RCTs included healthy participants but 10 trials included participants with moderately to highly elevated fasting serum or plasma lipids, although some authors did not specify the cutoff used for fasting lipids (Table 1) (29, 35, 37, 40, 41, 45, 46, 57, 59, 60).
TABLE 1.
Characteristics of 44 eligible RCTs on dietary fat exchange and biomarkers of cardiometabolic diseases1
| Authors (country) | Participants who completed the study, n (% men/women) | Mean age, y; mean BMI, kg/m2 | Participant characteristics | Study design, type of dietary intervention, duration of run-in, intervention, and washout (d) | Dietary intervention arms, n | Reported dietary fat replacements and amount exchanged (%TE) | Outcomes measured | Industrial funding (yes/no) |
|---|---|---|---|---|---|---|---|---|
| RCTs included in meta-analyses (n = 34) | ||||||||
| van Rooijen et al. (16)(Netherlands) | 34 (59/41) | 61.5; 25.4 | Healthy | Crossover, semicontrolled, 28-d intervention, ≥28-d washout | 2 | 16:0 (6.1) ⟷ 18:0 (6.5) | apoA-I, apoB, apoB:apoA-I ratio, C-peptide, CRP, glucose, HDL-C, HOMA-IR, IL-6, insulin, LDL-C, TC:HDL-C ratio, TNF-α, TC, TG | Yes |
| Stonehouse et al. (26)(Australia) | 64 (31/69) | 32.6; 22.8 | Healthy | Parallel, semicontrolled, 14-d run-in, 112-d intervention | 3 | 16:0 (7.3) ⟷ MUFAs + PUFAs (7.2)18:0 (10.6) ⟷ MUFAs + PUFAs (8.3) | apoA-I, apoB, apoB:apoA-I ratio, glucose, HDL-C, LDL-C, leptin, TC, TC:HDL-C ratio, TG | No |
| Sun et al. (27) (China) | 100 (47/53) | 40; 22.2 | Healthy | Crossover, fully controlled, 35-d intervention, 14-d washout | 2 | 16:0 (3.2) ⟷ MUFAs + PUFAs (3.3) | apoA-I, apoB, glucose, HDL-C, HOMA-IR, insulin, LDL-C, TC, TG | No |
| Lv et al. (67) (China) | 88 (47/53) | 21.6; 21.0 | Healthy | Parallel, semicontrolled, 7-d run-in, 112-d intervention | 3 | 16:0 (1.9) ⟷ MUFAs + PUFAs (1.2) | apoA-I, apoB, apoE, CRP, glucose, HDL-C, HOMA-IR, insulin, LDL-C, leptin, Lp(a), NEFAs, TC, TG | No |
| Ng et al. (28) (Malaysia) | 85 (25/75) | 34.4; 26.1 | Healthy | Parallel, fully controlled, 21-d run-in, 56-d intervention | 3 | 16:0 (6.0) ⟷ 18:0 (7.0)16:0 (5.4) ⟷ 18:0 (6.8) | apoA-I, apoB, C-peptide, glucose, HDL-C, HOMA-IR, insulin, LDL-C, leptin, Lp(a), TC, TC:HDL-C ratio, TG | No |
| Karupaiah et al. (29)(Malaysia) | 34 (47/53) | 23.4; 25.1 | Healthy, with normal (n = 21) or mildly elevated (n = 13) TC concentrations | Crossover, fully controlled, 28-d intervention, 14-d washout | 2 | 16:0 (1.8) ⟷ MUFAs + PUFAs (1.5) | apoA-I, apoB, CRP, glucose, HDL-C, LDL-C:HDL-c ratio, NEFA, TC, TG, VLDL-C | Yes |
| Kien et al. (30) (USA) | 18 (50/50) | 29.5; 23.3 | Healthy | Crossover, fully controlled, 21-d intervention, 7-d washout | 2 | 16:0 (13.7) ⟷ MUFAs + PUFAs (13.9) | Adiponectin, apoE, HDL-C, LDL-C, LDL-C:HDL-C ratio, TC, TG | No |
| Rosqvist et al. (31)(Sweden) | 37 (70.3/29.7) | C16:0 diet: 26.7; 20.8; MUFAs + PUFAs diet: 27.1; 19.9 | Healthy | Parallel, semicontrolled, 49-d intervention | 2 | 16:0 (5.2) ⟷ MUFAs + PUFAs (7.5) | Adiponectin, glucose, insulin | No |
| Tholstrup et al. (32)(Denmark) | 32 (100/0) | 29.6; 22.9 | Healthy, n = 6 smokers | Crossover, semicontrolled, 21-d intervention, no washout | 3 | 16:0 (4.6) ⟷ 18:1 (4.8) | CRP, glucose, HDL-C, insulin, LDL-C, PAI-1 activity, TC, TC:HDL-C ratio, TG | No |
| Voon et al. (33)(Malaysia) | 45 (20/80) | 30.1; 23.1 | Healthy | Crossover, fully controlled, 35-d intervention, no washout | 3 | 16:0 (4.9) ⟷ 18:1 (6.8) | apoA-I, apoB, LDL-C, Lp(a), TC, TC:HDL-C ratio, TG | No |
| Teng et al. (34)(Malaysia) | 41 (19.5/80.5) | 28.8; 21.9 | Healthy | Crossover, semicontrolled, 35-d intervention, 7-d washout | 3 | 16:0 (5.2) ⟷ MUFAs + PUFAs (9.4)16:0 (5.8) ⟷ 18:1-trans (9.9) | apoA-I, apoB, CRP, HDL-C, IL-6, LDL-C, TC, TC:HDL-C ratio, TG, TNF-α | No |
| Utarwuthipong et al.(35) (Thailand) | 16 (0/100) | Range: 44–67; <25 | Hyperlipidemic | Crossover, semicontrolled, 70-d intervention, no washout | 4 | 16:0 (1.8) ⟷ MUFAs + PUFAs (17.3)16:0 (5.5) ⟷ MUFAs + PUFAs (21.5) | HDL-C, LDL-C, TC, TG | No |
| 16:0 (2.7) ⟷ MUFAs + PUFAs (18.4) | ||||||||
| 16:0 (3.8) ⟷ 18:2n–6 (4.6) | ||||||||
| 16:0 (2.8) ⟷ 18:2n–6 (3.4) | ||||||||
| Mensink (36)(Netherlands) | 44 (25/75) | 41; 23.9 | Healthy, normolipidemic | Crossover, semicontrolled, 21-d intervention, 7-d washout | 2 | 16:0 (4.2) ⟷ 18:1 (2.9) | CRP, glucose, HDL-C, LDL-C, TC, TC:HDL-C ratio | Yes |
| Vega-López et al. (37)(USA) | 15 (33/66) | 63.9; 26 | Elevated LDL-C (>3.36 mmol/L) | Crossover, fully controlled, 35-d intervention, no washout | 4 | 16:0 (7.5) ⟷ MUFAs + PUFAs (6.2)16:0 (8.3) ⟷ MUFAs + PUFAs (9.7) | apoA-I, apoA-II, apoB, glucose, HDL-C, HDL2-C, HDL3-C, HOMA-IR, insulin, LDL-C, Lp(a), TC, TC:HDL-C ratio, TG, VLDL-C | No |
| Thijssen et al. (38, 39)(Netherlands) | 45 (60/40) | 51; 24.9 | Healthy, normolipidemic | Crossover, semicontrolled, 35-d intervention, 7-d washout | 3 | 18:0 (19.7) ⟷ MUFAs + PUFAs (20.2)18:0 (19.6) ⟷ MUFAs + PUFAs (20.0) | apoA-I, apoB, fibrinogen, HDL-C, LDL-C, PAI-1 activity, TC, TC:HDL-C ratio, TG | Yes |
| Gill et al. (40)(United Kingdom) | 35 (49/51) | 55; 26.3 | Mildly hypercholesterolemic | Crossover, semicontrolled, 42-d intervention, 56-d washout | 3 | 16:0 (3.0) ⟷ MUFAs + PUFAs (3.6)16:0 (6.1) ⟷ MUFAs (6.6)16:0 (3.1) ⟷ MUFAs (3.0) | apoA-I, apoB, CRP, HDL-C, insulin, LDL-C, Lp(a), NEFAs, TC, TG, VLDL-C | No |
| Cater and Denke (41)(USA) | 7 (100/0) | 66; 27 | Mildly hypercholesterolemic, n = 3 subjects with history of CAD | Crossover, fully controlled, 21-d intervention, 7-d washout | 3 | 16:0 (19.3) ⟷ MUFAs + PUFAs (21.2)>18:0 (17.0) ⟷ MUFAs + PUFAs (19.0) | HDL-C, LDL-C, TC, TG, VLDL-C | No |
| Hunter et al. (42)(United Kingdom) | 6 (100/0) | 28; 24.7 | Healthy | Crossover, fully controlled, 14-d intervention, 35-d washout | 3 | 18:0 (10.7) ⟷ 18:1 (11.1)18:0 (10.7) ⟷ MUFAs + PUFAs (10.3) | Fibrinogen, HDL-C, LDL-C, PAI-1 activity, TC, TG, tPA activity | No |
| Snook et al. (43) (USA) | 16 (0/100) | 28; NS | Healthy | Crossover, fully controlled, 35-d intervention, 49-d washout | 3 | 16:0 (10.0) ⟷ 18:0 (10.8) | apoA-I, apoB, HDL-C, HDL2-C, HDL3-C, LDL-C, TC, TG | No |
| Müller et al. (44)(Norway) | 27 (0/100) | 27; 26.5 | Healthy | Crossover, fully controlled, 17-d intervention, 7-d washout | 3 | 16:0 (5.5) ⟷ MUFAs + PUFAs (4.5)Total trans (6.8) ⟷ MUFAs + PUFAs (5.6) | apoA-I, apoB, HDL-C, LDL-C, LDL-C:HDL-C ratio, Lp(a), TC, TG | Yes |
| Schwab et al. (45)(Finland) | 14 (42.9/57.1) | 63; 27.2 | Elevated LDL-C (>3.36 mmol/L) | Crossover, fully controlled, 32-d intervention, no washout | 5 | 16:0 (2.0) ⟷ MUFAs + PUFAs (1.6) | HDL-C, LDL-C, TC, TC:HDL-C, VLDL-C | No |
| Cater et al. (46) (USA) | 9 (100/0) | 66; 27 | Mildly hypercholesterolemic, n = 3 subjects with history of CAD | Crossover, fully controlled, 21-d intervention, 7-d washout | 3 | 16:0 (19.3) ⟷ MUFAs + PUFAs (21.3) | HDL-C, LDL-C, TC, TG, VLDL-C | No |
| Sundram et al. (47)(Malaysia) | 27 (66/33) | 29.4; 22.7 | Healthy | Crossover, semicontrolled, 28-d intervention, no washout | 4 | 16:0 (4.1) ⟷ 18:1 (2.7) | apoA-I, apoB, apoB:apoA-I ratio, HDL-C, LDL-C, LDL-C:HDL-C ratio, Lp(a), TC, TG, VLDL-C | No |
| Schwab et al. (48)(USA) | 12 (0/100) | 23.5; 22.1 | Healthy, n = 6 using oral contraceptives | Crossover, semicontrolled, 28-d intervention, 14-d washout | 2 | 16:0 (3.3) ⟷ 18:0 (4.9) | apoA-I, apoB, HDL-C, HDL-TG, LDL-C, LDL-TG, TC, TG, VLDL-C, VLDL-TG | No |
| Temme et al. (49)(Netherlands) | 32 (43.7/56.3) | 41; 25 | Healthy, n = 9 smokers, n = 2 using oral contraceptives | Crossover, semicontrolled, 42-d intervention, 14- to 21-d washout | 3 | 16:0 (7.5) ⟷ 18:1 (8.4) | apoA-I, apoA-I:apoB ratio, apoB, HDL-C, HDL-C:LDL-C ratio, LDL-C, Lp(a), TC, TG | Yes |
| Choudhury et al. (50)(Australia) | 21 (48/52) | 27.8; 24.1 | Healthy | Crossover, semicontrolled, 30-d intervention, no washout | 2 | 16:0 (5.0) ⟷ 18:1 (7.3) | HDL-C, LDL-C, TC, TG | No |
| Sundram et al. (51)(Malaysia) | 23 (100/0) | 21; 20.1 | Healthy | Crossover, fully controlled, 21-d intervention, no washout | 3 | 16:0 (4.3) ⟷ 18:1 (5.1)16:0 (3.0) ⟷ MUFAs + PUFAs (6.8)16:0 (7.3) ⟷ MUFAs + PUFAs (6.8) | apoA-I, apoB, apoB:apoA-I ratio, HDL-C, HDL2-C, HDL3-C, LDL-C, LDL-C:HDL-C ratio, Lp(a), TC, TG, VLDL-C | NS |
| Nestel et al. (52)(Australia) | 34 (100/0) | 49; 25.7 | Healthy | Crossover, semicontrolled, 21-d intervention, no washout | 3 | 16:0 (3.3) ⟷ 16:1 (3.8)16:0 (3.4) ⟷ 18:1 (2.7) | HDL-C, LDL-C, TC, TG | Yes |
| Zock et al. (53)(Netherlands) | 59 (39/61) | Men: 28; 22.3Women: 29; 22.4 | Healthy, n = 8 smokers | Crossover, fully controlled, 21-d intervention, no washout | 3 | 14:0 (10.2) ⟷ 16:0 (10.2)14:0 (10.5) ⟷ 18:1 (10.0) | apoA-I, apoB, HDL-C, HDL-C:LDL-C ratio, LDL-C, TC, TG | No |
| 16:0 (9.9) ⟷ 18:1 (9.3) | ||||||||
| Denke and Grundy(54) (USA) | 14 (100/0) | 63; 25.5 | n = 5 subjects with history of CAD, n = 7 smokers | Crossover, fully controlled, 21-d intervention, 7-d washout | 3 | 12:0 (17.5) ⟷ MUFAs + PUFAs (16.3)16:0 (15.5) ⟷ MUFAs + PUFAs (16.6) | HDL-C, TC, TG, VLDL-C | No |
| Ng et al. (55) (Malaysia) | 27 (74/26) | 23.9; 19.5 | Healthy, normolipidemic | Crossover, fully controlled, 35-d intervention, no washout | 2 | 16:0 (4.9) ⟷ MUFAs + PUFAs (4.8) | HDL-C, LDL-C, LDL-C:HDL-C ratio, TC, TG | No |
| Bonanome andGrundy (56) (USA) | 11 (100/0) | 64; 24 | n = 4 subjects with a history of CAD using antihypertensive medication and nitroglycerine | Crossover, fully controlled, 21-d intervention, no washout | 3 | 16:0 (14.8) ⟷ 18:0 (15.3)16:0 (15.8) ⟷ MUFAs + PUFAs (17.4)18:0 (16.3) ⟷ MUFAs + PUFAs (17.7) | HDL-C, LDL-C, LDL-C:HDL-C ratio, TC, TG, VLDL-C | NS |
| Mattson and Grundy(57) (USA) | 20 (100/0) | 58.7; NS | Healthy, with normal or elevated TC and TG concentrations | Crossover, fully controlled, 28-d intervention, no washout | 3 | 16:0 (15.3) ⟷ MUFAs + PUFAs (15.2)16:0 (14.8) ⟷ MUFAs + PUFAs (15.2) | HDL-C, LDL-C, TC, TG, VLDL-C | No |
| Baudet et al. (58)(France) | 24 (0/100) | 46; NS | Healthy | Crossover, fully controlled, 35-d intervention, no washout | 4 | 16:0 (3.1) ⟷ MUFAs + PUFAs (2.8)16:0 (2.1) ⟷ MUFAs + PUFAs (0.7) | TC, TG | Yes |
| RCTs included in qualitative synthesis only (n = 10) | ||||||||
| Liu et al. (59) (China) | 101 (66/34) | 53.7; 25.9 | Hypertriglyceridemic | Parallel, semicontrolled, 56-d intervention | 2 | Men: <12:0 (1.8) ⟷ 18:2n–6 (1.7)Women: <12:0 (1.9) ⟷ 18:2n–6 (1.6) | apoA-I, apoB, apoE, glucose, HDL-C, LDL-C, TC, TG | Yes |
| Xue et al. (60) (China) | 101 (66/34) | 53.7; 25.9 | Hypertriglyceridemic | Parallel, semicontrolled, 56-d intervention | 2 | <12:0 (1.8) ⟷ MUFAs + PUFAs (1.3) | Adiponectin, apoA-I, apoA-II, apoB, glucose, HDL-C, LDL-C, TC, TG | NS |
| Nosaka et al. (61)(Japan) | 64 (75/25) | 37.6; 25 | Healthy | Parallel, semicontrolled, 84-d intervention | 2 | <12:0 (3.0) ⟷ 18:1 (1.6) | Glucose, HDL-C, HDL-TG, LDL-C, LDL-TG, TC, TG, VLDL-C, VLDL-TG | NS |
| Judd et al. (68) (USA) | 50 (100/0) | 42; 26.2 | Healthy, smokers and nonsmokers | Crossover, fully controlled, 35-d intervention, no washout | 6 | 18:0 (8.0) ⟷ 18:1 (7.1)18:0 (4.1) ⟷ total trans (4.1)18:0 (8.1) ⟷ total trans (8.0) | apoA-I, apoB, HDL-C, HDL2-C, HDL3-C, TC, TC:HDL-C ratio, TG | Yes |
| 18:0 (4.0) ⟷ total trans (3.9) | ||||||||
| Temme et al. (62)(Netherlands) | 32 (43.8/56.2) | Men: 43; 25Women: 40; 25 | Healthy, normolipidemic, n = 9 smokers | Crossover, semicontrolled, 42-d intervention, 14- to 21-d washout | 3 | 16:0 (6.1) ⟷ 18:1 (6.8) | Fibrinogen, PAI-1 activity | Yes |
| Temme et al. (63)(Netherlands) | 60 (38/62) | Men: 43; 25Women: 40; 24 | Healthy, n = 11 smokers, n = 10 using oral contraceptives | Parallel, semicontrolled, 42-d intervention | 3 | <12:0 (9.9) ⟷ 18:1 (10.1)<12:0 (9.9) ⟷ 14:0 (9.7)14:0 (9.6) ⟷ 18:1 (10.4) | apoA-I, apoA-I:apoB ratio, apoB, HDL-C, Lp(a), TC, TC:HDL-C ratio, TG | Yes |
| Ghafoorunissa et al.(64) (India) | 12 (100/0) | 35; 21 | Healthy | Crossover, fully controlled, 56-d intervention, 42-d washout | 2 | 16:0 (5.0) ⟷ 18:2n–6 (3.7) | HDL-C, LDL-C, TC, TG, VLDL-C | No |
| 24 (50/50) | Men: 43; 23Women: 38; 24 | Healthy | Crossover, semicontrolled, 112-d intervention, no washout | 2 | 16:0 (6.0) ⟷ 18:2n-6 (3.7) | HDL-C, LDL-C, TC, TG, VLDL-C | No | |
| Tholstrup et al. (65)(Denmark) | 12 (100/0) | 23.8; 23.5 | Healthy | Crossover, fully controlled, 21-d intervention, 35-d washout | 3 | 14:0 (13.4) ⟷ 16:0 (12.8) | apoA-I, apoB, fibrinogen, HDL-C, HDL2-C, HDL3-C, LDL-C, LDL-C:HDL-C ratio, TC, TG, tPA activity, VLDL-C | No |
| Zock and Katan (66)(Netherlands) | 62 (50/50) | 24.5; NS | Healthy, normolipidemic, n = 8 smokers | Crossover, fully controlled, 21-d intervention, no washout | 3 | 18:0 (9.0) ⟷ 18:2n–6 (8.1) | apoA-I, apoA-I:apoB ratio, apoB, HDL-C, HDL-C:LDL-C ratio, LDL-C, TC, TG | NS |
| Total trans (7.6) ⟷ MUFAs + PUFAs (7.5) | ||||||||
Fully controlled intervention: all foods consumed were provided to participants, for either home or on-site consumption (on campus, metabolic ward, etc.). Semicontrolled intervention: experimental foods were provided to participants along with dietary advice for nonexperimental foods. Fatty acids considered: lauric acid (12:0), myristic acid (14:0), palmitic acid (16:0), stearic acid (18:0), palmitoleic acid (16:1n–7), oleic acid (18:1n–9), linoleic acid (18:2n–6), α-linolenic acid (18:2n–3). CAD, coronary artery disease; CRP, C-reactive protein; HDL-C, HDL cholesterol; HDL2-C, HDL2 cholesterol; HDL3-C, HDL3 cholesterol; LDL-C, LDL cholesterol; Lp(a), lipoprotein (a); NEFA, nonesterified fatty acid; NS, not specified; PAI-1, plasminogen activator inhibitor-1; RCT, randomized controlled trial; TC, total cholesterol; TG, triacylglycerol; tPA, tissue plasminogen activator; VLDL-C, VLDL cholesterol; %TE, percent total energy.
Risk of bias assessment
Table 2 presents results from the risk of bias assessment of the included RCTs. Thirteen of the 44 RCTs were judged as “low risk of bias” and 18 presented “some concerns.” Furthermore, 13 crossover RCTs were judged as “high risk of bias,” mostly due to insufficient washout periods between dietary interventions in comparison with the duration of intervention. Indeed, when assessing the risk of carryover effects between interventions, washout periods ≥14 d were deemed acceptable regardless of the duration of interventions, and shorter washout periods were judged acceptable only when combined with interventions of ≥28 d to ensure ≥14 d of dietary intervention with minimal risks of carryover effects.
TABLE 2.
Risk of bias assessment of 44 eligible RCTs on dietary fat exchange and biomarkers of cardiometabolic diseases, from the Cochrane Risk of Bias 2.0 tool for parallel or crossover RCTs (14)
| Authors | Year | Journal | Randomization process | Deviations from the intended intervention | Missing outcome data | Measurement of the outcome | Selection of the reported result | Overall risk of bias |
|---|---|---|---|---|---|---|---|---|
| RCTs included in meta-analyses (n = 34) | ||||||||
| van Rooijen et al. (16) | 2020 | Clin Nutr | Low | Low | Low | Low | Low | Low |
| Stonehouse et al. (26) | 2020 | Am J Clin Nutr | Low | Low | Low | Low | Low | Low |
| Sun et al. (27) | 2019 | Asia Pac J Clin Nutr | Some concerns | Low | Low | Low | Low | Some concerns |
| Lv et al. (67) | 2018 | Food Nutr Res | Some concerns | Low | Low | Low | Low | Some concerns |
| Ng et al. (28) | 2018 | Nutrients | Low | Low | Low | Low | Low | Low |
| Karupaiah et al. (29) | 2016 | Lipids Health Dis | Low | Low | Low | Low | Low | Low |
| Kien et al. (30) | 2014 | Am J Clin Nutr | Low | High | Low | Low | Low | High |
| Rosqvist et al. (31) | 2014 | Diabetes | Low | Low | Low | Low | Low | Low |
| Tholstrup et al. (32) | 2011 | Am J Clin Nutr | Low | High | Some concerns | Low | Low | High |
| Voon et al. (33) | 2011 | Am J Clin Nutr | Some concerns | Low | Low | Low | Low | Some concerns |
| Teng et al. (34) | 2010 | Lipids | Low | High | Low | Low | Low | High |
| Utarwuthipong et al. (35) | 2009 | Int J Med Sci | Some concerns | Low | Low | Low | Low | Some concerns |
| Mensink (36) | 2008 | Eur J Clin Nutr | Low | Low | Low | Low | Low | Low |
| Vega-López et al. (37) | 2006 | Am J Clin Nutr | Low | Low | Low | Low | Low | Low |
| Thijssen et al. (38, 39) | 2005 | Nutr Metab/Am J Clin Nutr | Some concerns | High | Low | Low | Low | High |
| Gill et al. (40) | 2003 | Am J Clin Nutr | Some concerns | Low | Low | Low | Low | Some concerns |
| Cater and Denke (41) | 2001 | Am J Clin Nutr | Low | High | Low | Low | Low | High |
| Hunter et al. (42) | 2000 | J Nutr Biochem | Some concerns | Low | Low | Low | Low | Some concerns |
| Snook et al. (43) | 1999 | Eur J Clin Nutr | Some concerns | Low | Low | Low | Low | Some concerns |
| Müller et al. (44) | 1998 | Lipids | Low | High | Low | Low | Low | High |
| Schwab et al. (45) | 1998 | Nutr Metab | Some concerns | Some concerns | Low | Low | Low | Some concerns |
| Cater et al. (46) | 1997 | Am J Clin Nutr | Low | High | Low | Low | Low | High |
| Sundram et al. (47) | 1997 | J Nutr | Low | Low | Low | Low | Low | Low |
| Schwab et al. (48) | 1996 | Metab Clin Exp | Low | Low | Low | Low | Low | Low |
| Temme et al. (49) | 1996 | Am J Clin Nutr | Some concerns | Some concerns | Low | Low | Low | Some concerns |
| Choudhury et al. (50) | 1995 | Am J Clin Nutr | Low | Low | Low | Low | Low | Low |
| Sundram et al. (51) | 1995 | J Nutr Biochem | Some concerns | High | Low | Low | Low | High |
| Nestel et al. (52) | 1994 | J Lipid Res | Low | High | Low | Low | Low | High |
| Zock et al. (53) | 1994 | Arterioscler Thromb | Some concerns | High | Low | Low | Low | High |
| Denke and Grundy (54) | 1992 | Am J Clin Nutr | Some concerns | High | Low | Low | Low | High |
| Ng et al. (55) | 1991 | Am J Clin Nutr | Some concerns | Low | Low | Low | Low | Some concerns |
| Bonanome and Grundy (56) | 1988 | N Engl J Med | Some concerns | High | Low | Low | Low | High |
| Mattson and Grundy (57) | 1985 | J Lipid Res | Some concerns | Low | Low | Low | Some concerns | Some concerns |
| Baudet et al. (58) | 1984 | J Lipid Res | Some concerns | Some concerns | Low | Low | Some concerns | Some concerns |
| RCTs included in qualitative synthesis only (n = 10) | ||||||||
| Liu et al. (59) | 2009 | Asia Pac J Clin Nutr | Low | Low | Low | Low | Low | Low |
| Xue et al. (60) | 2009 | Eur J Clin Nutr | Low | Low | Low | Low | Low | Low |
| Nosaka et al. (61) | 2003 | J Atheroscler Thromb | Some concerns | Low | Low | Low | Some concerns | Some concerns |
| Judd et al. (68) | 2002 | Lipids | Low | Low | Low | Low | Low | Low |
| Temme et al. (62) | 1999 | Thromb Haemost | Some concerns | Some concerns | Low | Low | Low | Some concerns |
| Temme et al. (63) | 1997 | J Lipid Res | Some concerns | Low | Low | Low | Low | Some concerns |
| Ghafoorunissa et al. (64) | 1995 | Lipids | Some concerns | Low | Low | Low | Low | Some concerns |
| Some concerns | Low | Low | Low | Low | Some concerns | |||
| Tholstrup et al. (65) | 1994 | Am J Clin Nutr | Some concerns | Low | Low | Low | Low | Some concerns |
| Zock and Katan (66) | 1992 | J Lipid Res | Some concerns | High | Low | Low | Low | High |
1RCT, randomized controlled trial.
Effect of dietary fat replacement on fasting lipid profiles
TC and LDL cholesterol
As shown in Figures 2 and 3, quantitative syntheses revealed no statistically significant effects on TC or LDL cholesterol of the dietary replacements of palmitic with stearic acid (WMD: −0.34 mmol/L; 95% CI: –0.72, 0.04 mmol/L; I2 = 87.2%, n = 5 RCTs, and WMD: −0.28mmol/L; 95% CI: −0.71, 0.15 mmol/L;i2 = 94.0%, n = 5 RCTs,respectively) or stearic acid with a mixture of UFAs (WMD: 0.03 mmol/L; 95% CI: −0.20, 0.27 mmol/L; I2 = 75.0%, n = 4 RCTs, and WMD: −0.01 mmol/L; 95% CI: −0.34, 0.31mmol/L;I2 = 85.0%, n = 4 RCTs,respectively). However, statistically significant decreases in TC and LDL-cholesterol concentrations, albeit with evidence of high heterogeneity, were observed when exchanging dietary palmitic acid with either oleic acid (TC: WMD: −0.21 mmol/L; 95% CI: −0.33, −0.10 mmol/L; I2 = 87.2%, n = 9 RCTs, and LDL cholesterol: WMD: −0.16 mmol/L; 95% CI: −0.28, −0.03 mmol/L;i2 = 89.6%, n = 9 RCTs) or a mixture of UFAs (TC: WMD: −0.41 mmol/L; 95% CI: −0.55, −0.26 mmol/L; I2 = 93.1%, n = 19 RCTs, and LDL cholesterol: WMD: −0.36 mmol/L; 95% CI: −0.50, −0.21 mmol/L;i2 = 96%, n = 18 RCTs). The latter effect on TC and LDL cholesterol was dependent on the amount of dietary palmitic acid replaced with UFAs according to meta-regression analyses, with each additional 5%TE of palmitic acid exchanged associated with a 0.12- and 0.17-mmol/L decrease in fasting TC (P value = 0.03) (Figure 4A) and LDL-cholesterol(p value = 0.001) (Figure 4B)concentrations, respectively. Sensitivity analyses on the effect of replacing dietary palmitic with oleic acid, which excluded 2 RCTs with potential reporting errors in the full-text articles, showed similar effects on TC and LDL-cholesterol concentrations (Supplemental Figures 1, 2).
FIGURE 2.

Forest plot of the effect of dietary fat substitutions on TC in randomized controlled trials. HKSJ, Hartung-Knapp-Sidik-Jonkman; REML, restricted maximum likelihood; TC, total cholesterol.
FIGURE 3.

Forest plot of the effect of dietary fat substitutions on LDL-C in randomized controlled trials. HKSJ, Hartung-Knapp-Sidik-Jonkman; LDL-C, LDL cholesterol; REML, restricted maximum likelihood.
FIGURE 4.
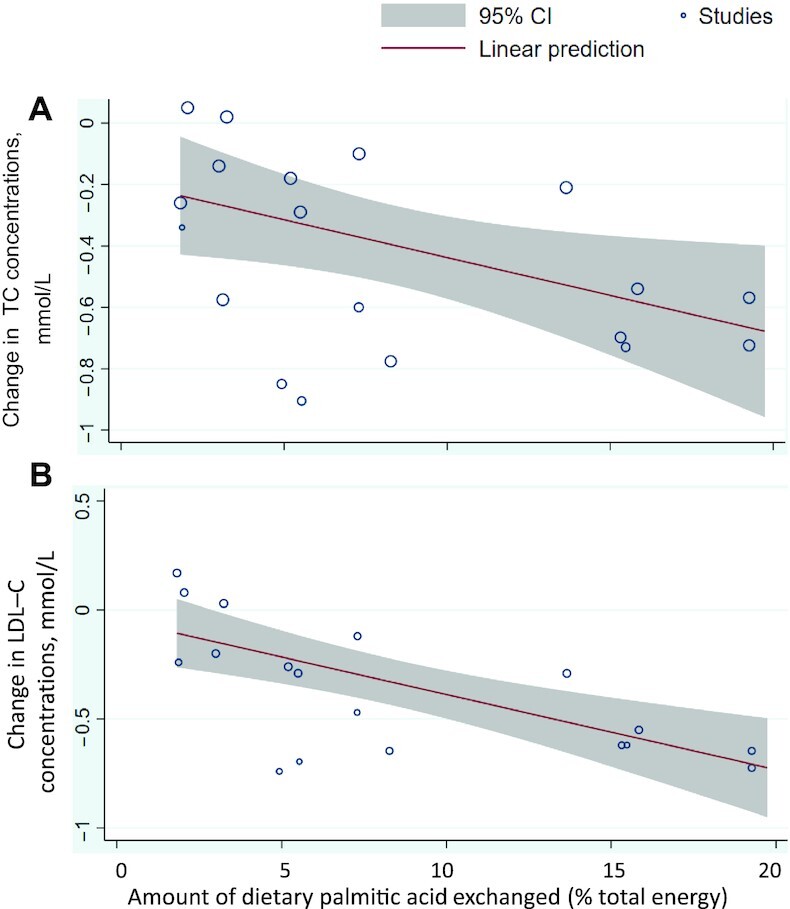
Dose-response meta-regression analysis of the change in (A) TC or (B) LDL-C concentration according to the amount of dietary palmitic acid exchanged with unsaturated fat (MUFAs + PUFAs). LDL-C, LDL cholesterol; TC, total cholesterol.
The impact of other dietary fat substitutions on TC and LDL-cholesterol concentrations was investigated in 18 RCTs (34, 35, 40–42, 44, 51-54, 59–61, 63–66, 68) (Table 3). In particular, findings from 4 RCTs suggested that the dietary replacement of medium-chain SFAs with UFAs may not have any impact on TC concentrations (59–61, 63). However, decreased TC and LDL-cholesterol concentrations were reported after replacing dietary myristic acid with either palmitic (53, 65) or oleic acid (53, 63). Furthermore, 3 RCTs reported decreased or unchanged TC concentrations in response to a replacement of dietary stearic with oleic or linoleic acid (18:2n–6) (42, 66, 68). Finally, 2 crossover RCTs observed beneficial effects of exchanging 6.8–7.6%TE dietary trans-FAs with a mixture of UFAs on TC and LDL-cholesterol concentrations (44, 66).
TABLE 3.
Qualitative synthesis of dietary FA exchanges and measured outcomes from eligible randomized controlled trials which were not eligible for quantitative meta-analyses1
| Type and amount of dietary FA exchanged (%TE) | Changes in outcomes in the intervention diet compared with control2 | |||
|---|---|---|---|---|
| Authors | Control diet | Intervention diet | Outcomes measured and not pooled | |
| van Rooijen et al. (16) | 16:0 (6.1) | 18:0 (6.5) | apoB:apoA-I ratio, C-peptide, CRP, glucose, HOMA-IR, IL-6, insulin, TC:HDL-C ratio, TNF-α | ↑ apoB:apoA-I ratio, HOMA-IR (women only), IL-6, insulin (women only), TC:HDL-C ratio, TNF-α; ↓ C-peptide (men only) |
| Stonehouse et al. (26) | 16:0 (7.3) | MUFAs + PUFAs (7.2) | apoB:apoA-I ratio, leptin | NSD |
| 18:0 (10.6) | MUFAs + PUFAs (8.3) | apoA-I, apoB, apoB:apoA-I ratio, glucose, leptin, TC:HDL-C ratio | NSD | |
| Sun et al. (27) | 16:0 (3.2) | MUFAs + PUFAs (3.3) | HOMA-IR | NSD |
| Lv et al. (67) | 16:0 (1.9) | MUFAs + PUFAs (1.2) | apoE, HOMA-IR, leptin, Lp(a) | NSD |
| Ng et al. (28) | 16:0 (6.0) | 18:0 (7.0) | C-peptide, glucose, leptin, Lp(a), TC:HDL-C ratio, HOMA-IR, insulin | NSD |
| 16:0 (5.4) | 18:0 (6.8) | C-peptide, glucose, leptin, Lp(a), TC:HDL-C ratio, HOMA-IR, insulin | NSD | |
| Karupaiah et al. (29) | 16:0 (1.8) | MUFAs + PUFAs (1.5) | N/A | NSD |
| Kien et al. (30) | 16:0 (13.7) | MUFAs + PUFAs (13.9) | Adiponectin | NSD |
| Rosqvist et al. (31) | 16:0 (5.2) | MUFAs + PUFAs (7.5) | Adiponectin | NSD |
| Tholstrup et al. (32) | 16:0 (4.6) | 18:1 (4.8) | CRP, glucose, insulin, PAI-1 activity | NSD |
| Voon et al. (33) | 16:0 (4.9) | 18:1 (6.8) | Lp(a) | NSD |
| Teng et al. (34) | 16:0 (5.2) | MUFAs + PUFAs (9.4) | IL-6, TNF-α | NSD |
| 16:0 (5.8) | 18:1-trans (9.9) | apoA-I, apoB, CRP, IL-6, TC, TC:HDL-C ratio, TG, TNF-α, LDL-C, HDL-C | ↑ CRP, TC:HDL-C ratio; ↓ HDL-C | |
| Utarwuthipong et al. (35) | 16:0 (1.8) | MUFAs + PUFAs (17.3) | HDL-C, LDL-C, TC, TG | ↓ HDL-C |
| 16:0 (5.5) | MUFAs + PUFAs (21.5) | N/A | NSD | |
| 16:0 (2.7) | MUFAs + PUFAs (18.4) | HDL-C, LDL-C, TC, TG | ↓ HDL-C | |
| 16:0 (3.8) | 18:2n–6 (4.6) | HDL-C, LDL-C, TC, TG | ↓ LDL-C, TC | |
| 16:0 (2.8) | 18:2n–6 (3.4) | HDL-C, LDL-C, TC, TG | ↓ LDL-C, TC | |
| Mensink (36) | 16:0 (4.2) | 18:1 (2.9) | CRP, glucose | NSD |
| Vega-López et al. (37) | 16:0 (7.5) | MUFAs + PUFAs (6.2) | apoA-II, HDL2-C, HDL3-C, HOMA-IR, Lp(a) | ↓ HDL3-C |
| 16:0 (8.3) | MUFAs + PUFAs (9.7) | NSD | ||
| Thijssen et al. (38, 39) | 18:0 (19.7) | MUFAs + PUFAs (20.2) | apoA-I, apoB, fibrinogen, PAI-1 activity, TC:HDL-C ratio | NSD |
| 18:0 (19.7) | MUFAs + PUFAs (20.0) | NSD | ||
| Gill et al. (40) | 16:0 (3.0) | MUFAs + PUFAs (3.6) | Lp(a) | NSD |
| 16:0 (6.1) | MUFAs (6.6) | apoA-I, apoB, CRP, HDL-C, insulin, LDL-C, Lp(a), NEFA, TC, TG, VLDL-C | ↑ insulin; ↓ apoB, LDL-C, TC | |
| 16:0 (3.1) | MUFAs (3.0) | ↑ insulin; ↓ apoB, LDL-C, TC | ||
| Cater and Denke (41) | 16:0 (19.3) | MUFAs + PUFAs (21.2) | N/A | NSD |
| >18:0 (17.0) | MUFAs + PUFAs (19.0) | HDL-C, LDL-C, TC, TG, VLDL-C | ↓ LDL-C, TC | |
| Hunter et al. (42) | 18:0 (10.7) | 18:1 (11.1) | Fibrinogen, HDL-C, LDL-C, PAI-1 activity, TC, TG, tPA activity | NSD |
| 18:0 (10.7) | MUFAs + PUFAs (10.3) | Fibrinogen, PAI-1 activity, tPA activity | NSD | |
| Snook et al. (43) | 16:0 (10.0) | 18:0 (10.8) | HDL2-C, HDL3-C | NSD |
| Müller et al. (44) | 16:0 (5.5) | MUFAs + PUFAs (4.5) | Lp(a) | NSD |
| Total trans (6.8) | MUFAs + PUFAs (5.6) | apoA-I, apoB, HDL-C, LDL-C, LDL-C:HDL-C ratio, Lp(a), TC, TG | ↑ HDL-C; ↓ apoB, LDL-C, LDL-C:HDL-C ratio, TC | |
| Schwab et al. (45) | 16:0 (2.0) | MUFAs + PUFAs (1.6) | N/A | NSD |
| Cater et al. (46) | 16:0 (19.3) | MUFAs + PUFAs (21.3) | N/A | NSD |
| Sundram et al. (47) | 16:0 (4.1) | 18:1 (2.7) | apoB:apoA-I ratio, LDL-C:HDL-C ratio, Lp(a), VLDL-C | ↓ VLDL-C |
| Schwab et al. (48) | 16:0 (3.3) | 18:0 (4.9) | HDL-TG, LDL-TG, VLDL-C, VLDL-TG | NSD |
| Temme et al. (49) | 16:0 (7.5) | 18:1 (8.4) | apoA-I:apoB ratio, HDL-C:LDL-C ratio, Lp(a) | NSD |
| Choudhury et al. (50) | 16:0 (5.0) | 18:1 (7.3) | N/A | NSD |
| Sundram et al. (51) | 16:0 (4.3) | 18:1 (5.1) | apoB:apoA-I ratio, HDL2-C, HDL3-C, LDL-C:HDL-C ratio, Lp(a), VLDL-C | ↑ LDL-C:HDL-C ratio; ↓ HDL-C |
| 16:0 (3.0) | MUFAs + PUFAs (6.8) | apoA-I, apoB, apoB:apoA-I ratio, HDL-C, HDL2-C, HDL3-C, LDL-C, LDL-C:HDL-C ratio, Lp(a), TC, TG, VLDL-C | ↓ LDL-C:HDL-C ratio | |
| 16:0 (7.3) | MUFAs + PUFAs (6.8) | apoB:apoA-I ratio, HDL2-C, HDL3-C, Lp(a) | NSD | |
| Nestel et al. (52) | 16:0 (3.3) | 16:1 (3.8) | HDL-C, LDL-C, TC, TG | ↓ HDL-C |
| 16:0 (3.4) | 18:1 (2.7) | N/A | NSD | |
| Zock et al. (53) | 14:0 (10.2) | 16:0 (10.2) | apoA-I, apoB, HDL-C, HDL-C:LDL-C ratio, LDL-C, TC, TG | ↓ apoA-I, HDL-C, HDL-C:LDL-C ratio, LDL-C, TC |
| 14:0 (10.5) | 18:1 (10.0) | ↑ HDL-C:LDL-C ratio; ↓ apoA-I, apoB, HDL-C, LDL-C, TC | ||
| 16:0 (9.9) | 18:1 (9.3) | HDL-C:LDL-C ratio | ↑ HDL-C:LDL-C ratio | |
| Denke and Grundy (54) | 12:0 (17.5) | MUFAs + PUFAs (16.3) | HDL-C, LDL-C, TC, TG, VLDL-C | ↓ LDL-C, TC |
| 16:0 (15.5) | MUFA + PUFA (16.6) | N/A | NSD | |
| Ng et al. (55) | 16:0 (4.9) | MUFAs + PUFAs (4.8) | N/A | NSD |
| Bonanome and Grundy (56) | 16:0 (14.8) | 18:0 (15.3) | LDL-C:HDL-C ratio, VLDL-C | ↓ LDL-C:HDL-C ratio |
| 16:0 (15.8) | MUFAs + PUFAs (17.4) | N/A | NSD | |
| 18:0 (16.3) | MUFAs + PUFAs (17.7) | LDL-C:HDL-C ratio, VLDL-C | NSD | |
| Mattson and Grundy (57) | 16:0 (15.3) | MUFAs + PUFAs (15.2) | N/A | NSD |
| 16:0 (14.8) | MUFAs + PUFAs (15.2) | N/A | NSD | |
| Baudet et al. (58) | 16:0 (3.1) | MUFAs + PUFAs (2.8) | N/A | NSD |
| 16:0 (2.1) | MUFAs + PUFAs (0.7) | N/A | NSD | |
| Liu et al. (59) | Men: <12:0 (1.81)Women: <12:0 (1.87) | Men: 18:2n–6 (1.69)Women: 18:2n–6 (1.59) | apoA-I, apoB, apoE, glucose, HDL-C, LDL-C, TC, TG | Observed in men only: ↑ TG, apoE; ↓ apoB, LDL-C |
| Xue et al. (60) | <12:0 (1.8) | MUFAs + PUFAs (1.3) | Adiponectin, apoA-I, apoA-II, apoB, apoE, glucose, HDL-C, LDL-C, TC, TG | ↑ apoA-II, apoB, LDL-C, TG |
| Nosaka et al. (61) | <12:0 (3.0) | 18:1 (1.6) | glucose, HDL-C, HDL-TG, LDL-C, LDL-TG, TC, TG, VLDL-C, VLDL-TG | ↑ VLDL-C |
| Judd et al. (68) | 18:0 (8.0) | 18:1 (7.1) | apoA-I, apoB, HDL-C, HDL2-C, HDL3-C, LDL-C, TC, TC:HDL-C ratio, TG | ↑ apoA-I, HDL-C, HDL3-C; ↓ LDL-C, TC, TC:HDL-C ratio, TG |
| 18:0 (4.1) | Total trans (4.1) | NSD | ||
| 18:0 (8.1) | Total trans (8.0) | ↑ LDL-C, TC, TC:HDL-C ratio; ↓ apoB | ||
| 18:0 (4.0) | Total trans (3.9) | ↑ apoB, LDL-C, TC | ||
| Temme et al. (62) | 16:0 (6.1) | 18:1 (6.8) | Fibrinogen, PAI-1 activity | ↓ PAI-1 activity |
| Temme et al. (63) | <12:0 (9.9) | 18:1 (10.1) | apoA-I, apoA-I:apoB ratio, apoB, HDL-C, LDL-C, Lp(a), TC, TC:HDL-C ratio, TG | ↑ apoA-I:apoB ratio |
| <12:0 (9.9) | 14:0 (9.7) | ↑ apoA-I, apoA-I:apoB ratio, HDL-C | ||
| 14:0 (9.6) | 18:1 (10.4) | ↓ LDL-C, TC | ||
| Ghafoorunissa et al. (64) | 16:0 (5.0) | 18:2n–6 (3.7) | HDL-C, LDL-C, TC, TG, VLDL-C | NSD |
| 16:0 (6.0) | 18:2n–6 (3.7) | NSD | ||
| Tholstrup et al. (65) | 14:0 (13.4) | 16:0 (12.8) | apoA-I, apoB, fibrinogen, HDL-C, HDL2-C, HDL3-C, LDL-C, LDL-C:HDL-C ratio, TC, TG, tPA activity, VLDL-C | ↑ LDL-C, LDL-C:HDL-C ratio, TG; ↓ HDL-C, TC |
| Zock and Katan (66) | 18:0 (9.0) | 18:2n–6 (8.1) | apoA-I, apoA-I:apoB ratio, apoB, HDL-C, HDL-C:LDL-C ratio, LDL-C, TC, TG | ↑ apoA-I:apoB ratio, HDL-C, HDL-C:LDL-C ratio; ↓ apoB, LDL-C, TC, TG |
| Total trans (7.6) | MUFAs + PUFAs (7.5) | ↑ apoA-I, apoA-I:apoB ratio, HDL-C, HDL-C:LDL-C ratio; ↓ apoB, LDL-C, TC | ||
FAs considered: lauric acid (12:0), myristic acid (14:0), palmitic acid (16:0), stearic acid (18:0), palmitoleic acid (16:1n–7), oleic acid (18:1n–9), linoleic acid (18:2n–6), α-linolenic acid (18:2n–3). CAD, coronary artery disease; CRP, C-reactive protein; FA, fatty acid; HDL-C, HDL cholesterol; HDL2-C, HDL2 cholesterol; HDL3-C, HDL3 cholesterol; LDL-C, LDL cholesterol; Lp(a), lipoprotein (a); N/A, not applicable; NEFA, nonesterified fatty acid; NSD, no significant difference; PAI-1, plasminogen activator inhibitor-1; TC, total cholesterol; TG, triacylglycerol; tPA, tissue plasminogen activator; VLDL-C, VLDL cholesterol; ↑, increase; ↓, decrease; %TE, percent total energy.
Comparisons reported as statistically significant in the original full-text articles.
HDL cholesterol
Pooled analyses (presented in Figure 5) showed no statistically significant effect on HDL-cholesterol concentrations of the dietary replacements of palmitic with stearic acid (WMD: −0.06 mmol/L; 95% CI: −0.14, 0.03 mmol/L; I2 = 75.0%, n = 5 RCTs), stearic acid with a mixture of UFAs (WMD: 0.05 mmol/L; 95% CI: −0.02, 0.12 mmol/L; I2 = 32.6%, n = 4 RCTs), or palmitic acid with a mixture of UFAs (WMD: −0.02 mmol/L; 95% CI: −0.05, 0.01 mmol/L; I2 = 83.9%, n = 18 RCTs). However, there was a statistically significant albeit small decrease in HDL-cholesterol concentration, with large heterogeneity, when replacing dietary palmitic with oleic acid based on the pooled analysis of 9 RCTs (WMD: −0.05 mmol/L; 95% CI: −0.10, −0.005 mmol/L; I2 = 78.6%). Results remained similar when excluding 2 RCTs with potential reporting errors in the full-text articles (Supplemental Figure 3) (45, 56). Meta-regression analyses revealed no effect of the amount of dietary palmitic acid exchanged for UFAs on the concentrations of HDL cholesterol (P value = 0.48).
FIGURE 5.

Forest plot of the effect of dietary fat substitutions on HDL-C in randomized controlled trials. HDL-C, HDL cholesterol; HKSJ, Hartung-Knapp-Sidik-Jonkman; REML, restricted maximum likelihood.
The impact of other dietary FA substitutions was further assessed in 14 RCTs conducted between 1992 and 2010 (34, 35, 42, 44, 51, 59–61, 63–66, 68), which are described in Table 3. Overall, increased HDL-cholesterol concentrations were observed when replacing dietary medium-chain SFAs with myristic acid (63), stearic acid with oleic or linoleic acid (66, 68), and trans-FAs with a mixture of UFAs (44, 66). In contrast, the replacement of dietary palmitic acid with UFAs (35, 51) or trans-elaidic acid (trans-18:1n–9) (51), and myristic with palmitic acid (65), decreased concentrations of HDL cholesterol. Finally, the included RCTs did not reveal any significant impact of replacing medium-chain SFAs with UFAs on HDL-cholesterol concentrations (59–61, 63).
TC:HDL cholesterol ratio
Replacing dietary palmitic acid with oleic acid or a mixture of UFAs led to a trend for a decrease in the TC:HDL cholesterol ratio, but the quantitative syntheses based on 3 and 4 RCTs, respectively, did not reach statistical significance (Supplemental Figure 4).
Other dietary fat replacements were studied in 7 RCTs conducted between 1997 and 2020 (Table 3) (16, 26, 28, 34, 38, 63, 68). No effects on the TC:HDL cholesterol ratio were observed when replacing dietary medium-chain SFAs with myristic or oleic acid (63), or when replacing dietary stearic acid with a mixture of UFAs (26, 38). Furthermore, the dietary replacement of palmitic with stearic acid was found to either increase or not affect the TC:HDL cholesterol ratio in 2 recent RCTs (16, 28).
LDL cholesterol:HDL cholesterol ratio
The replacement of dietary palmitic acid with a mixture of UFAs and its impact on the LDL cholesterol:HDL cholesterol ratio was investigated in 6 RCTs and showed a trend for a beneficial effect (i.e., decrease), although the quantitative synthesis did not reach statistical significance (WMD: −0.25; 95% CI: −0.60, 0.09; I2 = 17.6%, n = 6 RCTs) (Supplemental Figure 5). There was no correlation coefficient value available to correct the effect measures of the LDL cholesterol:HDL cholesterol ratio in crossover trials (Supplemental Table 1).
Other dietary fat replacements and their impact on LDL cholesterol:HDL cholesterol or HDL cholesterol:LDL cholesterol ratios were investigated in 8 RCTs which are described in Table 3 (44, 47, 49, 51, 53, 56, 65, 66). Overall, findings from 2 RCTs suggested a beneficial effect (i.e., decreased LDL cholesterol:HDL cholesterol ratio) of dietary myristic acid compared with palmitic acid (53, 65), and of UFAs compared with trans-FAs (44, 66). However, the included RCTs showed no emerging trend of the impact of replacing dietary palmitic with oleic acid (47, 49, 51, 53) or stearic acid with UFAs (56, 66) on the LDL cholesterol:HDL cholesterol ratio.
VLDL cholesterol
We observed no effect of the dietary exchange of palmitic acid for a mixture of UFAs on VLDL-cholesterol concentrations, and no evidence of interstudy heterogeneity (WMD: 0.02 mmol/L; 95% CI: −0.09, 0.13 mmol/L; I2 = 0%, n = 10 RCTs) (Supplemental Figure 6). There was no correlation coefficient value available to correct the effect measures of VLDL-cholesterol concentrations in crossover trials (Supplemental Table 1).
The impact of other dietary fat replacements on VLDL-cholesterol fasting concentrations was investigated in 11 additional RCTs (40, 41, 47, 48, 51, 54, 56, 61, 64, 65) conducted between 1988 and 2003. As described in Table 3, the included RCTs showed no changes in VLDL-cholesterol concentrations after replacing dietary palmitic with stearic (48, 56) or linoleic acid (64). In particular, 1 crossover RCT conducted in 27 participants over 28 d observed reductions in VLDL-C concentrations when replacing dietary palmitic (4.1%TE) with oleic acid (2.7%TE) (47). In contrast, a 2003 parallel RCT conducted in 64 participants over 84 d found that dietary oleic acid might increase VLDL-cholesterol concentrations compared with dietary medium-chain SFAs (61).
Triacylglycerol
There was no statistically significant effect on triacylglycerol (TG) concentrations of the dietary substitution of palmitic with stearic acid, stearic acid with a mixture of UFAs, palmitic with oleic acid, or palmitic acid with a mixture of UFAs (Figure 6). In the latter, we found no effect of the amount of dietary palmitic acid exchanged for UFAs (P value = 0.36). These results remained unchanged when excluding 2 RCTs with potential reporting errors in the full-text articles (Supplemental Figure 7) (32, 51).
FIGURE 6.

Forest plot of the effect of dietary fat substitutions on triacylglycerol concentrations in randomized controlled trials. HKSJ, Hartung-Knapp-Sidik-Jonkman; REML, restricted maximum likelihood.
Other dietary fat substitutions and their impact on TG concentrations were described in 17 RCTs conducted between 1992 and 2010 (Table 3) (34, 35, 40–42, 44, 53, 54, 59–61, 63–66, 68). Four RCTs focused on medium-chain SFAs and suggested their potential beneficial effect (i.e., decreased TG concentrations) compared with diets enriched in linoleic acid or a mixture of UFAs (59, 60), but not oleic acid (61, 63). Furthermore, dietary myristic acid does not seem to affect TG concentrations compared with palmitic or oleic acids according to 2 trials (53, 63). However, 1 crossover RCT which included 12 participants over 21 d observed beneficial effects of dietary myristic acid compared with palmitic acid on TG concentrations (65). Finally, there was no evidence of an impact of replacing dietary trans-FAs with a mixture of UFAs on TG concentrations, according to 2 trials (44, 66).
apoA-I
In quantitative syntheses presented in Figure 7, we observed no statistically significant effect on apoA-I concentrations after the dietary replacement of palmitic with stearic acid, oleic acid, or a mixture of UFAs. These results remained unchanged after the exclusion of 2 RCTs containing potential reporting errors in the full-text articles (Supplemental Figure 8) (28, 29). The impact of other dietary fat replacements on apoA-I concentrations was investigated in 12 RCTs conducted between 1992 and 2020 (Table 3) (26, 34, 38, 40, 44, 53, 59, 60, 63, 65, 66, 68). Among those, 3 RCTs reported significant increases in apoA-I when replacing dietary medium-chain SFAs with myristic acid (63), stearic with oleic acid (68), or trans-FAs with UFAs (66) and 1 RCT reported reductions in apoA-I concentrations when replacing dietary myristic with palmitic or oleic acid (53).
FIGURE 7.

Forest plot of the effect of dietary fat substitutions on apoA-I concentrations in randomized controlled trials. HKSJ, Hartung-Knapp-Sidik-Jonkman; REML, restricted maximum likelihood.
apoB
In pooled meta-analyses, we observed no statistically significant effect on apoB concentrations of the dietary replacement of palmitic with stearic acid (Figure 8). However, small reductions in apoB concentration were observed in response to the dietary replacement of palmitic acid with oleic acid (WMD: −0.05 g/L; 95% CI: −0.07, −0.04 g/L; I2 = 0.0%, n = 5 RCTs) or a mixture of UFAs (WMD: −0.06 g/L; 95% CI: −0.10, −0.01 g/L; I2 = 98.8%, n = 9 RCTs), with the latter showing evidence of high statistical heterogeneity.
FIGURE 8.

Forest plot of the effect of dietary fat substitutions on apoB concentrations in randomized controlled trials. HKSJ, Hartung-Knapp-Sidik-Jonkman; REML, restricted maximum likelihood.
Other dietary fat replacements and their impact on apoB concentrations were investigated in 12 RCTs and are described in Table 3 (26, 34, 38, 40, 44, 53, 59, 60, 63, 65, 66, 68). The effects of replacing medium-chain SFAs with UFAs was investigated in 3 RCTs, which reported no effect of oleic acid (63), a beneficial effect (decreased apoB concentrations) of linoleic acid (59), and a deleterious effect of a mixture of UFAs (60). Furthermore, there was no evidence for a significant effect of myristic acid compared with palmitic acid (53, 65); however, 1 crossover RCT which included 59 participants over 21 d reported decreased apoB concentrations when myristic acid was replaced with oleic acid (53). Finally, 2 RCTs observed reductions in apoB concentrations when replacing dietary trans-FAs with a mixture of UFAs (44, 66).
Other lipid-related outcomes
Three RCTs reported that replacing dietary palmitic acid with a mixture of UFAs did not affect the concentrations of nonesterified fatty acids (NEFAs) (Supplemental Figure 9). Table 3 describes findings on other lipid outcomes, including the apoA-I:apoB ratio, apoA-II, apoE, HDL2 cholesterol, HDL3 cholesterol, TG content in lipoproteins, and lipoprotein (a) [Lp(a)]. The following qualitative synthesis section will highlight the main findings on these outcomes reported in eligible RCTs.
Additional lipoprotein concentrations, such as apoA-I:apoB ratio, apoA-II, or apoE, were measured in 11 RCTs (16, 26, 37, 47, 49, 51, 59, 60, 63, 66, 67). In particular, 3 RCTs found beneficial effects (i.e., increase) on the apoA-I:apoB ratio after the dietary replacement of medium-chain SFAs with myristic or oleic acid (63), stearic with linoleic acid (66), or trans-FAs with a mixture of UFAs (66). In contrast, 1 recent crossover RCT which included 35 participants over 21 d observed deleterious effects of dietary stearic acid compared with palmitic acid on the apoA-I:apoB ratio (16). Moreover, 1 RCT observed significant increases in apoA-II concentrations with substitution of dietary medium-chain SFAs with a mixture of UFAs (60). One trial further reported increased apoE concentrations, in men only, when replacing dietary medium-chain SFAs with linoleic acid (59). Based on findings from 2 RCTs, apoA-II and apoE concentrations were not affected by the dietary replacement of palmitic acid with a mixture of UFAs (37, 67).
Five RCTs measured the concentrations of HDL2 cholesterol and HDL3 cholesterol in plasma or serum in response to dietary replacements of myristic with palmitic acid (65); of palmitic acid with stearic acid (43), oleic acid (51), or a mixture of UFAs (37, 51); and of stearic acid with oleic acid or trans FAs (68). Whereas no effects were observed on HDL2 cholesterol, 1 study reported decreased HDL3-cholesterol concentrations in response to the replacement of dietary palmitic acid with a mixture of UFAs (37), and another reported a greater HDL3-cholesterol concentration after replacing dietary stearic with oleic acid (68). Furthermore, 2 RCTs measured the TG content of HDL, LDL, and VLDL fractions, and reported no changes after replacing dietary medium-chain SFAs with oleic acid (61) or palmitic with stearic acid (48).
Finally, 10 RCTs assessed the impact of various dietary fat exchanges on concentrations of Lp(a) (28, 33, 37, 40, 44, 47, 49, 51, 63, 67), including the replacement of palmitic acid with a mixture of UFAs (n = 5 RCTs) (37, 40, 44, 51, 67) or oleic acid (n = 4 RCTs) (33, 47, 49, 51). None of the included RCTs reported significant changes in Lp(a) concentrations after the dietary interventions.
Effect of dietary fat replacement on markers of glycemic control
Glucose
Six RCTs investigated the impact of replacing dietary palmitic acid with a mixture of UFAs on fasting glucose concentrations, without showing any statistically significant overall effect (WMD: −0.04 mmol/L; 95% CI: −0.10, 0.01 mmol/L; I2 = 35.5%, n = 6 RCTs) (Supplemental Figure 10A). In addition, 8 RCTs measured glucose concentrations in response to other dietary fat exchanges (16, 26, 28, 32, 36, 59–61), but none reported statistically significant changes (Table 3).
Insulin
Similar results were observed in the pooled analysis of 5 RCTs which showed no overall effect of replacing dietary palmitic acid with a mixture of UFAs on fasting insulin concentrations (WMD: −2.60 pmol/L; 95% CI: –9.66, 4.47 pmol/L; I2 = 68.9%, n = 5 RCTs) (Supplemental Figure 10B). Four RCTs further assessed the effects of replacing dietary palmitic acid with stearic acid (16, 28), oleic acid (32), or MUFAs (40) on insulin concentrations. Results from these trials, as described in Table 3, suggest a tendency for increased fasting insulin concentrations when replacing dietary palmitic acid with stearic acid or MUFAs (16, 40).
Other markers of glycemic control and insulin resistance
As detailed in Table 3, 2 RCTs investigated the impact of replacing dietary palmitic with stearic acid on HOMA-IR and C-peptide concentrations (16, 28), 1 of which observed decreased C-peptide concentrations and increased HOMA-IR after a diet rich in stearic acid compared with a palmitic acid–rich diet (16). Furthermore, 3 trials investigated the effects of replacing dietary palmitic acid with a mixture of UFAs, without showing any significant impact on HOMA-IR (27, 37, 67).
Effect of dietary fat replacement on markers of inflammation
Three RCTs investigated the effects of replacing dietary palmitic acid with a mixture of UFAs on C-reactive protein (CRP) or high-sensitivity CRP concentrations and showed no overall effect (WMD: −0.02 mg/L; 95% CI: −0.04, 0.01 mg/L; I2 = 0.0%, n = 3 RCTs) (Supplemental Figure 11). In addition, CRP concentrations in response to the dietary replacement of palmitic acid with stearic acid, oleic acid, trans-elaidic acid, or MUFAs were assessed in 5 trials (Table 3) (16, 32, 34, 36, 40). Only 1 crossover study, which included 41 participants over 35 d, observed a detrimental impact on CRP concentrations (i.e., increase) after a diet rich in trans-FAs compared with a palmitic acid–rich diet (34). Other markers of inflammation, such as IL-6 and TNF-α, were investigated in 2 RCTs (16, 34), 1 of which showed detrimental changes in these 2 markers (i.e., increased concentrations) after replacing dietary palmitic with stearic acid (16).
Effect of dietary fat replacement on metabolic hormone concentrations and markers of hemostasis
Six RCTs measured concentrations of adiponectin (30, 31, 60) or leptin (26, 28, 67) in response to dietary fat replacements (Table 3). The authors did not report any effects on these 2 hormones of replacing dietary palmitic acid with stearic acid or a mixture of UFAs, medium-chain SFAs with a mixture of UFAs, or stearic acid with a mixture of UFAs.
Similarly, 5 RCTs investigated the response of markers of hemostasis, such as fibrinogen concentration, tissue-type plasminogen activator activity, and plasminogen activator inhibitor-1 (PAI-1) activity, to dietary fat exchanges (Table 3) (32, 39, 42, 62). The dietary interventions assessed in these trials included the replacement of myristic with palmitic acid, of palmitic or stearic acids with oleic acid, and of stearic acid with a mixture of UFAs. Only 1 of these RCTs observed a beneficial effect (i.e., decrease) of replacing palmitic with oleic acid on PAI-1 activity (62).
Reporting biases
As per our predefined protocol, the assessment of reporting bias was conducted for quantitative syntheses that included ≥10 RCTs, which applied to those assessing the impact of replacing dietary palmitic acid with a mixture of UFAs on concentrations of TC, LDL cholesterol, HDL cholesterol, and TG. The results from Egger's tests did not indicate any signs of publication bias or small study effects in the quantitative synthesis of HDL cholesterol (P value = 0.12). However, potential publication bias was found in the syntheses of TC (P value = 0.006), LDL cholesterol (P value = 0.04), and TG (P value = 0.04). For these outcomes, contour-enhanced funnel plots and corrections using the trim-and-fill method yielded similar summary effects to the ones observed without corrections (WMD for TC: −0.30 mmol/L; 95% CI: −0.44, −0.15 mmol/L, Supplemental Figure 12A; WMD for LDL cholesterol: −0.34 mmol/L; 95% CI: −0.47, −0.20 mmol/L, Supplemental Figure 12B; and WMD for TG: 0.00 mmol/L; 95% CI: −0.03, 0.03 mmol/L, Supplemental Figure 12C).
Discussion
This systematic review of RCTs is the first, to our knowledge, to investigate the role of replacement of individual dietary SFAs on biomarkers of CMD risk. In our meta-analyses, we found the isoenergetic dietary replacement of ≥1.5%TE of palmitic acid with oleic acid or UFAs for a duration of ≥14 d had significant beneficial impacts on lipid CMD risk markers, including TC, LDL cholesterol, and apoB concentrations in adults, albeit with high heterogeneity. In particular, there was a significant linear relation between the amount of dietary palmitic acid exchanged with UFAs and the decreases observed in fasting LDL-cholesterol and TC concentrations. There was, however, no significant effect of the latter dietary substitution on other lipid CMD risk markers such as circulating HDL-cholesterol, VLDL-cholesterol, TG, apoA-I, or NEFA concentrations, or the TC:HDL cholesterol or LDL cholesterol:HDL cholesterol ratios. Our qualitative synthesis highlighted the abundance of RCTs investigating the effects of dietary palmitic acid, and to a lesser extent stearic acid, whereas trials on other SFAs such as myristic or lauric acids were much scarcer. Most of the trials included focused on traditional biomarkers of CMD risk such as fasting lipid profiles, with little evidence on other risk factors such as markers of inflammation, hemostasis, glycemic control, or metabolic hormones.
Our findings are in line with results from the 2019 UK Scientific Advisory Committee on Nutrition (SACN) on SFA and health, which reported adequate evidence from RCTs supporting the hypothesis that a replacement of overall dietary SFAs with MUFAs or PUFAs might lead to lower concentrations of TC and LDL cholesterol (8). In addition, the report did not suggest any effect on HDL-cholesterol concentrations (moderate evidence quality), TG concentrations (adequate evidence quality), or the TC:HDL cholesterol ratio (limited evidence quality) (8). Furthermore, our SLR adds novel evidence regarding the apolipoprotein responses to individual dietary SFAs, which were not investigated in the 2019 SACN report. In quantitative meta-analyses, we observed similar effects of the replacements of dietary palmitic acid with UFAs or oleic acid on apoB and LDL-cholesterol, and on apoA-I and HDL-cholesterol concentrations, which reflects the main apoproteins associated with these lipoproteins.
Although there is no previous SLR and meta-analysis of RCTs on the effects of individual dietary SFAs available in the literature to our knowledge, in 2014 Fattore et al. (69) systematically reviewed RCTs on the effects of palm olein–rich diets compared with other dietary fats on fasting lipids. Their meta-analyses included some RCTs also reviewed in our SLR, and authors observed beneficial effects on LDL-cholesterol concentrations of diets rich in stearic acid (n = 8) or MUFAs (n = 20), but not PUFAs (n = 14), in comparison with palm olein–rich diets. They further reported that PUFA-rich diets might decrease concentrations of TC (n = 16), HDL cholesterol (n = 16), apoA-I (n = 7), and apoB (n = 7) (69). These results suggested contrasting effects of palm olein on different CVD risk markers and might be confounded by the composition of the palm olein used in the included RCTs, which contained palmitic acid as the main source of SFA but was also a small dietary source of oleic and linoleic acids. Overall, our findings are supported by experimental evidence suggesting that as opposed to dietary UFAs, SFAs and particularly palmitic acid are associated with downregulation of the expression of LDL receptors on the surface of hepatocytes. This can result in higher circulating concentrations of LDL cholesterol and a potential increased risk of developing and/or exacerbating atherosclerosis (70, 71). In addition, previous RCTs have suggested that dietary SFAs may be associated with higher concentrations of E-selectin (72, 73), a biomarker of atherosclerosis and endothelial activation, although this SLR did not identify RCTs investigating the impact of individual SFAs on this cell adhesion molecule.
The limited number of RCTs may have contributed to the lack of identified statistically significant effects of replacing dietary palmitic acid with UFAs on markers of glycemic control (i.e., fasting glucose and insulin concentrations) or inflammation (i.e., CRP concentrations) in our meta-analyses. However, when looking at overall dietary SFAs, authors from the 2019 SACN report observed beneficial effects of SFA substitution with PUFAs but not MUFAs on fasting glucose concentrations, a potential deleterious effect of dietary MUFAs but not PUFAs on fasting insulin concentrations, and beneficial effects of both MUFAs and PUFAs on glycated hemoglobin (a long-term biomarker of glycemic control) based on adequate-quality evidence from RCTs (8). There is, to our knowledge, no SLR or meta-analysis looking at the effect of such dietary replacements on CRP concentrations.
Furthermore, replacing dietary palmitic acid with stearic acid may have little to no effect on lipid CMD risk markers, such as LDL cholesterol, TC, and apoB, but the evidence based on 4–5 RCTs with low numbers of participants is very uncertain. Our findings on the dietary substitution of stearic acid with UFAs, which did not affect concentrations of LDL cholesterol, HDL cholesterol, TC, or TG in meta-analyses based on 4 RCTs, contrast with meta-analyses on dietary palmitic acid substituted with UFAs. This supports the hypothesis that dietary stearic acid might be less detrimental than other SFAs such as palmitic acid on lipid CMD risk markers. However, these findings were based on only 4 RCTs, 2 of which were classified as high risk of bias because of insufficient washout periods between the intervention diets. Predictive studies based on linear regression equations previously suggested the potential lack of detrimental effects of dietary stearic acid compared with other SFAs on fasting lipids (11, 74). The underlying mechanisms to support this proposal are not yet elucidated, and some studies suggested stearic acid might be poorly absorbed compared with other SFAs (56, 75) or could be directly converted into oleic acid, although this metabolic pathway seems to be minimal in humans (76).
Finally, this SLR led to the identification of important gaps in the literature regarding individual dietary SFAs. In particular, there is a lack of RCTs investigating the impact of medium-chain SFAs, lauric acid, and myristic acid in comparison with other SFAs and/or UFAs. Overall, our qualitative synthesis suggested dietary myristic acid might have more deleterious effects than palmitic acid, oleic acid, or medium-chain SFAs on fasting lipid profiles, but no other emerging trends were evident from the other included RCTs. The potential atherogenic effect of dietary myristic acid has been previously investigated in predictive regression studies (74, 77), but a consensus on the true effect of myristic acid on cardiometabolic health has not yet been reached (78–80). Moreover, our qualitative synthesis highlighted that very few RCTs assessed the impact of individual SFAs on other biomarkers of cardiometabolic health status, such as metabolic hormone concentrations or markers of hemostasis and inflammation.
Overall, strengths of this SLR and meta-analysis pertain to its broad yet specific focus on individual dietary SFA substitutions. Our findings are the first and the most up-to-date, to our knowledge, to provide an exhaustive overview of the currently known causal effects of single dietary SFAs on a wide range of CMD risk biomarkers. This “single SFA” approach, which was ensured by strict a priori–defined inclusion criteria, allowed the investigation of the causal effect of specific isoenergetic dietary substitutions on cardiometabolic health while minimizing potential confounding from other dietary FAs or macronutrients. This SLR also benefitted from a strong methodology based on the Cochrane and PRISMA guidelines. Nevertheless, some limitations also need to be acknowledged. Firstly, some of the included crossover trials with insufficient washout periods might present a high risk of bias due to potential carryover effects. This may have led to imprecise estimations of the beneficial effects of UFA-rich diets compared with palmitic acid–rich diets on some of the lipid outcomes reviewed in this SLR. In addition, we observed high statistical heterogeneity in meta-analyses on TC, LDL-cholesterol, HDL-cholesterol, and apolipoprotein concentrations, which might have prevented the detection of statistically significant effect sizes, particularly in meta-analyses with few RCTs reporting effects distributed around the null. However, some of the observed high heterogeneity might be explained by correlation coefficients used to estimate corrected intervention effects which account for the intraparticipant variation specific for this type of study design. Although this approach is recommended by the Cochrane handbook for systematic reviews (23), this may have led to underestimated CIs of the effects from individual RCTs. Furthermore, our analyses focused on individual dietary SFAs and might not account for potential food matrix effects from dietary sources of SFAs, such as red meat (81), dairy foods (82), or coconut, palm, and, to a lesser extent, other plant-based oils (83). For instance, dairy food intakes may be associated with lower CMD risks, despite being important dietary sources of palmitic acid and stearic acid (84, 85). Finally, the small number of studies included in quantitative syntheses precluded the detailed investigation of potential dose–response relations, high interstudy heterogeneity, and publication bias.
To conclude, our findings on the replacement of dietary palmitic acid with oleic acid or UFAs are overall in line with current public health recommendations which suggest reducing dietary SFAs in favor of UFAs to help prevent CMD. This further supports the hypothesis that dietary SFAs should not be considered as a homogeneous nutrient group, and that individual SFAs might have differential impacts on cardiometabolic health. However, our quantitative findings need to be interpreted with caution owing to the presence of high statistical heterogeneity and a low number of RCTs. With most of the available evidence focusing on dietary palmitic, and to a lesser extent stearic acid, and their impact on lipid profiles, further RCTs designed to investigate different SFAs such as lauric and myristic acids and their impact on other clinical biomarkers of CMD risk such as markers of inflammation, endothelial activation, and glycemic control are warranted. Overall, a more complete picture of the impact of dietary SFAs on metabolic health status would greatly contribute to the improvement of public health guidelines for the prevention of CMD.
Supplementary Material
ACKNOWLEDGEMENTS
We thank Dr. Odgerel Baasan, Dr. Wendy Blom, Dr. Marjolijn Bragt, Dr. Nils Billecke, Dr. Mathilde Fleith, and Dr. Agnes Méheust as members of the ILSI Europe expert group who initiated the work and for their early contributions to the literature search. The authors’ responsibilities were as follows—LS, MF, SL, JL, and RPM: performed the literature searches; LS, MF, KGJ, PJJ, JL, SL, RPM, and JAL: contributed to the screening of titles, abstracts, and full-text records; LS: performed the statistical analyses, under the supervision of SSS-M and SL, and drafted the manuscript; LS and JL: performed the risk of bias assessments; MF, KGJ, PJJ, JL, SL, RPM, SSS-M, and JAL: contributed to the interpretation of the data and revised each draft of the manuscript for important intellectual content; and all authors: contributed to data extraction from full-text records and read and approved the final manuscript.
Notes
LS was funded by the Biotechnology and Biological Sciences Research Council (BBSRC) UK Joint Programme Initiative “HDHL Biomarkers: Fatty Acid Metabolism—Interlinking Diet with Cardiometabolic Health (FAME)” (project reference: BB/P028217/1).
Author disclosures: This work was conducted by an expert group of the European branch of the International Life Sciences Institute (ILSI Europe). The research question addressed in this publication and potential contributing experts in the field were identified by the Qualitative Fat Intake (QFI) Task Force. Industry members of this task force are listed on ILSI Europe's website: http://ilsi.eu/wp-content/uploads/sites/3/2019/11/Qualitative-Fat-Intake_TFonepager_Sept2019.pdf. Experts are not paid for the time spent on this work; however, the nonindustry members within the expert group were offered support for travel and accommodation costs from the QFI Task Forces to attend meetings to discuss the manuscript. The expert group carried out the work, i.e., collecting/analyzing data/information and writing the scientific paper separate to other activities of the task forces. The research reported is the result of a scientific evaluation in line with ILSI Europe's framework to provide a precompetitive setting for public–private partnership. ILSI Europe facilitated scientific meetings and coordinated the overall project management and administrative tasks relating to the completion of this work. For further information about ILSI Europe, please email info@ilsieurope.be or call +32 2 771 00 14. The opinions expressed herein and the conclusions of this publication are those of the authors and do not necessarily represent the views of ILSI Europe nor those of its member companies. JAL is Deputy Chair of the UK Scientific Advisory Committee for Nutrition (SACN) and was an expert on SACN's Saturated Fats working group. MF is an employee of ILSI Europe. SSS-M has received unrestricted grants from the Global Dairy Platform, Dairy Research Institute, and Dairy Australia for a meta-analysis on cheese and blood lipids (2012) and a meta-analysis of dairy and mortality (2015). She received the Wiebe Visser International Dairy Nutrition Prize and has received recent research funding (2019) for epidemiological studies on dairy products and cardiometabolic diseases from the Dutch Dairy Association and the Danish Dairy Research Foundation.
Supplemental Method 1, Supplemental Figures 1–12, and Supplemental Tables 1 and 2 are available from the “Supplementary data” link in the online posting of the article and from the same link in the online table of contents at https://academic.oup.com/advances/.
Abbreviations used: CMD, cardiometabolic disease; CRP, C-reactive protein; CVD, cardiovascular disease; FA, fatty acid; HKSJ, Hartung-Knapp-Sidik-Jonkman; Lp(a), lipoprotein (a); PAI-1, plasminogen activator inhibitor-1; PRISMA, Preferred Reporting Items for Systematic Reviews and Meta-Analyses; RCT, randomized controlled trial; REML, restricted maximum likelihood; SACN, Scientific Advisory Committee on Nutrition; SLR, systematic literature review; TC, total cholesterol; TG, triacylglycerol; UFA, unsaturated fatty acid; WMD, weighted mean difference; %TE, percent total energy.
Contributor Information
Laury Sellem, Hugh Sinclair Unit of Human Nutrition, and Institute for Cardiovascular and Metabolic Research, Department of Food and Nutritional Sciences, University of Reading, Reading, United Kingdom; Institute for Food, Nutrition, and Health, University of Reading, Reading, United Kingdom.
Matthieu Flourakis, International Life Sciences Institute Europe, Brussels, Belgium.
Kim G Jackson, Hugh Sinclair Unit of Human Nutrition, and Institute for Cardiovascular and Metabolic Research, Department of Food and Nutritional Sciences, University of Reading, Reading, United Kingdom; Institute for Food, Nutrition, and Health, University of Reading, Reading, United Kingdom.
Peter J Joris, Department of Nutrition and Movement Sciences, NUTRIM School of Nutrition and Translational Research in Metabolism, Maastricht University Medical Center, Maastricht, Netherlands.
James Lumley, Hugh Sinclair Unit of Human Nutrition, and Institute for Cardiovascular and Metabolic Research, Department of Food and Nutritional Sciences, University of Reading, Reading, United Kingdom; Institute for Food, Nutrition, and Health, University of Reading, Reading, United Kingdom.
Szimonetta Lohner, Department of Public Health Medicine, Medical School, University of Pécs, Pécs, Hungary; Cochrane Hungary, Clinical Centre of the University of Pécs, Medical School, University of Pécs, Pécs, Hungary.
Ronald P Mensink, Department of Nutrition and Movement Sciences, NUTRIM School of Nutrition and Translational Research in Metabolism, Maastricht University Medical Center, Maastricht, Netherlands.
Sabita S Soedamah-Muthu, Institute for Food, Nutrition, and Health, University of Reading, Reading, United Kingdom; CoRPS—Center of Research on Psychological and Somatic Disorders, Department of Medical and Clinical Psychology, Tilburg University, Tilburg, Netherlands.
Julie A Lovegrove, Hugh Sinclair Unit of Human Nutrition, and Institute for Cardiovascular and Metabolic Research, Department of Food and Nutritional Sciences, University of Reading, Reading, United Kingdom; Institute for Food, Nutrition, and Health, University of Reading, Reading, United Kingdom.
References
- 1. World Health Organization . Cardiovascular diseases (CVDs). [Internet]. Geneva, Switzerland: WHO; 2021; [cited 1 June, 2021]. Available from: https://www.who.int/news-room/fact-sheets/detail/cardiovascular-diseases-(cvds). [Google Scholar]
- 2. Blake GJ, Ridker PM. Inflammatory bio-markers and cardiovascular risk prediction. J Intern Med. 2002;252(4):283–94. [DOI] [PubMed] [Google Scholar]
- 3. Kannel WB. Overview of hemostatic factors involved in atherosclerotic cardiovascular disease. Lipids. 2005;40(12):1215–20. [DOI] [PubMed] [Google Scholar]
- 4. World Health Organization . Prevention of cardiovascular disease: guidelines for assessment and management of cardiovascular risk. Geneva, Switzerland: WHO; 2007. [Google Scholar]
- 5. Mach F, Baigent C, Catapano AL, Koskinas KC, Casula M, Badimon L, Chapman MJ, De Backer GG, Delgado V, Ference BAet al. 2019 ESC/EAS Guidelines for the management of dyslipidaemias: lipid modification to reduce cardiovascular risk. Eur Heart J. 2020;41(1):111–88. [DOI] [PubMed] [Google Scholar]
- 6. Nordic Council of Ministers . Nordic Nutrition Recommendations 2012: integrating nutrition and physical activity. [Internet]. 5th ed. Copenhagen, Denmark: Nordisk Ministerråd; 2014; [cited 29 October, 2021]. Available from: http://urn.kb.se/resolve?urn=urn:nbn:se:norden:org:diva-2561. [Google Scholar]
- 7. Hooper L, Martin N, Jimoh OF, Kirk C, Foster E, Abdelhamid AS. Reduction in saturated fat intake for cardiovascular disease. Cochrane Database Syst Rev. 2020;(8):CD011737. [DOI] [PMC free article] [PubMed] [Google Scholar]
- 8. Scientific Advisory Committee on Nutrition (SACN) . Report on saturated fats and health. [Internet]. London, United Kingdom: SACN; 2019; [cited 1 August, 2019]. Available from: https://assets.publishing.service.gov.uk/government/uploads/system/uploads/attachment_data/file/814995/SACN_report_on_saturated_fat_and_health.pdf. [Google Scholar]
- 9. Kris-Etherton PM, Yu S. Individual fatty acid effects on plasma lipids and lipoproteins: human studies. Am J Clin Nutr. 1997;65(5):1628S–44S. [DOI] [PubMed] [Google Scholar]
- 10. German JB, Dillard CJ. Saturated fats: what dietary intake?. Am J Clin Nutr. 2004;80(3):550–9. [DOI] [PubMed] [Google Scholar]
- 11. Mensink RP. Effects of saturated fatty acids on serum lipids and lipoproteins: a systematic review and regression analysis. [Internet]. Geneva, Switzerland: World Health Organization; 2016 [accessed 3 November, 2021]. Available from: https://apps.who.int/iris/handle/10665/246104. [Google Scholar]
- 12. Agence Nationale de Sécurité Sanitaire Alimentation, Environnement, Travail (ANSES) . Update on recommended dietary intakes of fatty acids: collective expert report [actualisation des apports nutritionnels conseillés pour les acides gras: rapport d'expertise collective]. [Internet]. Maisons-Alfort, France: ANSES; 2011 [accessed 3 November, 2021]. Available from: https://www.anses.fr/fr/system/files/NUT2006sa0359Ra.pdf. [Google Scholar]
- 13. Page MJ, McKenzie JE, Bossuyt PM, Boutron I, Hoffmann TC, Mulrow CD, Shamseer L, Tetzlaff JM, Akl EA, Brennan SEet al. The PRISMA 2020 statement: an updated guideline for reporting systematic reviews. BMJ. 2021;372:n71. [DOI] [PMC free article] [PubMed] [Google Scholar]
- 14. Sterne JAC, Savović J, Page MJ, Elbers RG, Blencowe NS, Boutron I, Cates CJ, Cheng H-Y, Corbett MS, Eldridge SMet al. RoB 2: a revised tool for assessing risk of bias in randomised trials. BMJ. 2019;366:l4898. [DOI] [PubMed] [Google Scholar]
- 15. Hozo SP, Djulbegovic B, Hozo I. Estimating the mean and variance from the median, range, and the size of a sample. BMC Med Res Methodol. 2005;5(1):13. [DOI] [PMC free article] [PubMed] [Google Scholar]
- 16. van Rooijen MA, Plat J, Blom WAM, Zock PL, Mensink RP. Dietary stearic acid and palmitic acid do not differently affect ABCA1-mediated cholesterol efflux capacity in healthy men and postmenopausal women: a randomized controlled trial. Clin Nutr. 2021;40(3):804–11. [DOI] [PubMed] [Google Scholar]
- 17. Harville DA. Maximum likelihood approaches to variance component estimation and to related problems. J Am Stat Assoc. 1977;72(358):320–38. [Google Scholar]
- 18. Langan D, Higgins JPT, Jackson D, Bowden J, Veroniki AA, Kontopantelis E, Viechtbauer W, Simmonds M. A comparison of heterogeneity variance estimators in simulated random-effects meta-analyses. Res Synth Methods. 2019;10(1):83–98. [DOI] [PubMed] [Google Scholar]
- 19. Hartung J, Knapp G. A refined method for the meta-analysis of controlled clinical trials with binary outcome. Stat Med. 2001;20(24):3875–89. [DOI] [PubMed] [Google Scholar]
- 20. Sidik K, Jonkman JN. A simple confidence interval for meta-analysis. Stat Med. 2002;21(21):3153–9. [DOI] [PubMed] [Google Scholar]
- 21. Röver C, Knapp G, Friede T. Hartung-Knapp-Sidik-Jonkman approach and its modification for random-effects meta-analysis with few studies. BMC Med Res Methodol. 2015;15:99. [DOI] [PMC free article] [PubMed] [Google Scholar]
- 22. IntHout J, Ioannidis JP, Borm GF. The Hartung-Knapp-Sidik-Jonkman method for random effects meta-analysis is straightforward and considerably outperforms the standard Dersimonian-Laird method. BMC Med Res Methodol. 2014;14(1):25. [DOI] [PMC free article] [PubMed] [Google Scholar]
- 23. Higgins JPT, Thomas J, Chandler J, Cumpston M, Li T, Page M, Welch V, editors. Cochrane handbook for systematic reviews of interventions. [Internet]. Version 6.2. Cochrane; 2021 [accessed 27 August, 2021]. Available from: www.training.cochrane.org/handbook. [Google Scholar]
- 24. Egger M, Smith GD, Schneider M, Minder C. Bias in meta-analysis detected by a simple, graphical test. BMJ. 1997;315(7109):629–34. [DOI] [PMC free article] [PubMed] [Google Scholar]
- 25. Duval S, Tweedie R. Trim and fill: a simple funnel-plot-based method of testing and adjusting for publication bias in meta-analysis. Biometrics. 2000;56(2):455–63. [DOI] [PubMed] [Google Scholar]
- 26. Stonehouse W, Sergi D, Benassi-Evans B, James-Martin G, Johnson N, Thompson CH, Abeywardena M. Eucaloric diets enriched in palm olein, cocoa butter, and soybean oil did not differentially affect liver fat concentration in healthy participants: a 16-week randomized controlled trial. Am J Clin Nutr. 2021;113(2):324–37. [DOI] [PubMed] [Google Scholar]
- 27. Sun G, Xia H, Yang Y, Ma S, Zhou H, Shu G, Wang S, Yang X, Tang H, Wang Fet al. Effects of palm olein and olive oil on serum lipids in a Chinese population: a randomized, double-blind, cross-over trial. Asia Pac J Clin Nutr. 2018;27(3):572–80. [DOI] [PubMed] [Google Scholar]
- 28. Ng YT, Voon PT, Ng TKW, Lee VKM, Mat Sahri M, Mohd Esa N, Ong SH, Ong ASH. Interesterified palm olein (IEPalm) and interesterified stearic acid-rich fat blend (IEStear) have no adverse effects on insulin resistance: a randomized control trial. Nutrients. 2018;10(8):1112. [DOI] [PMC free article] [PubMed] [Google Scholar]
- 29. Karupaiah T, Chuah K-A, Chinna K, Matsuoka R, Masuda Y, Sundram K, Sugano M. Comparing effects of soybean oil- and palm olein-based mayonnaise consumption on the plasma lipid and lipoprotein profiles in human subjects: a double-blind randomized controlled trial with cross-over design. Lipids Health Dis. 2016;15(1):131. [DOI] [PMC free article] [PubMed] [Google Scholar]
- 30. Kien CL, Bunn JY, Stevens R, Bain J, Ikayeva O, Crain K, Koves TR, Muoio DM. Dietary intake of palmitate and oleate has broad impact on systemic and tissue lipid profiles in humans. Am J Clin Nutr. 2014;99(3):436–45. [DOI] [PMC free article] [PubMed] [Google Scholar]
- 31. Rosqvist F, Iggman D, Kullberg J, Cedernaes J, Johansson H-E, Larsson A, Johansson L, Ahlström H, Arner P, Dahlman Iet al. Overfeeding polyunsaturated and saturated fat causes distinct effects on liver and visceral fat accumulation in humans. Diabetes. 2014;63(7):2356–68. [DOI] [PubMed] [Google Scholar]
- 32. Tholstrup T, Hjerpsted J, Raff M. Palm olein increases plasma cholesterol moderately compared with olive oil in healthy individuals. Am J Clin Nutr. 2011;94(6):1426–32. [DOI] [PubMed] [Google Scholar]
- 33. Voon PT, Ng TKW, Lee VKM, Nesaretnam K. Diets high in palmitic acid (16:0), lauric and myristic acids (12:0 + 14:0), or oleic acid (18:1) do not alter postprandial or fasting plasma homocysteine and inflammatory markers in healthy Malaysian adults. Am J Clin Nutr. 2011;94(6):1451–7. [DOI] [PubMed] [Google Scholar]
- 34. Teng KT, Voon PT, Cheng HM, Nesaretnam K. Effects of partially hydrogenated, semi-saturated, and high oleate vegetable oils on inflammatory markers and lipids. Lipids. 2010;45(5):385–92. [DOI] [PubMed] [Google Scholar]
- 35. Utarwuthipong T, Komindr S, Pakpeankitvatana V, Songchitsomboon S, Thongmuang N. Small dense low-density lipoprotein concentration and oxidative susceptibility changes after consumption of soybean oil, rice bran oil, palm oil and mixed rice bran/palm oil in hypercholesterolaemic women. J Int Med Res. 2009;37(1):96–104. [DOI] [PubMed] [Google Scholar]
- 36. Mensink RP. Effects of products made from a high-palmitic acid, trans-free semiliquid fat or a high-oleic acid, low-trans semiliquid fat on the serum lipoprotein profile and on C-reactive protein concentrations in humans. Eur J Clin Nutr. 2008;62(5):617–24. [DOI] [PubMed] [Google Scholar]
- 37. Vega-López S, Ausman LM, Jalbert SM, Erkkilä AT, Lichtenstein AH. Palm and partially hydrogenated soybean oils adversely alter lipoprotein profiles compared with soybean and canola oils in moderately hyperlipidemic subjects. Am J Clin Nutr. 2006;84(1):54–62. [DOI] [PubMed] [Google Scholar]
- 38. Thijssen MA, Mensink RP. Small differences in the effects of stearic acid, oleic acid, and linoleic acid on the serum lipoprotein profile of humans. Am J Clin Nutr. 2005;82(3):510–16. [DOI] [PubMed] [Google Scholar]
- 39. Thijssen MA, Hornstra G, Mensink RP. Stearic, oleic, and linoleic acids have comparable effects on markers of thrombotic tendency in healthy human subjects. J Nutr. 2005;135(12):2805–11. [DOI] [PubMed] [Google Scholar]
- 40. Gill JMR, Brown JC, Caslake MJ, Wright DM, Cooney J, Bedford D, Hughes DA, Stanley JC, Packard CJ. Effects of dietary monounsaturated fatty acids on lipoprotein concentrations, compositions, and subfraction distributions and on VLDL apolipoprotein B kinetics: dose-dependent effects on LDL. Am J Clin Nutr. 2003;78(1):47–56. [DOI] [PubMed] [Google Scholar]
- 41. Cater NB, Denke MA. Behenic acid is a cholesterol-raising saturated fatty acid in humans. Am J Clin Nutr. 2001;73(1):41–4. [DOI] [PubMed] [Google Scholar]
- 42. Hunter KA, Crosbie LC, Weir A, Miller GJ, Dutta-Roy AK. A residential study comparing the effects of diets rich in stearic acid, oleic acid, and linoleic acid on fasting blood lipids, hemostatic variables and platelets in young healthy men. J Nutr Biochem. 2000;11(7–8):408–16. [DOI] [PubMed] [Google Scholar]
- 43. Snook JT, Park S, Williams G, Tsai Y-H, Lee N. Effect of synthetic triglycerides of myristic, palmitic, and stearic acid on serum lipoprotein metabolism. Eur J Clin Nutr. 1999;53(8):597–605. [DOI] [PubMed] [Google Scholar]
- 44. Müller H, Jordal O, Kierulf P, Kirkhus B, Pedersen JI. Replacement of partially hydrogenated soybean oil by palm oil in margarine without unfavorable effects on serum lipoproteins. Lipids. 1998;33(9):879–87. [DOI] [PubMed] [Google Scholar]
- 45. Schwab US, Vogel S, Lammi-Keefe CJ, Ordovas JM, Schaefer EJ, Li Z, Ausman LM, Gualtieri L, Goldin BR, Furr HCet al. Varying dietary fat type of reduced-fat diets has little effect on the susceptibility of LDL to oxidative modification in moderately hypercholesterolemic subjects. J Nutr. 1998;128(10):1703–9. [DOI] [PubMed] [Google Scholar]
- 46. Cater NB, Heller HJ, Denke MA. Comparison of the effects of medium-chain triacylglycerols, palm oil, and high oleic acid sunflower oil on plasma triacylglycerol fatty acids and lipid and lipoprotein concentrations in humans. Am J Clin Nutr. 1997;65(1):41–5. [DOI] [PubMed] [Google Scholar]
- 47. Sundram K, Ismail A, Hayes KC, Jeyamalar R, Pathmanathan R. Trans (elaidic) fatty acids adversely affect the lipoprotein profile relative to specific saturated fatty acids in humans. J Nutr. 1997;127(3):514S–20S. [DOI] [PubMed] [Google Scholar]
- 48. Schwab US, Maliranta HM, Sarkkinen ES, Savolainen MJ, Kesäniemi YA, Uusitupa MI. Different effects of palmitic and stearic acid-enriched diets on serum lipids and lipoproteins and plasma cholesteryl ester transfer protein activity in healthy young women. Metabolism. 1996;45(2):143–9. [DOI] [PubMed] [Google Scholar]
- 49. Temme EH, Mensink RP, Hornstra G. Comparison of the effects of diets enriched in lauric, palmitic, or oleic acids on serum lipids and lipoproteins in healthy women and men. Am J Clin Nutr. 1996;63(6):897–903. [DOI] [PubMed] [Google Scholar]
- 50. Choudhury N, Tan L, Truswell AS. Comparison of palmolein and olive oil: effects on plasma lipids and vitamin E in young adults. Am J Clin Nutr. 1995;61(5):1043–51. [DOI] [PubMed] [Google Scholar]
- 51. Sundram K, Hayes KC, Siru OH. Both dietary 18:2 and 16:0 may be required to improve the serum LDL/HDL cholesterol ratio in normocholesterolemic men. J Nutr Biochem. 1995;6(4):179–87. [Google Scholar]
- 52. Nestel P, Clifton P, Noakes M. Effects of increasing dietary palmitoleic acid compared with palmitic and oleic acids on plasma lipids of hypercholesterolemic men. J Lipid Res. 1994;35(4):656–62. [PubMed] [Google Scholar]
- 53. Zock PL, de Vries JH, Katan MB. Impact of myristic acid versus palmitic acid on serum lipid and lipoprotein levels in healthy women and men. Arterioscler Thromb. 1994;14(4):567–75. [DOI] [PubMed] [Google Scholar]
- 54. Denke MA, Grundy SM. Comparison of effects of lauric acid and palmitic acid on plasma lipids and lipoproteins. Am J Clin Nutr. 1992;56(5):895–8. [DOI] [PubMed] [Google Scholar]
- 55. Ng TK, Hassan K, Lim JB, Lye MS, Ishak R. Nonhypercholesterolemic effects of a palm-oil diet in Malaysian volunteers. Am J Clin Nutr. 1991;53(4):1015S–20S. [DOI] [PubMed] [Google Scholar]
- 56. Bonanome A, Grundy SM. Effect of dietary stearic acid on plasma cholesterol and lipoprotein levels. N Engl J Med. 1988;318(19):1244–8. [DOI] [PubMed] [Google Scholar]
- 57. Mattson FH, Grundy SM. Comparison of effects of dietary saturated, monounsaturated, and polyunsaturated fatty acids on plasma lipids and lipoproteins in man. J Lipid Res. 1985;26(2):194–202. [PubMed] [Google Scholar]
- 58. Baudet MF, Dachet C, Lasserre M, Esteva O, Jacotot B. Modification in the composition and metabolic properties of human low density and high density lipoproteins by different dietary fats. J Lipid Res. 1984;25(5):456–68. [PubMed] [Google Scholar]
- 59. Liu Y, Wang J, Zhang R, Zhang Y, Xu Q, Zhang J, Zhang Y, Zheng Z, Yu X, Jing Het al. A good response to oil with medium- and long-chain fatty acids in body fat and blood lipid profiles of male hypertriglyceridemic subjects. Asia Pac J Clin Nutr. 2009;18(3):351–8. [PubMed] [Google Scholar]
- 60. Xue C, Liu Y, Wang J, Zhang R, Zhang Y, Zhang J, Zhang Y, Zheng Z, Yu X, Jing Het al. Consumption of medium- and long-chain triacylglycerols decreases body fat and blood triglyceride in Chinese hypertriglyceridemic subjects. Eur J Clin Nutr. 2009;63(7):879–86. [DOI] [PubMed] [Google Scholar]
- 61. Nosaka N, Maki H, Suzuki Y, Haruna H, Ohara A, Kasai M, Tsuji H, Aoyama T, Okazaki M, Igarashi Oet al. Effects of margarine containing medium-chain triacylglycerols on body fat reduction in humans. J Atheroscler Thromb. 2003;10(5):290–8. [DOI] [PubMed] [Google Scholar]
- 62. Temme EH, Mensink RP, Hornstra G. Effects of diets enriched in lauric, palmitic or oleic acids on blood coagulation and fibrinolysis. Thromb Haemost. 1999;81(2):259–63. [PubMed] [Google Scholar]
- 63. Temme EH, Mensink RP, Hornstra G. Effects of medium chain fatty acids (MCFA), myristic acid, and oleic acid on serum lipoproteins in healthy subjects. J Lipid Res. 1997;38(9):1746–54. [PubMed] [Google Scholar]
- 64. Ghafoorunissa, Reddy V, Sesikaran B. Palmolein and groundnut oil have comparable effects on blood lipids and platelet aggregation in healthy Indian subjects. Lipids. 1995;30(12):1163–9. [DOI] [PubMed] [Google Scholar]
- 65. Tholstrup T, Marckmann P, Jespersen J, Vessby B, Jart A, Sandström B. Effect on blood lipids, coagulation, and fibrinolysis of a fat high in myristic acid and a fat high in palmitic acid. Am J Clin Nutr. 1994;60(6):919–25. [DOI] [PubMed] [Google Scholar]
- 66. Zock PL, Katan MB. Hydrogenation alternatives: effects of trans fatty acids and stearic acid versus linoleic acid on serum lipids and lipoproteins in humans. J Lipid Res. 1992;33(3):399–410. [PubMed] [Google Scholar]
- 67. Lv C, Wang Y, Zhou C, Ma W, Yang Y, Xiao R, Yu H. Effects of dietary palm olein on the cardiovascular risk factors in healthy young adults. Food Nutr Res. 2018;62:1353. [DOI] [PMC free article] [PubMed] [Google Scholar]
- 68. Judd JT, Baer DJ, Clevidence BA, Kris-Etherton P, Muesing RA, Iwane M. Dietary cis and trans monounsaturated and saturated FA and plasma lipids and lipoproteins in men. Lipids. 2002;37(2):123–31. [DOI] [PubMed] [Google Scholar]
- 69. Fattore E, Bosetti C, Brighenti F, Agostoni C, Fattore G. Palm oil and blood lipid–related markers of cardiovascular disease: a systematic review and meta-analysis of dietary intervention trials. Am J Clin Nutr. 2014;99(6):1331–50. [DOI] [PubMed] [Google Scholar]
- 70. Spady DK, Woollett LA, Dietschy JM. Regulation of plasma LDL-cholesterol levels by dietary cholesterol and fatty acids. Annu Rev Nutr. 1993;13:355–81. [DOI] [PubMed] [Google Scholar]
- 71. Larsen SV, Holven KB, Christensen JJ, Flatberg A, Rundblad A, Leder L, Blomhoff R, Telle-Hansen V, Kolehmainen M, Carlberg Cet al. Replacing saturated fat with polyunsaturated fat modulates peripheral blood mononuclear cell gene expression and pathways related to cardiovascular disease risk using a whole transcriptome approach. Mol Nutr Food Res. 2021;65(24):e2100633. [DOI] [PubMed] [Google Scholar]
- 72. Vafeiadou K, Weech M, Altowaijri H, Todd S, Yaqoob P, Jackson KG, Lovegrove JA. Replacement of saturated with unsaturated fats had no impact on vascular function but beneficial effects on lipid biomarkers, E-selectin, and blood pressure: results from the randomized, controlled Dietary Intervention and VAScular function (DIVAS) study. Am J Clin Nutr. 2015;102(1):40–8. [DOI] [PubMed] [Google Scholar]
- 73. Baer DJ, Judd JT, Clevidence BA, Tracy RP. Dietary fatty acids affect plasma markers of inflammation in healthy men fed controlled diets: a randomized crossover study. Am J Clin Nutr. 2004;79(6):969–73. [DOI] [PubMed] [Google Scholar]
- 74. Yu S, Derr J, Etherton TD, Kris-Etherton PM. Plasma cholesterol-predictive equations demonstrate that stearic acid is neutral and monounsaturated fatty acids are hypocholesterolemic. Am J Clin Nutr. 1995;61(5):1129–39. [DOI] [PubMed] [Google Scholar]
- 75. Baer DJ, Judd JT, Kris-Etherton PM, Zhao G, Emken EA. Stearic acid absorption and its metabolizable energy value are minimally lower than those of other fatty acids in healthy men fed mixed diets. J Nutr. 2003;133(12):4129–34. [DOI] [PubMed] [Google Scholar]
- 76. Rhee SK, Kayani AJ, Ciszek A, Brenna JT. Desaturation and interconversion of dietary stearic and palmitic acids in human plasma and lipoproteins. Am J Clin Nutr. 1997;65(2):451–8. [DOI] [PubMed] [Google Scholar]
- 77. Müller H, Kirkhus B, Pedersen JI. Serum cholesterol predictive equations with special emphasis on trans and saturated fatty acids. An analysis from designed controlled studies. Lipids. 2001;36(8):783–91. [DOI] [PubMed] [Google Scholar]
- 78. Dabadie H, Peuchant E, Bernard M, LeRuyet P, Mendy F. Moderate intake of myristic acid in sn-2 position has beneficial lipidic effects and enhances DHA of cholesteryl esters in an interventional study. J Nutr Biochem. 2005;16(6):375–82. [DOI] [PubMed] [Google Scholar]
- 79. Hu FB, Stampfer MJ, Manson JE, Ascherio A, Colditz GA, Speizer FE, Hennekens CH, Willett WC. Dietary saturated fats and their food sources in relation to the risk of coronary heart disease in women. Am J Clin Nutr. 1999;70(6):1001–8. [DOI] [PubMed] [Google Scholar]
- 80. Liu S, van der Schouw YT, Soedamah-Muthu SS, Spijkerman AMW, Sluijs I. Intake of dietary saturated fatty acids and risk of type 2 diabetes in the European Prospective Investigation into Cancer and Nutrition-Netherlands cohort: associations by types, sources of fatty acids and substitution by macronutrients. Eur J Nutr. 2019;58(3):1125–36. [DOI] [PMC free article] [PubMed] [Google Scholar]
- 81. Enser M, Hallett K, Hewitt B, Fursey GAJ, Wood JD. Fatty acid content and composition of English beef, lamb and pork at retail. Meat Sci. 1996;42(4):443–56. [DOI] [PubMed] [Google Scholar]
- 82. Kliem KE, Shingfield KJ, Livingstone KM, Givens DI. Seasonal variation in the fatty acid composition of milk available at retail in the United Kingdom and implications for dietary intake. Food Chem. 2013;141(1):274–81. [DOI] [PubMed] [Google Scholar]
- 83. Orsavova J, Misurcova L, Vavra Ambrozova J, Vicha R, Mlcek J. Fatty acids composition of vegetable oils and its contribution to dietary energy intake and dependence of cardiovascular mortality on dietary intake of fatty acids. Int J Mol Sci. 2015;16(12):12871–90. [DOI] [PMC free article] [PubMed] [Google Scholar]
- 84. Guo J, Astrup A, Lovegrove JA, Gijsbers L, Givens DI, Soedamah-Muthu SS. Milk and dairy consumption and risk of cardiovascular diseases and all-cause mortality: dose–response meta-analysis of prospective cohort studies. Eur J Epidemiol. 2017;32(4):269–87. [DOI] [PMC free article] [PubMed] [Google Scholar]
- 85. Soedamah-Muthu SS, de Goede J. Dairy consumption and cardiometabolic diseases: systematic review and updated meta-analyses of prospective cohort studies. Curr Nutr Rep. 2018;7(4):171–82. [DOI] [PMC free article] [PubMed] [Google Scholar]
Associated Data
This section collects any data citations, data availability statements, or supplementary materials included in this article.