

Abstract
Intronic polyadenylation (IPA) isoforms, which contain alternative last exons, are widely regulated in various biological processes and by many factors. However, little is known about their cytoplasmic regulation and translational status. In this study, we provide the first evidence that the genome-wide patterns of IPA isoform regulation during a biological process can be very distinct between the transcriptome and translatome, and between the nucleus and cytosol. Indeed, by 3′-seq analyses on breast cancer cells, we show that the genotoxic anticancer drug, doxorubicin, preferentially down-regulates the IPA to the last-exon (IPA:LE) isoform ratio in whole cells (as previously reported) but preferentially up-regulates it in polysomes. We further show that in nuclei, doxorubicin almost exclusively down-regulates the IPA:LE ratio, whereas in the cytosol, it preferentially up-regulates the isoform ratio, as in polysomes. Then, focusing on IPA isoforms that are up-regulated by doxorubicin in the cytosol and highly translated (up-regulated and/or abundant in polysomes), we identify several IPA isoforms that promote cell survival to doxorubicin. Mechanistically, by using an original approach of condition- and compartment-specific CLIP-seq (CCS-iCLIP) to analyze ELAVL1-RNA interactions in the nucleus and cytosol in the presence and absence of doxorubicin, as well as 3′-seq analyses upon ELAVL1 depletion, we show that the RNA-binding protein ELAVL1 mediates both nuclear down-regulation and cytosolic up-regulation of the IPA:LE isoform ratio in distinct sets of genes in response to doxorubicin. Altogether, these findings reveal differential regulation of the IPA:LE isoform ratio across subcellular compartments during drug response and its coordination by an RNA-binding protein.
The main pathway of eukaryotic pre-messenger RNA (pre-mRNA) 3′-end processing consists in transcript cleavage at the polyadenylation site, followed by the addition of a poly(A) tail at the 3′ end (Ogorodnikov et al. 2016; Tian and Manley 2017; Gruber and Zavolan 2019). The regulation of alternative polyadenylation (APA) sites within the last exon of genes, leading to mRNA isoforms with a longer or shorter 3′ untranslated region (3′ UTR), often called 3′ UTR-APA or tandem APA isoforms, has been widely studied (Ogorodnikov et al. 2016; Tian and Manley 2017; Gruber and Zavolan 2019). In addition, intronic polyadenylation (IPA), also called splicing-dependent APA, generates mRNA isoforms that terminate in proximal alternative last exons (ALEs), as opposed to mRNA isoforms ending in the last exon (LE) of genes and thus often impacts the coding region of mRNAs (Ogorodnikov et al. 2016; Tian and Manley 2017; Gruber and Zavolan 2019). The expression level of IPA isoforms relative to gene or LE expression levels is widely regulated in the transcriptome during several biological processes, such as cell proliferation (Sandberg et al. 2008; Elkon et al. 2012), cell differentiation (Cheng et al. 2020; Chen et al. 2021), and cancer (Lee et al. 2018; Singh et al. 2018). The IPA:LE isoform ratio is also regulated in many genes in response to DNA-damaging (genotoxic) agents and other stress inducers, with preferential up-regulation in the case of ultraviolet (UV-C) irradiation, preferential down-regulation for doxorubicin and anisomycin, and equal proportions of both patterns for camptothecin (Dutertre et al. 2014; Devany et al. 2016; Hollerer et al. 2016; Williamson et al. 2017). Conversely, the expression of many genes involved in the DNA damage response (DDR) is regulated at the IPA level, thus revealing a cross talk between IPA and the DDR (Dutertre et al. 2021).
The mechanisms of IPA isoform regulation have been mainly studied at the levels of pre-mRNA synthesis and maturation, with various regulatory factors identified, including transcription elongation, the U1 snRNP, cleavage/polyadenylation factors, and RNA-binding proteins (Ogorodnikov et al. 2016; Tian and Manley 2017; Gruber and Zavolan 2019). For example, IPA isoform regulation by UV-C is mediated at least in part by the inhibition of transcription elongation and of the U1 snRNP (Devany et al. 2016; Williamson et al. 2017). In addition, two studies have identified sets of IPA isoforms that were actively degraded in the nucleus (Ogami et al. 2017; Chiu et al. 2018). In contrast, very little is known about the cytoplasmic regulation and translation status of IPA isoforms. Genes with different IPA:LE isoform ratio in the cytosol versus nucleus were identified (Neve et al. 2016), and differential translation efficiency was associated with ALEs (Sterne-Weiler et al. 2013). Only two studies analyzed the dynamic regulation (upon DICER1 knockdown and during colon cancer progression) of the IPA:LE isoform ratio in the cytosol and nucleus, and similar patterns of regulation were found in both compartments (Neve et al. 2016; Fischl et al. 2019). Moreover, there was no study of dynamic regulation of IPA isoform abundance in the translatome (translation output) and of their translation efficiency. Thus, whether the IPA:LE isoform ratio may be differentially regulated genome-wide during biological processes, in the cytosol versus nucleus or in the translatome versus transcriptome, remains to be investigated.
Doxorubicin (Doxo), a topoisomerase II inhibitor and DNA-damaging agent widely used in breast cancer treatment, down-regulates the IPA:LE isoform ratio in many genes in whole-cells transcriptome, and its regulation of CENPN isoforms is mediated by an effect on nuclear transcript processing by the RNA-binding protein ELAV-like RNA binding protein 1 (ELAVL1), which is also known as Hu antigen R (HuR) (Dutertre et al. 2014). In the present study, in the context of breast cancer cell response to Doxo, we aimed to (1) determine the genome-wide regulation of IPA and LE isoforms in different cellular fractions and compartments (whole cells [transcriptome], nucleus, cytosol, and polysomes [translatome]); (2) identify Doxo-regulated IPA isoforms that are highly translated and that impact cell survival to Doxo; and (3) investigate whether ELAVL1 may coordinate IPA:LE isoform regulation in several compartments.
Results
Doxo widely regulates the IPA:LE isoform ratio in the transcriptome, with a global trend for down-regulation
A previous exon-array analysis identified 100 ALE events regulated by Doxo treatment in MCF-7 cells, and in 90% of events, Doxo down-regulated the proximal ALE (IPA) isoform compared to the LE isoform (Dutertre et al. 2014). To investigate more extensively IPA isoform regulation by Doxo in whole-cells transcriptome, we used the 3′-seq technique, which is more efficient than exon-arrays and RNA-seq for this type of event, and consists in targeted sequencing of the 3′ end of polyadenylated transcripts upstream of the poly(A) tail (Lianoglou et al. 2013). We analyzed whole-cell RNA from MCF-7 cells treated with either Doxo or vehicle for 6 h. Because 3′-seq analysis can give rise to internal priming artifacts, we used several approaches to identify genuine IPA isoform regulation events. First, focusing on abundant IPA isoforms (at least 5% of the LE isoform from the same gene), we identified 3400 IPA sites regulated by Doxo (P < 0.05), including 932 (27%) and 2468 (73%) cases of up- and down-regulation of the IPA:LE isoform ratio, respectively (Fig. 1A; Supplemental Table S1). Second, focusing on annotated IPA sites (Wang et al. 2018; Herrmann et al. 2020), we identified 1207 regulated IPA events, including 421 (35%) and 786 (65%) cases of up- and down-regulation of the IPA:LE isoform ratio, respectively (Supplemental Fig. S1A; Supplemental Table S1). In addition, we validated by RT-qPCR various up-regulation events identified by 3′-seq (Supplemental Fig. S1C, and see below). These data confirm and largely extend the previously reported trend for IPA:LE isoform ratio down-regulation by Doxo in the transcriptome (Dutertre et al. 2014). However, they also reveal that a significant subset of Doxo-regulated IPA:LE events are up-regulation events.
Figure 1.

IPA:LE isoform ratio up-regulation by Doxo is more prevalent in the translatome than in the transcriptome. (A,B) Identification of IPA isoforms regulated by Doxo relative to matched last-exon isoform (IPA:LE ratio) by 3′-seq on whole MCF-7 cells and polysomes. Only abundant IPA isoforms (equalizing at least 5% of matched LE isoform) are shown. (C) Venn diagram comparing IPA:LE regulation events by Doxo in whole cells and polysomes. (D) Visualization of 3′-seq and total-RNA-seq data for the HOMEZ gene in the UCSC Genome Browser and Integrative Genomics Viewer, respectively. (E,F) RT-qPCR analysis of IPA:LE isoform ratio regulation by Doxo in the indicated genes in whole cells and in polysomes. Data on individual isoforms are also shown for HOMEZ. (*) P < 0.05; (***) P < 0.001.
IPA:LE isoform ratio up-regulation by Doxo is more prevalent in the translatome than in the transcriptome
Then, to investigate IPA regulation by Doxo in the translatome, we carried out 3′-seq analysis on polysome-associated RNA. Focusing on abundant IPA isoforms, we identified 661 IPA sites regulated by Doxo (P < 0.05), including 493 (75%) and 168 (25%) cases of up- and down-regulation of the IPA:LE isoform ratio, respectively (Fig. 1B; Supplemental Table S2). Focusing on annotated IPA sites, we identified 679 regulated IPA events, including 440 (65%) and 239 (35%) cases of up- and down-regulation of the IPA:LE isoform ratio, respectively (Supplemental Fig. S1B; Supplemental Table S2). Thus, the proportion of up- versus down-regulation of the IPA:LE isoform ratio by Doxo was much higher in the translatome (about 70%) than in the transcriptome (about 30%) (Fig. 1A,B; Supplemental Fig. S1A,B). Most cases of IPA:LE isoform ratio up-regulation that were found in the translatome were not found in the transcriptome (Fig. 1C).
We validated by RT-qPCR several events of IPA:LE isoform ratio up-regulation identified in polysomes by 3′-seq. For example, in the HOMEZ gene, 3′-seq detected a nonannotated yet highly expressed IPA (Fig. 1D). Total-RNA-seq confirmed the high expression of this isoform and identified the exon (proximal ALE) that is associated with this IPA (Fig. 1D, bottom). By RT-qPCR, the HOMEZ IPA:LE isoform ratio was increased by 6.1-fold by Doxo in polysomal RNA and was not affected in whole-cell RNA (Fig. 1E). Additional examples in the LDLRAD4, ADARB1, HAPSTR1 (also known as C16orf72), and CCNL2 genes are shown in Figure 1F and Supplemental Figure S1, D–H. Altogether, our data indicate that up-regulation (compared to down-regulation) of the IPA:LE isoform ratio by Doxo is more prevalent in the translatome than in the transcriptome.
IPA:LE isoform ratio up-regulation by Doxo is more prevalent in the cytosol than in the nucleus
The higher prevalence of IPA:LE isoform ratio up-regulation by Doxo in the translatome than in the transcriptome may be due to a difference in regulation pattern either between the nucleus and cytosol, or between the cytosol and polysomes (implying a regulation at the level of translation efficiency) (see below). To investigate the first hypothesis, we carried out 3′-seq analysis on both nuclear and cytosolic fractions of MCF-7 cells treated with either Doxo or vehicle for 6 h. When focusing on annotated IPA sites, looking at IPA:LE isoform ratio regulation by Doxo, only 2% (11/448) of events found in the nucleus were up-regulation events (Supplemental Fig. S2A, left panel; Supplemental Table S3). In contrast, 60% (618/1032) of events found in the cytosol were up-regulation events (Supplemental Fig. S2A, middle panel; Supplemental Table S4). This difference between nucleus and cytosol was not due to a delay in nucleo-cytosolic export of down-regulated IPA isoforms, because 63% (709/1134) of events found in the cytosol at 18 h of Doxo treatment were up-regulation events (Supplemental Fig. S2A, right panel; Supplemental Table S5).
We then analyzed abundant IPA isoforms. For this, because nuclear RNA is expected to be more prone to 3′-seq artifacts than cytosolic RNA due to internal priming on intronic stretches of A, we only considered those nuclear regulation events that were also found in the cytosol and compared them with cytosol-specific regulation events. Whereas 71% (1281/1797) of cytosol-specific IPA:LE regulation events were up-regulation events (Fig. 2A, right panel, “Cyto not Nuc”), only 7% (8/123) of the IPA:LE regulation events found in both the nucleus and cytosol were up-regulation events (Fig. 2A, left panel, “Cyto and Nuc”). Thus, IPA:LE isoform ratio up-regulation appears to be almost exclusively found in the cytosol, not in the nucleus. We validated events belonging to this category by RT-qPCR analysis on the HOMEZ, LDLRAD4, ADARB1, HAPSTR1, and CCNL2 genes. In MCF-7 cells, Doxo up-regulated the IPA:LE isoform ratio in the cytosol but not in the nucleus, where it was often decreased (Fig. 2B,C; Supplemental Fig. S2B). Similarly, in JIMT1 cells, RT-qPCR analysis of these five genes showed that Doxo down-regulated the IPA:LE isoform ratio in the nucleus and tended to up-regulate it in the cytosol (Supplemental Fig. S2C). We validated additional events of IPA:LE ratio up-regulation in the cytosol of MCF-7 cells (see below, Fig. 6D).
Figure 2.
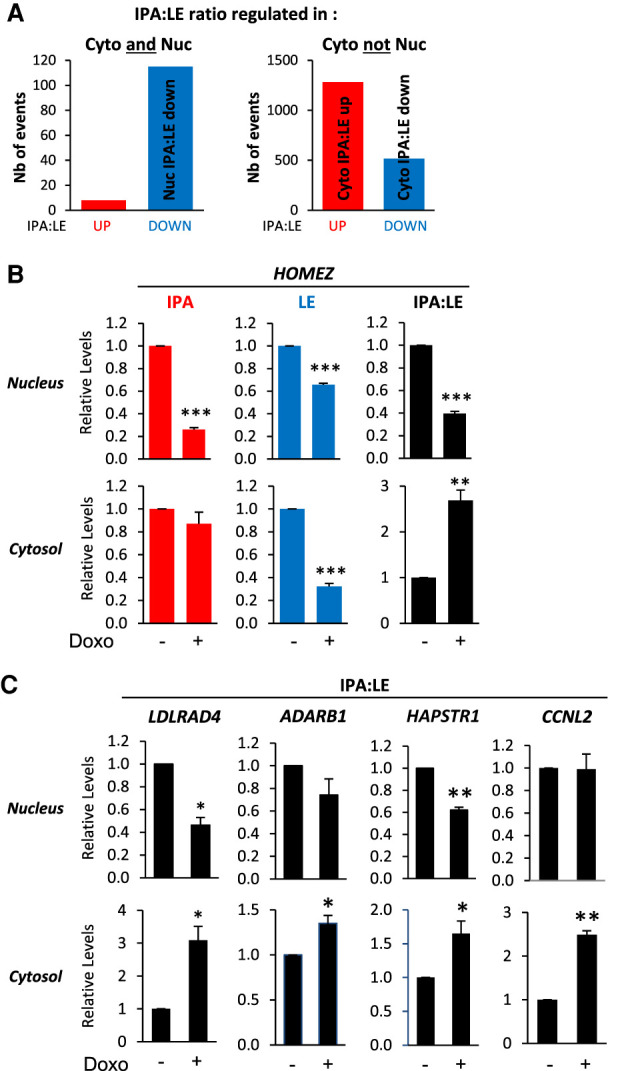
IPA:LE isoform ratio up-regulation by Doxo is more prevalent in the cytosol than in the nucleus. (A) Identification by 3′-seq on MCF-7 cells of abundant IPA isoforms that are regulated by Doxo relative to matched last-exon isoform (IPA:LE ratio) in both cytosol (Cyto) and nucleus (Nuc) or in the cytosol only. The three most prevalent patterns of regulation are indicated. (B,C) RT-qPCR analysis of IPA:LE isoform ratio regulation by Doxo in the indicated genes in the nucleus and cytosol of MCF-7 cells. Data on individual isoforms are also shown for HOMEZ. (*) P < 0.05; (**) P < 0.01; (***) P < 0.001.
Figure 6.

ELAVL1 coordinately regulates IPA isoforms in the nucleus and cytosol in response to Doxo. (A) Intersection of the three main categories of Doxo-regulated IPAs (Cyto IPA:LE up, Cyto IPA:LE down, and Nuc IPA:LE down, as identified by 3′-seq in Fig. 2A) with nuclear and cytosolic Doxo-regulated ELAVL1 binding sites located in IPA and LE regions (as indicated at the bottom). Plotted is the percentage of Doxo-regulated IPAs of each category that have a Doxo-regulated ELAVL1 binding site in the indicated region. (B) Identification of abundant IPA isoforms for which the IPA:LE ratio is regulated by siELAVL1 when compared to siCTRL, by 3′-seq analysis on cytosol of MCF-7 cells grown either without or with Doxo. (C) Intersection of the three main categories of Doxo-regulated IPAs (Cyto IPA:LE up, Cyto IPA:LE down, and Nuc IPA:LE down) with siELAVL1-regulated IPAs. (D) RT-qPCR analysis of the effects of Doxo and siELAVL1 on the cytosolic IPA:LE isoform ratio in the indicated genes. (*) P = 0.06; (**) P < 0.01.
Thus, our 3′-seq analyses on nucleus and cytosol identified two markedly different patterns of IPA:LE isoform ratio regulation in response to Doxo (Fig. 2A). The first pattern (hereafter referred to as “Nuc IPA:LE down”) is down-regulation of the IPA:LE isoform ratio in both the nucleus and cytosol (Supplemental Table S6), suggesting a nuclear mechanism, as previously described for CENPN (Dutertre et al. 2014). The second pattern (“Cyto IPA:LE up”) is up-regulation of the IPA:LE isoform ratio in the cytosol but not in the nucleus (Supplemental Table S7). In addition, our 3′-seq analyses identified a third pattern (“Cyto IPA:LE down”) that is down-regulation of the IPA:LE isoform ratio in the cytosol but not in the nucleus (Fig. 2A; Supplemental Table S8). Analysis of gene function enrichment indicated that all three patterns were enriched to some extent in functions related to the DDR and cell cycle (Supplemental Fig. S2D), suggesting that they may all contribute to cell responses to Doxo.
Identification and function of Doxo-up-regulated IPA isoforms that are highly translated
To determine whether the higher prevalence of IPA:LE isoform ratio up-regulation by Doxo in the translatome than in the transcriptome (Fig. 1A,B; Supplemental Fig. S3A) can be explained in part by its higher prevalence in the cytosol than in the nucleus (Fig. 2A; Supplemental Fig. S2A), we compared the IPA isoforms that were regulated in the cytosol with the IPA isoforms that were regulated in polysomes. Out of 762 abundant IPA isoforms that were up-regulated (relative to LE isoform) in polysomes at either 6 or 18 h of Doxo treatment (Supplemental Tables S2, S9), 197 (26%) were also up-regulated by Doxo in the cytosol (Fig. 3A; Supplemental Table S10). Examples that we validated by RT-qPCR are found in the LDLRAD4, ADARB1, HAPSTR1, CCNL2, and HOMEZ genes (Fig. 3B). Thus, the higher prevalence of IPA:LE isoform ratio up-regulation by Doxo in the translatome than in the transcriptome can be explained in part by its higher prevalence in the cytosol than in the nucleus. It may also be due in part to differences between IPA and LE isoforms in terms of regulation at the level of translation efficiency, because 565 abundant IPA isoforms were up-regulated by Doxo (relative to LE) in polysomes but not in the cytosol (Fig. 3A). An example that we validated by RT-qPCR is found in the WNK2 gene (Supplemental Fig. S3B).
Figure 3.

Identification and function of Doxo-up-regulated IPA isoforms that are highly translated. (A) Venn diagram comparing IPA:LE up-regulation events by Doxo in the cytosol (not nucleus) and in polysomes, at either 6 or 18 h of Doxo treatment. (B) RT-qPCR analysis of IPA:LE isoform ratio regulation by Doxo in the indicated genes in the cytosol and polysomes at 0, 6, or 18 h of Doxo treatment. The data represent the relative abundance of IPA to LE isoforms. (C) Relative translation efficiency (TE), that is the polysome to cytosol ratio of abundance, of IPA and LE isoforms measured by 3′-seq at 0, 6, or 18 h of Doxo treatment. Only IPA isoforms whose abundance equalizes at least 5% of matched LE isoforms are shown. (D) Venn diagram comparing IPA:LE up-regulation events by Doxo in the cytosol to IPA isoforms that have a high TE and are at least 25% as abundant as matched LE isoform in polysomes at either 0, 6, or 18 h of Doxo treatment. (E–G) Effects of siRNAs targeting IPA isoforms of the indicated genes in MCF-7 cells. Two independent siRNAs (siIPA#1 and #2) were tested for each isoform. In panels E and F, the data in the presence of a negative-control siRNA (siCTRL) were set to 100%. The statistical tests are comparing siIPA data to siCTRL data. (E) Effects of siRNAs on IPA isoform abundance, as measured by RT-qPCR and normalized to TBP levels. (F) Effects of siRNAs on cell viability in the absence of Doxo, as measured by WST-1 assay. (G) Cell survival to Doxo, as measured by cell viability in the presence of Doxo normalized to cell viability in the absence of drug. For PATZ1, P-value is below 0.05 when combining data from both siRNAs. (*) P = 0.06; (**) P < 0.01; (***) P < 0.001.
Because little is known about the translation of IPA isoforms on a genome-wide scale, we sought to identify IPA isoforms that were efficiently translated. About 90% of the IPA sites regulated by Doxo in polysomes lie within the annotated coding sequence (CDS) of the corresponding genes (Supplemental Tables S2, S9). Using the ratio of isoform abundance in polysomes versus cytosol as a proxy for translation efficiency as in previous studies (Boussemart et al. 2014), we found that the majority of detected IPA isoforms were at least as efficiently (rarely more) translated as the matched LE isoform (Fig. 3C; Supplemental Fig. S3C; Supplemental Tables S11–S13). Among 1281 IPA isoforms that were up-regulated (relative to LE) by Doxo in the cytosol, 344 were highly translated; indeed, when compared to the matched LE isoform, they were nearly as efficiently translated and nearly as abundant in polysomes, at least at one time point (Fig. 3D; Supplemental Table S14). This is illustrated by RT-qPCR analysis of the LDLRAD4, ADARB1, HAPSTR1, CCNL2, and HOMEZ genes, for which the IPA:LE isoform ratio was close to 1 in polysomes following Doxo treatment for 18 h (Fig. 3B). The 197 and 344 IPA isoforms identified in Figure 3, A and D, respectively, were enriched in genes involved in specific functions, especially transcription regulation, DNA binding, chromatin binding, chromosome, and centrosome (Supplemental Fig. S3D,E).
To identify IPA isoforms that may have a function in cell response to Doxo, we designed isoform-specific siRNAs targeting nine IPA isoforms (within their last exon, which is absent in the corresponding LE isoform) that are up-regulated by Doxo in the cytosol and that are up-regulated and/or abundant in polysomes. For eight IPA isoforms, we obtained two independent siRNAs that efficiently depleted the isoform (Fig. 3E). In addition, for two genes (PATZ1 and MAP3K5), we were able to detect abundant and siRNA-sensitive IPA isoforms at the protein level by western blot (Supplemental Fig. S3F). We then determined the effects of IPA-targeting siRNAs on cell viability in the absence and presence of Doxo. For three IPA isoforms (HOMEZ, CCNL2, PATZ1), both siRNAs significantly decreased cell growth in the absence of Doxo, when compared to a control siRNA (Fig. 3F). More importantly, for five IPA isoforms, both siRNAs decreased cell survival to Doxo (i.e., cell viability in the presence of Doxo normalized to cell viability in the absence of the drug) either slightly (in the case of ADARB1, HOMEZ, and PATZ1) or strongly (BRWD1 and SYDE2) when compared to the control siRNA (Fig. 3G). These data identify IPA isoforms that are up-regulated by Doxo, are highly translated, and promote cell survival to Doxo.
Altogether, our data identify a set of IPA isoforms that were up-regulated by Doxo (relative to the LE isoform) in the cytosol, including a subset that were efficiently translated. We then sought to identify molecular mechanisms underlying cytosol-specific up-regulation of the IPA:LE isoform ratio. Because nuclear down-regulation of the IPA:LE isoform ratio in the CENPN gene in response to Doxo was mediated at least in part by ELAVL1 acting at the level of pre-mRNA processing (Dutertre et al. 2014), and because ELAVL1 can regulate additional steps of mRNA metabolism (e.g., cytoplasmic stability, nuclear export) through binding to mRNAs especially in their 3′ UTRs (Grammatikakis et al. 2017), we decided to investigate whether ELAVL1 may mediate IPA:LE isoform ratio regulation in response to Doxo at both nuclear and cytoplasmic levels.
The IPA:LE isoform ratio is widely and directly regulated by ELAVL1
Toward this aim, and because little is known about IPA isoform regulation by ELAVL1 besides its effect on CENPN, we first analyzed on a genome-wide scale the impact of ELAVL1 on the IPA:LE isoform ratio in the absence of Doxo. For this, MCF-7 cells were transfected for 48 h with an siRNA targeting ELAVL1 (siELAVL1), resulting in strong depletion of ELAVL1 at the protein level when compared to cells transfected with a negative-control siRNA (Fig. 4A). 3′-seq analysis on whole-cell RNA identified 1266 and 1206 abundant (297 and 406 annotated) IPA isoforms that were up- and down-regulated compared to the LE isoform by ELAVL1 depletion, respectively (Fig. 4B; Supplemental Fig. S4A; Supplemental Table S15). The functional annotation of the genes bearing these regulation events showed some overlap with Doxo regulation events (Supplemental Fig. S4B).
Figure 4.

The IPA:LE isoform ratio is widely and directly regulated by ELAVL1. (A) Western blot analysis of ELAVL1 protein levels in MCF-7 cells transfected with an siRNA targeting ELAVL1 (siELAVL1) or a negative-control siRNA (siCTRL). (B) Identification by 3′-seq on whole MCF-7 cells of abundant IPA isoforms, for which the IPA:LE ratio is regulated by siELAVL1 when compared to siCTRL. (C) Venn diagram comparing the peaks found in two biological replicates of ELAVL1 iCLIP in whole MCF-7 cells. Overlapping peaks were considered ELAVL1 binding sites. The most enriched motif is shown. (D) Venn diagram comparing the peaks found in two biological replicates of iCLIP using nonspecific immunoglobulin (IgG). (E) Density of ELAVL1 binding sites in exons, introns, 3′ UTRs overlapping introns, and 3′ UTRs overlapping the last exon of genes. (F) Fraction of genes that have an ELAVL1 binding site in the indicated IPA or LE region, among the genes that are either up- or down-regulated by siELAVL1 at the level of IPA:LE isoform ratio. (G) RT-qPCR analysis of the effect of ELAVL1 siRNA on the IPA:LE isoform ratio in the CELSR1 gene. (H) Visualization of 3′-seq, iCLIP, and total RNA-seq data for the CELSR1 gene in the UCSC Genome Browser.
To determine whether these effects may be mediated by ELAVL1 binding to target RNAs, we carried out iCLIP analysis of ELAVL1 on whole-cell RNA. Two replicates were made, thus identifying 121,344 reproducible ELAVL1 binding sites, with enrichment in a U-rich motif, in agreement with previous studies (Fig. 4C; Kishore et al. 2011; Lebedeva et al. 2011; Mukherjee et al. 2011). In parallel, we carried out our iCLIP procedure with a nonspecific IgG (Supplemental Fig. S4C–E), which yielded only 2771 reproducible peaks (Fig. 4D), thus supporting the specificity of our ELAVL1 iCLIP.
Mapping of ELAVL1 binding sites showed a twofold enrichment in LE-associated 3′ UTRs relative to exons on a genome-wide scale (Fig. 4E), which is consistent with previous genome-wide CLIP studies and with the known ability of ELAVL1 to regulate post-transcriptional gene expression through binding to LE-associated 3′ UTRs (Grammatikakis et al. 2017). We also found a similar twofold enrichment of ELAVL1 binding in IPA-associated 3′ UTRs relative to introns (Fig. 4E). To determine whether ELAVL1 regulation of the IPA:LE isoform ratio (Fig. 4B) might be due to direct binding to either IPA or LE regions, we crossed our 3′-seq and iCLIP data sets. For this, the “LE region” was defined as the whole LE, and the “IPA region” was defined as the region from the upstream exon-intron boundary to the IPA site (Fig. 4F). About 50% of IPA:LE events that were regulated (either up or down) by siELAVL1 in 3′-seq had ELAVL1 binding sites in the IPA region in iCLIP (Fig. 4F, left panel), and a similar proportion had ELAVL1 binding sites in the LE region (Fig. 4F, right panel; Supplemental Fig. S4F). These data suggest that ELAVL1 can regulate the IPA:LE isoform ratio by directly binding to either the IPA or LE region. In some genes, ELAVL1 bound both the IPA and LE regions, as illustrated by the CELSR1 gene, where siELAVL1 up-regulates an IPA within annotated intron 1 relative to LE and ELAVL1 specifically binds both the IPA and LE regions, but no other regions in the gene (Fig. 4G,H).
Altogether, the data from this part show that ELAVL1 regulates the IPA:LE isoform ratio in many genes and suggest that these regulations may be mediated by ELAVL1 binding in either IPA or LE regions. We then sought to determine the global role of ELAVL1 in IPA:LE isoform ratio regulation in response to Doxo.
Doxo globally rewires ELAVL1 binding to RNA within cells, with a shift toward exonic and cytosolic RNA
ELAVL1 has been involved in cell responses to several genotoxic agents (Latorre et al. 2012; Grammatikakis et al. 2017). ELAVL1 depletion with two independent siRNAs decreased MCF-7 cell growth and, more importantly for this study, the amplitude of cell growth inhibition by Doxo (Fig. 5A). In addition, in response to Doxo, ELAVL1 was partially translocated from the nucleus to cytosol (Fig. 5B), in agreement with previous studies (Latorre et al. 2012; Dutertre et al. 2014).
Figure 5.

Doxo globally rewires ELAVL1 binding to RNA within cells, with a shift toward exonic and cytosolic RNA. (A) MCF-7 cell growth following transfection with siRNAs targeting ELAVL1 (siELAVL1) or a negative-control siRNA (siCTRL) and subsequent treatment with Doxo or vehicle for the indicated time point. Cells proliferate more in the siCTRL-Doxo condition than in the other ones. (B) Western blot analysis of ELAVL1 protein levels in nuclear and cytosolic fractions of MCF-7 cells transfected with the indicated siRNAs and treated with Doxo or vehicle for 6 h. GAPDH and lamins were used as cytosolic and nuclear markers, respectively. (C) Experimental design of CCS-iCLIP analyses of ELAVL1-RNA interactions in different fractions of MCF-7 cells treated with Doxo or vehicle for 6 h. (Tot) Total cells (whole cells), (Nuc) nucleus, (Cyto) cytosol. (D) Number of ELAVL1 binding sites (peaks found in two biological replicates) identified in each fraction of vehicle-treated cells. (E) Density of nuclear and cytosolic ELAVL1 binding sites from vehicle-treated cells in exons, introns, 3′ UTRs overlapping introns, and 3′ UTRs overlapping the last exon of genes. (F) Proportion of ELAVL1 binding sites from each fraction that are either up- or down-regulated by Doxo treatment. (G) Density of Doxo up- and down-regulated ELAVL1 binding sites from total cells in exons, introns, 3′ UTRs overlapping introns, and 3′ UTRs overlapping the last exon of genes.
To determine whether ELAVL1 may mediate cytosolic up-regulation of the IPA:LE isoform ratio by Doxo in some genes, in addition to mediating nuclear down-regulation of the IPA:LE isoform ratio in other genes (Dutertre et al. 2014), we used several genome-wide approaches based on iCLIP and 3′-seq. In particular, we set up a condition- and compartment-specific CLIP-seq analysis (CCS-iCLIP) to determine the effects of Doxo treatment on ELAVL1 binding to transcripts (e.g., in IPA and LE regions) in several cell fractions, namely whole cells (total), nucleus, and cytosol (Fig. 5C). For this, MCF-7 cells were treated with Doxo or vehicle for 6 h, and ELAVL1 iCLIP experiments were carried out on two biological replicates for every condition (Doxo and vehicle) and cell fraction (Supplemental Fig. S5A–C) (it should be noted that the iCLIP data in vehicle-treated total cells, which were presented above in Fig. 4, are part of this large iCLIP data set).
As this CCS-iCLIP data set is quite extensive and unique, we first made a broad analysis of ELAVL1-RNA interactions across compartments and conditions before focusing on the link between ELAVL1 binding and IPA:LE isoform regulation. In the absence of Doxo, there were about seven times more ELAVL1 binding sites in the nucleus than in the cytosol (Fig. 5D; Supplemental Fig. S5C) (of note, many nuclear binding sites were not detected in total, likely due to dilution of the nuclear material in total lysate). This result is consistent with the fact that ELAVL1 was mainly localized in the nucleus (Fig. 5B) and with the large number of binding sites in introns (Fig. 5E) (in this panel, introns are underrepresented because they are about 18 times longer than exons and data are plotted per kb; thus, the strong difference between nucleus and cytosol for introns in panel E explains the strong difference between nucleus and cytosol in panel D). In the three fractions, there were more ELAVL1 binding sites that were up-regulated by Doxo (adjusted P < 0.05) than down-regulated ones (Fig. 5F). (In Fig. 5F, the data are given as percentages, explaining why total is not the sum of nucleus and cytosol; the percentage of regulated binding sites is lower in total, probably because many binding sites are preferentially regulated in one compartment; and the high percentage of regulated binding sites in cytosol is not seen in total because there are only few binding sites in cytosol when compared to total.) The proportion of up- versus down-regulated binding sites was higher in the cytosol than in the nucleus (twofold vs. 1.5-fold) (Fig. 5F). This indicates that in response to Doxo, ELAVL1 binding partially shifted from the nucleus to the cytosol, which is consistent with the partial relocalization of ELAVL1 to the cytosol (Fig. 5B). In addition, in both whole cells and nuclei, the proportion of up- versus down-regulated binding sites (by Doxo) was higher in exons than in introns (Fig. 5G, showing data per kb; Supplemental Fig. S5D,E). As a result, ELAVL1 binding partially shifted from introns to exons (Supplemental Fig. S5F). Thus, Doxo globally rewires ELAVL1 binding to RNA within cells, with a shift toward exonic and cytosolic RNA.
We also looked at ELAVL1 binding sites in IPA- and LE-associated 3′ UTRs. In total cells, either vehicle- or Doxo-treated, ELAVL1 binding sites were enriched in both IPA- and LE-associated 3′ UTRs, when compared to introns and exons, respectively (Supplemental Fig. S5F). In addition, in both whole cells and nuclei, ELAVL1 binding events that were up-regulated by Doxo—but not down-regulated ones—were enriched in IPA-associated 3′ UTRs compared to introns, and in LE-associated 3′ UTRs compared to exons (Fig. 5G; Supplemental Fig. S5D,E). Thus, ELAVL1 binding to both IPA- and LE-associated 3′ UTRs was more often up- than down-regulated in response to Doxo (Fig. 5G).
ELAVL1 coordinately regulates IPA isoforms in the nucleus and cytosol in response to Doxo
Then, to determine whether Doxo regulation of the IPA:LE isoform ratio in the nucleus and cytosol may be explained by Doxo-regulated binding of ELAVL1 to either IPA or LE regions in these compartments, we crossed our CCS-iCLIP data sets (Fig. 5) with our three main types of IPA:LE isoform ratio regulation by Doxo in 3′-seq: Nuc IPA:LE down, Cyto IPA:LE up, and Cyto IPA:LE down (Fig. 2A). For this, we used the same windows as in Figure 4F for the IPA and LE regions. In each compartment, we analyzed four potential patterns of ELAVL1-RNA binding regulation in response to Doxo: up- and down-regulation of ELAVL1 binding in the IPA region, and up- and down-regulation of ELAVL1 binding in the LE region (Fig. 6A).
For those IPA:LE regulation events by Doxo that occur in the nucleus (Nuc IPA:LE down events), we focused our analysis of ELAVL1 binding regulation on the nucleus. Among the four potential binding regulation patterns, only one—that is, down-regulated binding in the IPA region—was specifically enriched in nuclear IPA:LE down-regulation events, when compared to Cyto IPA:LE up and down events (Fig. 6A, left panel; Supplemental Table S16). This finding is consistent with the previous report that Doxo decreases ELAVL1 binding to the IPA region of the CENPN gene, in which the nuclear IPA:LE isoform ratio was decreased by either Doxo treatment or ELAVL1 depletion (Dutertre et al. 2014). (We also noted that nuclear ELAVL1 binding sites were frequently up-regulated in the LE region, but the relevance of this pattern is less clear, because it was also frequent among Cyto IPA:LE up and down events [Fig. 6A, left panel].) Thus, our data identify a set of genes where Doxo may down-regulate the IPA:LE isoform ratio in the nucleus through decreased binding of ELAVL1 to the IPA region in the nucleus, as we previously described for the CENPN gene (Dutertre et al. 2014).
For those IPA:LE regulation events by Doxo that occur in the cytosol (Cyto IPA:LE up and Cyto IPA:LE down events), we focused our analysis of ELAVL1 binding regulation on the cytosol. Among the four potential binding regulation patterns, only one—that is, down-regulated binding in the LE region—was specifically enriched in Cyto IPA:LE up events when compared to Cyto IPA:LE down and Nuc IPA:LE down events (Fig. 6A, right panel; 127 events listed in Supplemental Table S17). Conversely, up-regulated cytosolic binding in the LE region was slightly enriched in Cyto IPA:LE down events when compared to Cyto IPA:LE up events (Fig. 6A, right panel). These patterns of ELAVL1 binding regulation by Doxo are consistent with the well-known ability of ELAVL1 to increase cytoplasmic mRNA stability upon binding to the 3′ UTR (see Discussion), but in principle, they could be either a cause or a consequence of isoform abundance regulation by Doxo.
Thus, to determine whether the regulation of ELAVL1 binding by Doxo observed above may mediate IPA:LE isoform regulation by Doxo, we carried out 3′-seq on the cytosol of cells transfected for 48 h with siELAVL1 or a negative-control siRNA, and treated for 6 h with or without Doxo. This analysis identified 610 and 458 abundant (642 and 554 annotated) IPA isoforms that were regulated by siELAVL1 when compared to siCtrl cells in the absence and presence of Doxo, respectively, with approximately equal numbers of up- and down-regulation events (Fig. 6B; Supplemental Fig. S6A; Supplemental Tables S18, S19). Between 21% and 31% of the IPA:LE regulation events induced by Doxo (either Nuc IPA:LE down, Cyto IPA:LE up, or Cyto IPA:LE down) were also regulated by siELAVL1 (Fig. 6C; Supplemental Table S20). Focusing on the 127 cytosolic events, where Doxo up-regulated the IPA:LE isoform ratio and down-regulated ELAVL1 binding to LE (Fig. 6A), 39 (31%) of them were regulated by siELAVL1 (Fig. 6C, right panel), suggesting that ELAVL1 mediates the Doxo effect on the isoform ratio. From these 39 events, we validated by RT-qPCR for five genes (out of six tested), including PATZ1, BRWD1, GAREM1, HOMEZ, and SYDE2, that Doxo up-regulated the IPA:LE isoform ratio in the cytosol, and that this effect was prevented at least partially by ELAVL1 depletion (Fig. 6D). Altogether, our data show that Doxo regulates the IPA:LE isoform ratio of different sets of genes at nuclear and cytosolic levels and that ELAVL1 coordinates a considerable fraction of both the nuclear and cytosolic effects of Doxo.
Discussion
Although IPA isoforms are widely regulated at the level of nuclear RNA processing and in various biological conditions, such as cell response to genotoxic agents, little is known about their cytoplasmic and translational regulation during biological processes. In this study, we show that Doxo elicits different global patterns of IPA:LE isoform regulation in different subcellular compartments or fractions (e.g., preferential down-regulation in whole cells and nucleus, and preferential up-regulation in cytosol and polysomes) and that the RNA-binding protein ELAVL1 coordinates in part the nuclear and cytosolic effects of Doxo on IPA:LE isoform ratio.
The up-regulation of the IPA:LE isoform ratio in the cytosol, but not in the nucleus, that we observed in response to Doxo and that appears to be mediated by ELAVL1 in a subset of cases, could be mediated by the regulation of various RNA processes that need to be explored in future studies. A first potential mechanism, especially for the frequent cases where Doxo decreases ELAVL1 binding to the LE in the cytosol, would be that Doxo destabilizes the LE (not the IPA) isoform in the cytosol. Indeed, this fits with the well-known ability of ELAVL1 to increase the stability of many mRNAs by binding to their 3′ UTR (Grammatikakis et al. 2017). A second, related mechanism would be that Doxo stabilizes the IPA (not the LE) isoform in the cytosol. This would not be mediated by ELAVL1, because Doxo did not frequently up-regulate ELAVL1 binding to the IPA region in the cytosol (Fig. 6A); but Doxo may regulate IPA isoform binding to other factors (e.g., RNA-binding proteins or microRNAs) that regulate mRNA stability. To test these two hypotheses pertaining to mRNA isoform stability, we treated cells with or without Doxo for 6 h and then with or without actinomycin D (a transcription inhibitor) for another 6 h, and analyzed by RT-qPCR the IPA:LE isoform ratio in five genes that have a Doxo-induced IPA:LE ratio, including three genes where Doxo either decreases (PATZ1, GAREM1) or increases (CELSR1) ELAVL1 binding to the LE in the cytosol. In some genes (CELSR1, GAREM1), the IPA:LE isoform ratio was increased by actinomycin D alone, suggesting a higher stability of the IPA than LE isoform transcript (Supplemental Fig. S6B). However, for the five tested genes, Doxo pretreatment did not increase the actinomycin D effect on the IPA:LE isoform ratio, suggesting that Doxo does not destabilize the LE isoform or stabilize the IPA isoform (Supplemental Fig. S6B).
A third mechanism would be that Doxo regulates the export of transcript isoforms. For example, in the many cases where Doxo increases ELAVL1 binding to the LE in the nucleus (Fig. 6A), Doxo might decrease the export of the LE isoform, although ELAVL1 was previously shown to promote the nuclear export of mRNAs (Gallouzi and Steitz 2001). APA was shown to impact mRNA export through 3′ UTR binding to SR proteins and nuclear RNA export factor 1 (NXF1) (Müller-McNicoll et al. 2016). A fourth mechanism would be that Doxo regulates the cytosolic stability of an mRNA isoform (LE or IPA) by regulating the choice between alternative (tandem) poly(A) sites within its last exon, thus modifying its 3′ UTR length. Along these lines, in many cases of cyto-specific IPA up, Doxo up-regulated nuclear ELAVL1 binding in the LE (Fig. 6A, left); this might favor a longer, less stable transcript. Finally, because the IPA:LE isoform ratio in nuclear and cytosolic extracts can be impacted by many processes (including transcription, splicing, tandem and intronic polyadenylation, nuclear export, nuclear and cytosolic stability), many of which can involve ELAVL1 (Kishore et al. 2011; Lebedeva et al. 2011; Mukherjee et al. 2011; Grammatikakis et al. 2017), Doxo regulation of the IPA:LE isoform ratio in a given gene could be mediated by several of these processes, thus complicating the analysis of their contribution (e.g., in our actinomycin D experiments mentioned above). Thus, future studies will be necessary to thoroughly investigate these multiple potential mechanisms.
Our finding that ELAVL1 regulates the IPA:LE isoform ratio in many genes is consistent with a recent study showing that Drosophila neuronal ELAV/Hu factors (and potentially their human counterparts) widely regulate ALEs in neurons (Lee et al. 2021). Our finding that ELAVL1-RNA interactions are globally (yet partially) shifted from introns toward 3′ UTRs in response to Doxo (Fig. 5G; Supplemental Fig. S5D,F) is consistent with a similar recent finding in the context of innate immune response, where this shift of ELAVL1 binding led to the regulation of mRNA stability of specific genes (Rothamel et al. 2021). In both cases, this phenomenon is accompanied by a partial redistribution of ELAVL1 from nucleus to cytosol, and our data further show that Doxo partially shifts ELAVL1 from nuclear toward cytosolic RNAs (Fig. 5F), which is consistent with the shift from introns toward 3′ UTRs. Thus, ELAVL1 redistribution from nuclear intronic RNA to cytoplasmic 3′ UTRs may be a recurrent theme in stress responses. In addition to this global trend, our data show that Doxo regulates ELAVL1 binding to the IPA and LE regions of specific genes in the nucleus and cytosol, underlying IPA:LE isoform ratio regulation in both compartments (Fig. 6). This global rewiring of ELAVL1 binding to RNAs may be due in part to its complex post-translational modifications in stress responses (Grammatikakis et al. 2017). Our data also suggest that, although ELAVL1 coordinated the nuclear and cytosolic regulation of IPA:LE isoform ratio in response to Doxo, it did not seem to mediate the isoform-specific regulation of translation efficiency by the drug, that is, IPA:LE ratio up-regulation events found in polysomes but not cytosol (Fig. 3A; Supplemental Fig. S6C).
Finally, in this study, we identify several IPA isoforms (in the ADARB1, BRWD1, HOMEZ, PATZ1, and SYDE2 genes) that are up-regulated relative to matched LE isoform in response to Doxo, are highly translated, and promote cell survival to this genotoxic drug (Fig. 3). Only one of these five genes was previously linked to the DDR. Indeed, the full-length protein isoform of POZ/BTB and AT hook containing zinc finger 1 (PATZ1) was shown to homodimerize through its N-terminal region (which is present in the IPA isoform), interact with the TP53 protein (encoded by the TP53 gene) through its C-terminal region (which is absent in the IPA isoform), and inhibit TP53 transcriptional activity (Keskin et al. 2015). As TP53 is a key DDR factor, the promotion of cell survival by the PATZ1 IPA isoform in the presence of Doxo might be mediated by regulation of TP53 transcriptional activity. Regarding adenosine deaminase RNA specific B1 (ADARB1), it is an RNA editing enzyme related to ADAR1. ADAR1 was reported to edit the mRNA encoding the DNA repair protein NEIL1, thereby modifying its protein sequence and its repair activity (Yeo et al. 2010), and two recent studies in cancer cells showed that ADAR1 impacts the mRNA stability of several DDR genes, the activation of the DDR, and genome stability (Sagredo et al. 2020; Shiromoto et al. 2021). Thus, our data on ADARB1 extend the emerging link between RNA-editing enzymes and DNA damage.
In conclusion, although many studies have shown widespread regulation of IPA isoforms in various biological processes, little was known about their regulation beyond nuclear metabolism. In this study, our genome-wide analyses on subcellular compartments and fractions reveal that Doxo differentially regulates IPA isoforms in the transcriptome and translatome, and in the nucleus and cytosol. We also show that the RNA-binding protein ELAVL1 widely regulates IPA isoforms and coordinates the nuclear and cytosolic regulation of the IPA:LE isoform ratio in response to a stress. Of note, the CCS-iCLIP approach that we are describing for ELAVL1 could be applied to study other RNA-binding proteins. Finally, we identify IPA isoforms that are up-regulated by Doxo and highly translated, and provide evidence for their function in cell survival to Doxo. These findings beg for future analyses of cytosolic and translational levels of IPA isoform regulation in the various physiological and pathological processes, where IPA isoforms are widely regulated.
Methods
Cell culture, transfection, and treatment
MCF-7 and JIMT1 breast cancer cells were cultured in High Glucose DMEM (Eurobio Scientific) supplemented with 10% (v/v) fetal bovine serum (PAN Biotech) and 2 mM L-glutamine (Eurobio Scientific), and maintained at 37°C in 5% CO2. Doxorubicin hydrochloride (Sigma-Aldrich) was resuspended in water to treat cells at 3.5 µM for 6 or 18 h. Actinomycin D (Sigma-Aldrich) was resuspended in DMSO and used to treat cells at 5 μg/mL for 6 h. Reverse transfection of siRNAs (Eurogentec) was performed at a final concentration of 25 or 100 nM for ELAVL1 and IPA isoform depletion, respectively, using Lipofectamine RNAimax (Thermo Fisher Scientific) and following the manufacturer's instructions. siRNA sequences are listed in Supplemental Table S21.
Cell viability assays
For Figure 3, F and G, MCF-7 cells were transfected with siRNAs and seeded at 4000 cells/well in 96-well plates, with six replicates per siRNA condition; 48 h later, triplicates were treated or not with 3.5 μM Doxo; 48 h later, cell viability was assayed using WST-1 (Sigma-Aldrich) according to the manufacturer's instructions. For Figure 5A, MCF-7 cells (2 × 10⁵) were transfected with siRNAs and plated in 12-well plates (two replicates per condition), 3.5 μM Doxo was added after 48 h, and cells were harvested by trypsinization for trypan blue count after 24 or 48 h.
Cell fractionation
For preparation of cytosolic and nuclear extracts, cells were washed twice with ice-cold phosphate buffer saline (PBS) and harvested by scraping. Cells from each plate were pelleted in microfuge tubes, resuspended in 200 μL lysis buffer (10 mM Tris-HCl, pH 8140 mM NaCl, 1.5 mM MgCl2, 10 mM EDTA, 0.5% NP-40, and protease inhibitor cocktail) and incubated on ice for 5 min followed by centrifugation at 470g for 5 min at 4°C. The supernatant was stored as the cytosolic fraction, and the pellet was washed twice gently with lysis buffer before being resuspended in lysis buffer as the nuclear fraction. For total cell lysates, cells were lysed directly by pipetting in lysis buffer. The cell lysate fractions were then sonicated (12 cycles, 30:30) on a Diagenode sonicator and used for RNA isolation or western blot.
Polysome profiling was performed as described previously (Boussemart et al. 2014). Briefly, MCF-7 cells treated or not with Doxo for 6 or 18 h were incubated for 5 min at 37°C with 100 μg/mL cycloheximide in fresh medium. Cells were then washed, scraped into ice-cold PBS supplemented with 100 μg/mL cycloheximide, and centrifuged at 3000 rpm for 5 min. The cell pellets were resuspended in 400 μL of LSB buffer (20 mM Tris, pH 7.4, 100 mM NaCl, 3 mM MgCl2, 0.5 M sucrose, 1 mM DTT, 100 U/mL RNasin, and 100 μg/mL cycloheximide). After homogenization, 400 μL LSB buffer supplemented with 0.2% Triton X-100, and 0.25 M sucrose was added. Samples were kept on ice for 30 min and centrifuged at 12,000g for 15 min at 4°C to pellet the nuclei. The supernatant (cytosolic extract) was adjusted to 5 M NaCl and 1 M MgCl2. The lysates were then loaded onto a 5%–50% sucrose density gradient and centrifuged in an SW41 Ti rotor (Beckman) at 36,000 rpm for 2 h at 4°C. Fractions were monitored and collected using a gradient fractionation system (Isco). RNA was extracted from the four heaviest polysomal fractions (pooled).
RNA extraction
RNA from whole or fractionated cell lysates was extracted with TRIzol Reagent (TRIzol-LS for polysomes; Thermo Fisher Scientific) according to the manufacturer's instructions, and 1 µL of GlycoBlue (Thermo Fisher Scientific) was added for RNA precipitation. RNA was treated with TURBO DNase I (Thermo Fisher Scientific) and quantified using a NanoDrop 2000 spectrophotometer (Thermo Fisher Scientific). For sequencing, RNA samples were analyzed using an RNA 2100 Bioanalyzer (Agilent).
RT-qPCR
Reverse transcription was performed on RNA using SuperScript III Reverse Transcriptase (Thermo Fisher Scientific) and random primers, except in Figure 3G where oligo(dT) primers were used. Quantitative PCR (qPCR) was performed using Power SYBR Green PCR Master Mix (Thermo Fisher Scientific) on a CFX96 Real-Time PCR Detection System (Bio-Rad). Primer sequences are listed in Supplemental Table S21.
Western blot
For immunoblotting, RIPA buffer (150 mM NaCl, 50 mM Tris HCl, pH 8, 0.1% SDS, 1% Nonidet P-40, 0.5% sodium deoxycholate, and protease inhibitor cocktail [Roche]) was added to cell fractions or whole cells in lysis buffer for 30 min on ice and pelleted. Protein concentration was determined using a BCA protein assay kit (Thermo Fisher Scientific). Proteins were separated in NuPAGE 4%–12% Bis-Tris mini protein gels (Thermo Fisher Scientific) and electro-transferred onto PVDF membranes using iBlot 2 (Thermo Fisher Scientific). Membranes were blocked with 5% milk in TBS with Tween-20 for 2 h and incubated overnight at 4°C with primary antibodies—anti-ELAVL1 (3A2, sc-5261, Santa Cruz Biotechnology), anti-GAPDH (G8795, Sigma-Aldrich), anti-Lamin A + Lamin C (EPR4100, Abcam), anti-PATZ1 (sc390577, Santa Cruz Biotechnology), and anti-MAP3K5 (SAB4300398, Sigma-Aldrich). Membranes were washed and incubated with horseradish peroxidase-conjugated goat antimouse or antirabbit antibodies (A3682 and A9169, Sigma-Aldrich). After washing, proteins were detected with ECL reagent (Bio-Rad), according to the manufacturer's protocol.
Total RNA-seq
For total RNA-seq, total RNA from whole MCF-7 cells treated or not with Doxo (two biological replicates of each condition) was subjected to DNase I treatment. Five hundred nanograms of good quality RNA (RIN > 9) were used for Illumina compatible library preparation using the TruSeq Stranded total RNA protocol allowing to take into account strand information. A first step of ribosomal RNA depletion was performed using the RiboZero Gold kit (Illumina). After fragmentation, cDNA synthesis was performed and resulting fragments were used for dA-tailing, followed by ligation of TruSeq indexed adapters. PCR amplification was finally achieved to generate the final barcoded cDNA libraries. Libraries were equimolarly pooled and subjected to qPCR quantification using the KAPA library quantification kit (Roche). Sequencing was carried out on the NovaSeq 6000 instrument from Illumina based on a 2×100 cycle mode (paired-end reads, 100 bases) using an S1 flow cell in order to obtain around 100 million clusters (200 million raw paired-end reads) per sample. FASTQ files were generated from raw sequencing data using bcl2fastq where demultiplexing was performed according to barcodes.
3′-seq experiments
3′-seq libraries were prepared with a QuantSeq 3′ mRNA-Seq Library Prep kit REV for Illumina (Lexogen) using 250 ng (for polysomal RNA) or 500 ng (for all other samples) of DNase I treated RNA (n = 3 for each condition) following the manufacturer's instructions. Purified libraries were quantified with a Quant-iT Picogreen dsDNA kit (Thermo Fisher Scientific) and run on an Experion automated electrophoresis system (Bio-Rad). Pooled libraries were quantitated by qPCR (KAPA Library Quantification kits, Illumina Platforms, Roche), diluted to 12 pM, and subjected to single-end, 50-bp sequencing using the HiSeq 2500 machine (Illumina).
3′-seq bioinformatic analysis
For each sample, raw reads were trimmed to remove uninformative nucleotides due to primer sequences. Trimmed reads of 25 bp or more were aligned on the human reference genome (hg19) using Bowtie 2 (version 2.2.5) (Langmead and Salzberg 2012). Aligning reads to the more recent genome version, GRCh38, would not significantly affect the conclusions of this study because we are mainly analyzing coding genes and we are not analyzing genetic variants. Only reads with a mapping quality score (MAPQ) of 20 or more were retained (SAMtools, version 1.1) for downstream analysis (Li et al. 2009). Reads were then clustered along the genome using BEDTools (version 2.17.0) (Quinlan and Hall 2010), allowing a maximum distance of 50 bp and a minimum number of five reads per peak. Peaks with a stretch of six consecutive As (or 8 As out of 9 nucleotides) within 50 bp downstream were filtered out, as they are likely due to internal priming of oligo(dT). Overlapping peaks from all samples of the compared conditions were merged to define a common set of genomic windows corresponding to poly(A) sites. To annotate peak location within genes, gene coordinates were obtained on the basis of overlapping RefSeq transcripts with the same gene symbol. Peaks overlapping any intronic region of a gene were classified as intronic poly(A) (IPA) peaks. Peaks overlapping the last exon of a gene were classified as LE peaks. Differential analyses between two conditions were done using three independent biological replicates per condition. To compare the regulation of each IPA to the regulation of the gene's last exon (taken as the sum of the peaks in this exon), we used DESeq2 (version 1.4.5) (Love et al. 2014) and the following statistical model:
Yij = μ + Li + Cj + (LC)ij + Eij, where Yij is the normalized counts of peak i in biological condition j, μ is the mean, Li is the peak localization (IPA or LE), Cj is the biological condition, (LC)ij is the interaction between peak localization and biological condition, and Eij is the residual. P-values and adjusted P-values (Benjamini–Hochberg) were calculated. Data with P < 0.05 are shown. The complete bioinformatics pipeline (3′-SMART package) described above can be freely downloaded at GitHub (https://github.com/InstitutCurie/3-SMART) and can be run through a configuration file and a simple command line. Annotated polyadenylation sites were retrieved from the PolyA_DB 3 and PolyASite 2.0 databases (Wang et al. 2018; Herrmann et al. 2020).
iCLIP and CCS-iCLIP experiments
Individual-nucleotide resolution cross-linking and immunoprecipitation (iCLIP) experiments were performed as described (Huppertz et al. 2014) (with minor modifications as detailed below) but using three cell fractions (whole cells, nuclei, and cytosol) from MCF-7 cells treated or not with Doxo for 6 h (two replicates per condition). Briefly, 85%–90% confluent MCF-7 cells in 10-cm dishes were irradiated with UV-light (254 nM) at 400 mJ/cm2 to cross-link protein-RNA interactions using Stratalinker 1800 (Stratagene). After washing cells with ice-cold PBS, cell fractions were obtained as described above. The lysates were sonicated, incubated with 800 µL RIPA buffer for 30 min, and 10 µL RNase I (1:250) was added along with 2 µL of turbo DNase and incubated for 3 min at 37°C at 1100 rpm in a table-top Thermomixer (Thermo Fisher Scientific), followed by incubation on ice for 3 min. RNase inhibitor (Thermo Fisher Scientific) was added and the lysates were centrifuged at 22,000 rcf for 10 min at 4°C to remove debris. Immunoprecipitation of ELAVL1-RNA complexes was performed using 5 μg of anti-ELAVL1 antibody (3A2, sc-5261, Santa Cruz Biotechnology) coupled to protein G dynabeads (Thermo Fisher Scientific). IP with normal mouse IgG (sc-2025, Santa Cruz Biotechnology) was used as negative control. After washing twice with high-salt buffer RIPA-S (50 mM Tris-HCl, pH 7.4, 1 M NaCl, 1 mM EDTA, 1% NP-40, 0.1% SDS, and 0.5% sodium deoxycholate) and once with PNK washing buffer (20 mM Tris-HCl, pH 7.4, 10 mM MgCl2, 0.2% Tween-20), one-tenth of the sample was labeled with 32P-ATP using PNK, whereas an RNA linker was ligated to the rest of the sample after RNA dephosphorylation. RNA-protein complexes were separated by electrophoresis (SDS-Page) and transferred to nitrocellulose membranes. ELAVL1-RNA complexes higher than 55 kDa were marked after visualization by autoradiography. RNA extraction was performed by incubating the nitrocellulose fragment for 10 min at 37°C with Proteinase K in PK buffer (100 mM Tris-HCl, pH 7.5, 50 mM NaCl, and 10 mM EDTA). Two hundred microliters of PK buffer containing urea (7 M) were added to each sample and further incubated for 20 min at 37°C. RNA was isolated by acid-phenol/chloroform extraction and ethanol precipitation. RNA was reverse-transcribed into cDNA using RCLIP primers and SuperScript III reverse transcriptase. After cDNA purification using 6% TBE-urea gels, cDNA was circularized and amplified by PCR using Solexa P5/P7 primers (Illumina). cDNA libraries from independent experiments were prepared, purified using Agencourt AMPure XP (Beckman Coulter) magnetic beads, quantified with a Quant-iT Picogreen dsDNA kit (Thermo Fisher Scientific), and run on an Experion automated electrophoresis system (Bio-Rad). Pooled libraries were quantitated by qPCR (KAPA Library Quantification kits, Illumina Platforms, Roche), diluted to 12 pM, and subjected to single-end, 50-bp sequencing using the HiSeq 2500 machine (Illumina).
iCLIP and CCS-iCLIP bioinformatic analyses
For each sample, raw reads were trimmed in their 5′ and 3′ ends to remove uninformative nucleotides. Trimmed reads were aligned on the human reference genome (hg19) using Bowtie 2 (version 2.2.5) (Langmead and Salzberg 2012). Only reads with a mapping quality score (MAPQ) of 20 or more were retained (SAMtools, version 1.1) for downstream analysis (Li et al. 2009). Duplicated reads were removed using Picard tools. Peaks were identified using Piranha (Uren et al. 2012) using a cutoff of 0.95. For each group, corresponding to a given cellular fraction (whole cells, nuclei, or cytosol) and biological condition (Doxo or vehicle), only peaks found in both replicates (overlapping peaks) were kept for further analysis. Differential analysis of peaks between two groups was done using DESeq2 (version 1.4.5) (Love et al. 2014) and two independent biological replicates per group. Of note, even if a peak is detected in only one condition, reads were counted in this genomic window in all four samples. Adjusted P-values (Benjamini–Hochberg) were calculated and a cutoff of 0.05 was used. The complete bioinformatics pipeline described above can be freely downloaded at GitHub (https://github.com/bioinfo-pf-curie/clip-seq) and can be run through a configuration file and a simple command line. Motif analysis was done using MEME-ChIP (version 4.12.0, classic mode, RNA motifs, width: 6–15, number of motifs: 10, number of sites: 2–600) (Machanick and Bailey 2011).
Other bioinformatic and statistical analyses
Intersections involving peak lists were done using BEDTools Intersect (version 2.17.0) (Quinlan and Hall 2010), allowing a maximum distance of 150 bp when crossing two lists of 3′-seq peaks. 3′ UTR-intron regions were defined as regions that overlap with both a 3′ UTR and an intron from RefSeq transcripts; 3′ UTR-LE regions were defined as regions that overlap with both a RefSeq 3′ UTR and the last exon of a gene. The 3′-seq, RNA-seq, and iCLIP data sets were visualized in the UCSC Genome Browser and Integrative Genomics Viewer (Kent et al. 2002; Robinson et al. 2011). Functional gene annotation analyses were done using the DAVID software (Huang et al. 2009a,b) using the human genome as a reference. For each experimental analysis, at least three independent experiments were performed. In all bar charts, error bars represent the standard error of the mean (SEM) that is the standard deviation divided by the square root of sample number. A Student's paired t-test was used for all bar charts; tests were considered significant if P < 0.05 ([*] P < 0.05, [**] P < 0.01, [***] P < 0.001).
Data access
The data sets generated in this study have been deposited in the UCSC Genome Browser (https://genome.ucsc.edu/s/clabbe/visuDoxoPaper_Dutertre2021). All raw and processed sequencing data generated in this study have been submitted to the NCBI Gene Expression Omnibus repository (GEO; https://www.ncbi.nlm.nih.gov/geo/) under accession number GSE180850. The bioinformatics pipelines for 3′-seq analysis of IPAs (3′-SMART package) and iCLIP analysis are available at GitHub (https://github.com/InstitutCurie/3-SMART and https://github.com/bioinfo-pf-curie/clip-seq, respectively) and as Supplemental Code. Other bioinformatics scripts used in this study are provided in the Supplemental Material (Supplemental Code).
Supplementary Material
Acknowledgments
This work was supported by grants from the Fondation pour la Recherche Médicale (DBI20141231314), Institut National du Cancer (2015-141), and Institut Curie (ICGex) to M.D., a grant from Ligue Nationale Contre le Cancer (équipe labellisée) to S.V., and a PhD fellowship from Ministère de l'Enseignement Supérieur et de la Recherche to A.D. We thank the ICGex NGS platform of Institut Curie that prepared total-RNA-seq libraries and managed all sequencing runs, and is supported by grants ANR-10-EQPX-03 (Equipex) and ANR-10-INBS-09-08 (France Génomique Consortium) from the Agence Nationale de la Recherche (“Investissements d'Avenir” program), by the Canceropôle Ile-de-France, and by the SiRIC-Curie program—SiRIC grant INCa-DGOS-4654.
Author contributions: Experiments were performed by A.C., S.R., N.T., A.D., and A.H.-M. under the supervision of M.D. Polysome fractionation was carried out by S.M. Bioinformatics and biostatistics analyses were performed by M.C., T.A., C.M.L., and P.G. under the supervision of M.D. and N.S. M.D. wrote the paper with the help of A.C., A.I., and S.V. All authors read and approved the final manuscript.
Footnotes
[Supplemental material is available for this article.]
Article published online before print. Article, supplemental material, and publication date are at https://www.genome.org/cgi/doi/10.1101/gr.276192.121.
Competing interest statement
S.V. is a scientific cofounder of Ribonexus. The other authors declare no competing interests.
References
- Boussemart L, Malka-Mahieu H, Girault I, Allard D, Hemmingsson O, Tomasic G, Thomas M, Basmadjian C, Ribeiro N, Thuaud F, et al. 2014. eIF4F is a nexus of resistance to anti-BRAF and anti-MEK cancer therapies. Nature 513: 105–109. 10.1038/nature13572 [DOI] [PubMed] [Google Scholar]
- Chen X, Lloyd SM, Kweon J, Gamalong GM, Bao X. 2021. Epidermal progenitors suppress GRHL3-mediated differentiation through intronic polyadenylation promoted by CPSF-HNRNPA3 collaboration. Nat Commun 12: 148. 10.1038/s41467-020-20674-3 [DOI] [PMC free article] [PubMed] [Google Scholar]
- Cheng LC, Zheng D, Baljinnyam E, Sun F, Ogami K, Yeung PL, Hoque M, Lu C-W, Manley JL, Tian B. 2020. Widespread transcript shortening through alternative polyadenylation in secretory cell differentiation. Nat Commun 11: 3182. 10.1038/s41467-020-16959-2 [DOI] [PMC free article] [PubMed] [Google Scholar]
- Chiu AC, Suzuki HI, Wu X, Mahat DB, Kriz AJ, Sharp PA. 2018. Transcriptional pause sites delineate stable nucleosome-associated premature polyadenylation suppressed by U1 snRNP. Mol Cell 69: 648–663.e7. 10.1016/j.molcel.2018.01.006 [DOI] [PMC free article] [PubMed] [Google Scholar]
- Devany E, Park JY, Murphy MR, Zakusilo G, Baquero J, Zhang X, Hoque M, Tian B, Kleiman FE. 2016. Intronic cleavage and polyadenylation regulates gene expression during DNA damage response through U1 snRNA. Cell Discov 2: 16013. 10.1038/celldisc.2016.13 [DOI] [PMC free article] [PubMed] [Google Scholar]
- Dutertre M, Chakrama FZ, Combe E, Desmet F-O, Mortada H, Polay Espinoza M, Gratadou L, Auboeuf D. 2014. A recently evolved class of alternative 3′-terminal exons involved in cell cycle regulation by topoisomerase inhibitors. Nat Commun 5: 3395. 10.1038/ncomms4395 [DOI] [PubMed] [Google Scholar]
- Dutertre M, Sfaxi R, Vagner S. 2021. Reciprocal links between pre-messenger RNA 3′-end processing and genome stability. Trends Biochem Sci 46: 579–594. 10.1016/j.tibs.2021.01.009 [DOI] [PubMed] [Google Scholar]
- Elkon R, Drost J, van Haaften G, Jenal M, Schrier M, Vrielink JAO, Agami R. 2012. E2F mediates enhanced alternative polyadenylation in proliferation. Genome Biol 13: R59. 10.1186/gb-2012-13-7-r59 [DOI] [PMC free article] [PubMed] [Google Scholar]
- Fischl H, Neve J, Wang Z, Patel R, Louey A, Tian B, Furger A. 2019. hnRNPC regulates cancer-specific alternative cleavage and polyadenylation profiles. Nucleic Acids Res 47: 7580–7591. 10.1093/nar/gkz461 [DOI] [PMC free article] [PubMed] [Google Scholar]
- Gallouzi IE, Steitz JA. 2001. Delineation of mRNA export pathways by the use of cell-permeable peptides. Science 294: 1895–1901. 10.1126/science.1064693 [DOI] [PubMed] [Google Scholar]
- Grammatikakis I, Abdelmohsen K, Gorospe M. 2017. Posttranslational control of HuR function. Wiley Interdiscip Rev RNA 8: e1372. 10.1002/wrna.1372 [DOI] [PMC free article] [PubMed] [Google Scholar]
- Gruber AJ, Zavolan M. 2019. Alternative cleavage and polyadenylation in health and disease. Nat Rev Genet 20: 599–614. 10.1038/s41576-019-0145-z [DOI] [PubMed] [Google Scholar]
- Herrmann CJ, Schmidt R, Kanitz A, Artimo P, Gruber AJ, Zavolan M. 2020. PolyASite 2.0: a consolidated atlas of polyadenylation sites from 3′ end sequencing. Nucleic Acids Res 48: D174–D179. 10.1093/nar/gkz918 [DOI] [PMC free article] [PubMed] [Google Scholar]
- Hollerer I, Curk T, Haase B, Benes V, Hauer C, Neu-Yilik G, Bhuvanagiri M, Hentze MW, Kulozik AE. 2016. The differential expression of alternatively polyadenylated transcripts is a common stress-induced response mechanism that modulates mammalian mRNA expression in a quantitative and qualitative fashion. RNA 22: 1441–1453. 10.1261/rna.055657.115 [DOI] [PMC free article] [PubMed] [Google Scholar]
- Huang DW, Sherman BT, Lempicki RA. 2009a. Bioinformatics enrichment tools: paths toward the comprehensive functional analysis of large gene lists. Nucleic Acids Res 37: 1–13. 10.1093/nar/gkn923 [DOI] [PMC free article] [PubMed] [Google Scholar]
- Huang DW, Sherman BT, Lempicki RA. 2009b. Systematic and integrative analysis of large gene lists using DAVID bioinformatics resources. Nat Protoc 4: 44–57. 10.1038/nprot.2008.211 [DOI] [PubMed] [Google Scholar]
- Huppertz I, Attig J, D'Ambrogio A, Easton LE, Sibley CR, Sugimoto Y, Tajnik M, König J, Ule J. 2014. iCLIP: protein–RNA interactions at nucleotide resolution. Methods 65: 274–287. 10.1016/j.ymeth.2013.10.011 [DOI] [PMC free article] [PubMed] [Google Scholar]
- Kent WJ, Sugnet CW, Furey TS, Roskin KM, Pringle TH, Zahler AM, Haussler D. 2002. The human genome browser at UCSC. Genome Res 12: 996–1006. 10.1101/gr.229102 [DOI] [PMC free article] [PubMed] [Google Scholar]
- Keskin N, Deniz E, Eryilmaz J, Un M, Batur T, Ersahin T, Cetin Atalay R, Sakaguchi S, Ellmeier W, Erman B. 2015. PATZ1 is a DNA damage-responsive transcription factor that inhibits p53 function. Mol Cell Biol 35: 1741–1753. 10.1128/MCB.01475-14 [DOI] [PMC free article] [PubMed] [Google Scholar]
- Kishore S, Jaskiewicz L, Burger L, Hausser J, Khorshid M, Zavolan M. 2011. A quantitative analysis of CLIP methods for identifying binding sites of RNA-binding proteins. Nat Methods 8: 559–564. 10.1038/nmeth.1608 [DOI] [PubMed] [Google Scholar]
- Langmead B, Salzberg SL. 2012. Fast gapped-read alignment with Bowtie 2. Nat Methods 9: 357–359. 10.1038/nmeth.1923 [DOI] [PMC free article] [PubMed] [Google Scholar]
- Latorre E, Tebaldi T, Viero G, Spartà AM, Quattrone A, Provenzani A. 2012. Downregulation of HuR as a new mechanism of doxorubicin resistance in breast cancer cells. Mol Cancer 11: 13. 10.1186/1476-4598-11-13 [DOI] [PMC free article] [PubMed] [Google Scholar]
- Lebedeva S, Jens M, Theil K, Schwanhäusser B, Selbach M, Landthaler M, Rajewsky N. 2011. Transcriptome-wide analysis of regulatory interactions of the RNA-binding protein HuR. Mol Cell 43: 340–352. 10.1016/j.molcel.2011.06.008 [DOI] [PubMed] [Google Scholar]
- Lee S-H, Singh I, Tisdale S, Abdel-Wahab O, Leslie CS, Mayr C. 2018. Widespread intronic polyadenylation inactivates tumour suppressor genes in leukaemia. Nature 561: 127–131. 10.1038/s41586-018-0465-8 [DOI] [PMC free article] [PubMed] [Google Scholar]
- Lee S, Wei L, Zhang B, Goering R, Majumdar S, Wen J, Taliaferro JM, Lai EC. 2021. ELAV/Hu RNA binding proteins determine multiple programs of neural alternative splicing. PLoS Genet 17: e1009439. 10.1371/journal.pgen.1009439 [DOI] [PMC free article] [PubMed] [Google Scholar]
- Li H, Handsaker B, Wysoker A, Fennell T, Ruan J, Homer N, Marth G, Abecasis G, Durbin R, 1000 Genome Project Data Processing Subgroup. 2009. The Sequence Alignment/Map format and SAMtools. Bioinformatics 25: 2078–2079. 10.1093/bioinformatics/btp352 [DOI] [PMC free article] [PubMed] [Google Scholar]
- Lianoglou S, Garg V, Yang JL, Leslie CS, Mayr C. 2013. Ubiquitously transcribed genes use alternative polyadenylation to achieve tissue-specific expression. Genes Dev 27: 2380–2396. 10.1101/gad.229328.113 [DOI] [PMC free article] [PubMed] [Google Scholar]
- Love MI, Huber W, Anders S. 2014. Moderated estimation of fold change and dispersion for RNA-seq data with DESeq2. Genome Biol 15: 550. 10.1186/s13059-014-0550-8 [DOI] [PMC free article] [PubMed] [Google Scholar]
- Machanick P, Bailey TL. 2011. MEME-ChIP: motif analysis of large DNA datasets. Bioinformatics 27: 1696–1697. 10.1093/bioinformatics/btr189 [DOI] [PMC free article] [PubMed] [Google Scholar]
- Mukherjee N, Corcoran DL, Nusbaum JD, Reid DW, Georgiev S, Hafner M, Ascano M, Tuschl T, Ohler U, Keene JD. 2011. Integrative regulatory mapping indicates that the RNA-binding protein HuR couples pre-mRNA processing and mRNA stability. Mol Cell 43: 327–339. 10.1016/j.molcel.2011.06.007 [DOI] [PMC free article] [PubMed] [Google Scholar]
- Müller-McNicoll M, Botti V, de Jesus Domingues AM, Brandl H, Schwich OD, Steiner MC, Curk T, Poser I, Zarnack K, Neugebauer KM. 2016. SR proteins are NXF1 adaptors that link alternative RNA processing to mRNA export. Genes Dev 30: 553–566. 10.1101/gad.276477.115 [DOI] [PMC free article] [PubMed] [Google Scholar]
- Neve J, Burger K, Li W, Hoque M, Patel R, Tian B, Gullerova M, Furger A. 2016. Subcellular RNA profiling links splicing and nuclear DICER1 to alternative cleavage and polyadenylation. Genome Res 26: 24–35. 10.1101/gr.193995.115 [DOI] [PMC free article] [PubMed] [Google Scholar]
- Ogami K, Richard P, Chen Y, Hoque M, Li W, Moresco JJ, Yates JR, Tian B, Manley JL. 2017. An Mtr4/ZFC3H1 complex facilitates turnover of unstable nuclear RNAs to prevent their cytoplasmic transport and global translational repression. Genes Dev 31: 1257–1271. 10.1101/gad.302604.117 [DOI] [PMC free article] [PubMed] [Google Scholar]
- Ogorodnikov A, Kargapolova Y, Danckwardt S. 2016. Processing and transcriptome expansion at the mRNA 3′ end in health and disease: finding the right end. Pflugers Arch 468: 993–1012. 10.1007/s00424-016-1828-3 [DOI] [PMC free article] [PubMed] [Google Scholar]
- Quinlan AR, Hall IM. 2010. BEDTools: a flexible suite of utilities for comparing genomic features. Bioinformatics 26: 841–842. 10.1093/bioinformatics/btq033 [DOI] [PMC free article] [PubMed] [Google Scholar]
- Robinson JT, Thorvaldsdóttir H, Winckler W, Guttman M, Lander ES, Getz G, Mesirov JP. 2011. Integrative Genomics Viewer. Nat Biotechnol 29: 24–26. 10.1038/nbt.1754 [DOI] [PMC free article] [PubMed] [Google Scholar]
- Rothamel K, Arcos S, Kim B, Reasoner C, Lisy S, Mukherjee N, Ascano M. 2021. ELAVL1 primarily couples mRNA stability with the 3′ UTRs of interferon-stimulated genes. Cell Rep 35: 109178. 10.1016/j.celrep.2021.109178 [DOI] [PMC free article] [PubMed] [Google Scholar]
- Sagredo EA, Sagredo AI, Blanco A, Rojas De Santiago P, Rivas S, Assar R, Pérez P, Marcelain K, Armisén R. 2020. ADAR1 transcriptome editing promotes breast cancer progression through the regulation of cell cycle and DNA damage response. Biochim Biophys Acta Mol Cell Res 1867: 118716. 10.1016/j.bbamcr.2020.118716 [DOI] [PubMed] [Google Scholar]
- Sandberg R, Neilson JR, Sarma A, Sharp PA, Burge CB. 2008. Proliferating cells express mRNAs with shortened 3′ untranslated regions and fewer microRNA target sites. Science 320: 1643–1647. 10.1126/science.1155390 [DOI] [PMC free article] [PubMed] [Google Scholar]
- Shiromoto Y, Sakurai M, Minakuchi M, Ariyoshi K, Nishikura K. 2021. ADAR1 RNA editing enzyme regulates R-loop formation and genome stability at telomeres in cancer cells. Nat Commun 12: 1654. 10.1038/s41467-021-21921-x [DOI] [PMC free article] [PubMed] [Google Scholar]
- Singh I, Lee S-H, Sperling AS, Samur MK, Tai Y-T, Fulciniti M, Munshi NC, Mayr C, Leslie CS. 2018. Widespread intronic polyadenylation diversifies immune cell transcriptomes. Nat Commun 9: 1716. 10.1038/s41467-018-04112-z [DOI] [PMC free article] [PubMed] [Google Scholar]
- Sterne-Weiler T, Martinez-Nunez RT, Howard JM, Cvitovik I, Katzman S, Tariq MA, Pourmand N, Sanford JR. 2013. Frac-seq reveals isoform-specific recruitment to polyribosomes. Genome Res 23: 1615–1623. 10.1101/gr.148585.112 [DOI] [PMC free article] [PubMed] [Google Scholar]
- Tian B, Manley JL. 2017. Alternative polyadenylation of mRNA precursors. Nat Rev Mol Cell Biol 18: 18–30. 10.1038/nrm.2016.116 [DOI] [PMC free article] [PubMed] [Google Scholar]
- Uren PJ, Bahrami-Samani E, Burns SC, Qiao M, Karginov FV, Hodges E, Hannon GJ, Sanford JR, Penalva LOF, Smith AD. 2012. Site identification in high-throughput RNA–protein interaction data. Bioinformatics 28: 3013–3020. 10.1093/bioinformatics/bts569 [DOI] [PMC free article] [PubMed] [Google Scholar]
- Wang R, Nambiar R, Zheng D, Tian B. 2018. PolyA_DB 3 catalogs cleavage and polyadenylation sites identified by deep sequencing in multiple genomes. Nucleic Acids Res 46: D315–D319. 10.1093/nar/gkx1000 [DOI] [PMC free article] [PubMed] [Google Scholar]
- Williamson L, Saponaro M, Boeing S, East P, Mitter R, Kantidakis T, Kelly GP, Lobley A, Walker J, Spencer-Dene B, et al. 2017. UV irradiation induces a non-coding RNA that functionally opposes the protein encoded by the same gene. Cell 168: 843–855.e13. 10.1016/j.cell.2017.01.019 [DOI] [PMC free article] [PubMed] [Google Scholar]
- Yeo J, Goodman RA, Schirle NT, David SS, Beal PA. 2010. RNA editing changes the lesion specificity for the DNA repair enzyme NEIL1. Proc Natl Acad Sci 107: 20715–20719. 10.1073/pnas.1009231107 [DOI] [PMC free article] [PubMed] [Google Scholar]
Associated Data
This section collects any data citations, data availability statements, or supplementary materials included in this article.