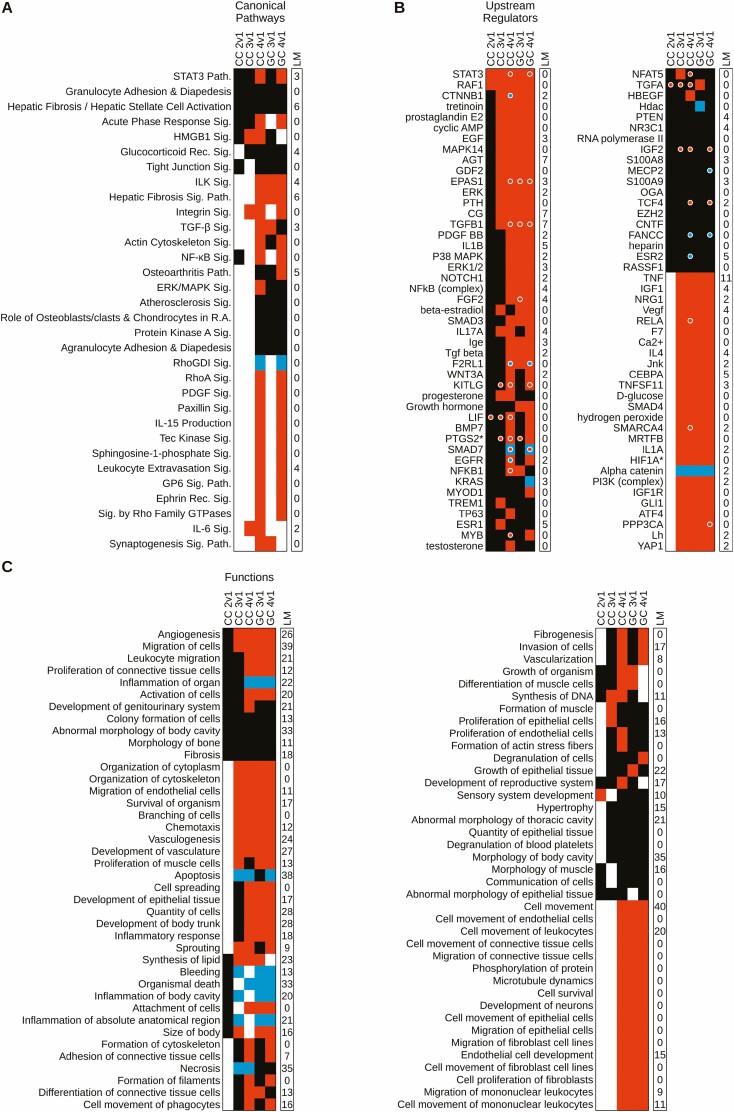
Figure 6.
Cumulus and granulosa cell IPA pathway, regulator, and function heatmap. Heatmap depicts IPA canonical pathways (A), upstream regulators (B), and biological functions (C) for cumulus and granulosa cells. All panels consist of 2 columns (wrapped in 2 portions for B and C): left column denotes dataset of origin with the cell type and follicle type comparison indicated, right column (“LM”) denotes the number of luteinization markers (Fig. 2) present in the pathway. Along the y-axis are the identified, canonical pathways, upstream regulators, and biological functions. Colored fill for cells in heat maps denote z-score: red = activated, blue = inhibited, black = no significant z-score. Level of significant overlap was set at P < .05, and cells with white fill denote those not meeting significance. (A) Entries were limited to those with significance in at least 3 datasets and/or significant z-scores in at least 2; data generated from Table S5 (32). (B) Entries were limited to those with significance in at least 4 datasets and/or significant z-scores in at least 3 datasets; data generated from Table S6 (32). (C) Entries were limited to those with significance in at least 5 datasets and/or significant z-scores in at least 4 datasets; data generated from Table S7 (32).

