Abstract
Recent advances in T cell-based immunotherapies from bench to bedside have highlighted the need for improved diagnostic imaging of T cell trafficking in vivo and the means to noninvasively investigate failures in treatment response. T cells expressing tumor-associated T cell receptors (TCRs) or engineered with chimeric antigen receptors (CARs) face multiple challenges, including possible influence of genetic engineering on T cell efficacy, inhibitory effects of the tumor microenvironment, tumor checkpoint proteins and on-target, off-tissue toxicities (Kershaw et al., Nat Rev Cancer 13:525–541, 2013; Corrigan-Curay et al., Mol Ther 22:1564–1574, 2014; June et al., Sci Trans Med 7:280–287, 2015; Whiteside et al., Clin Cancer Res 22:1845–1855, 2016; Rosenberg and Restifo, Science 348:62–68, 2015). Positron emission tomography (PET) imaging with nuclear reporter genes is potentially one of the most sensitive and noninvasive methods to quantitatively track and monitor function of adoptively transferred cells in vivo. However, in vivo PET detection of T cells after administration into patients is limited by the degree of tracer accumulation per cell in situ and cell density in target tissues. We describe here a method for ex vivo radiolabeling of T cells, a reliable and robust technique for PET imaging of the kinetics of T cell biodistribution from the time of administration to subsequent localization in targeted tumors and other tissues of the body. This noninvasive technique can provide valuable information to monitor and identify the potential efficacy of adoptive cell therapies.
Keywords: T cell, Immunotherapy, Adoptive cell therapy, PET, Human nuclear reporter gene, Reporter probe, Ex vivo radiolabeling, Tumor microenvironment
1. Introduction
Technologies to assess the migration, survival, and function of antigen-specific T cells in vivo hold promise to improve cellular immunotherapies. Several imaging modalities have been investigated for this purpose including positron emission tomography (PET), magnetic resonance imaging (MRI), and two-photon microscopy. While two-photon microscopy is an invasive technique for ex vivo imaging of immune cell trafficking using fluorescent reporter genes [1,2], PET and MRI are noninvasive in vivo imaging techniques that permit real-time, longitudinal monitoring of adoptively transferred T cells. For MRI, phagocytic macrophages and monocytes are co-incubated with superparamagnetic iron oxide (SPIO) nanoparticles or perfluorocarbon (PFC) emulsion prior to adoptive transfer and subsequent imaging [3]. These agents are complexed with a cationic transfection agent to permit imaging of non-phagocytic cells.
PET imaging of ex vivo radiolabeled T cells with or without stably expressing reporter genes has been demonstrated successfully for noninvasive cell tracking in vivo [4-7]. The technique involves three general steps: (1) stable expression of a reporter gene (optional depending on labeling technique), (2) ex vivo radiolabeling by co-incubating target cells with radiotracer, and (3) adoptive transfer of cells and in vivo PET imaging. Some systems require expression of a reporter gene, which functions to trap the radiotracer intracellularly during ex vivo radiolabeling. These genes include herpes simplex virus thymidine kinase (HSV-TK, Fig. 1) and humanized reporter genes such as deoxycytidine kinase (dCKDM), norepinephrine transporter (hNET), and sodium-iodide symporter (hNIS) [8].
Fig. 1.
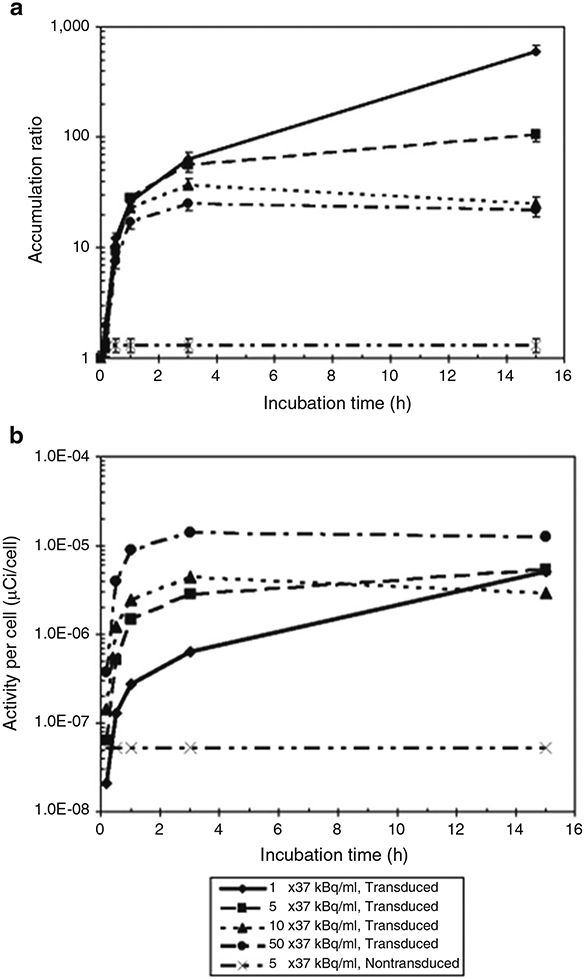
Dynamics of ex vivo radiolabeling of HSV-TK+ lymphocytes, expressed as (a) the accumulation ratio and (b) the activity per cell μCi/cell) of 131I-FIAU as a function of incubation time in 131I-FIAU-containing medium for radioactivity concentrations ranging from 1 to 50 μCi/mL. Adapted from Koehne et al. [4] with permission from the publisher
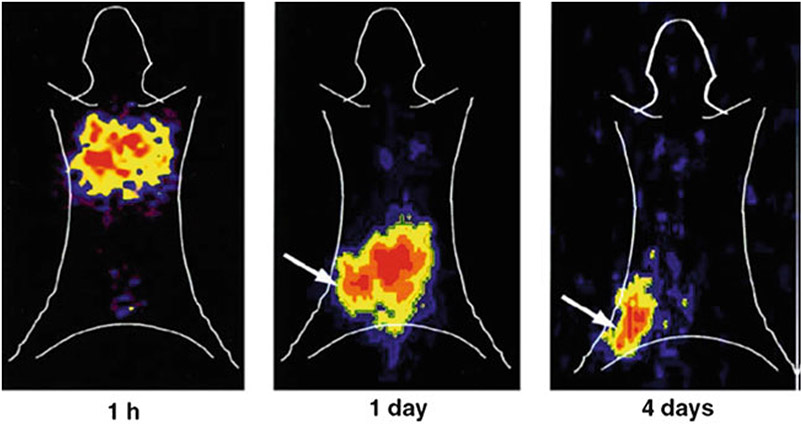
Koehne et al. demonstrated PET and gamma camera imaging of ex vivo and in vivo radiolabeled adoptively transferred T cells and their selective accumulation in HLA-matched and Epstein-Barr virus-positive (EBV+) tumors, but not in EBV− or HLA-mismatched tumors (Fig. 2) [4]. The percentage of infiltrating T cells in tumor and spleen closely correlated with the doses of radioactivity accumulated at each site. Additionally, radiolabeled T cells retained their capacity to eliminate target-specific tumors [4].
Fig. 2.
Representative serial planar gamma camera images of SCID mice bearing a human EBV lymphoma xenograft at 1 h, 1 day, and 4 days following tail vein injection of 3 × 10⁷ autologous EBV-specific T cells transduced with NIT+ and radiolabeled in vitro with 131I-FIAU. For anatomic orientation, manually drawn body contours of the mouse are shown. The arrows in the 1- and 4-day images identify the tumor. The NIT+ EBV-specific T cells were radiolabeled with 131I-FIAU to the MTD, that is, the 827-cGy nuclear absorbed dose indicated in Fig. 3. The images were obtained with an Adac Vertex+ digital gamma camera (Adac, Milpitas, CA, USA) fitted with a high-energy high-resolution (HEHR) collimator and using a 364-keV ± 10% photopeak energy window for 131I. Adapted from Koehne et al. [4] with permission from the publisher
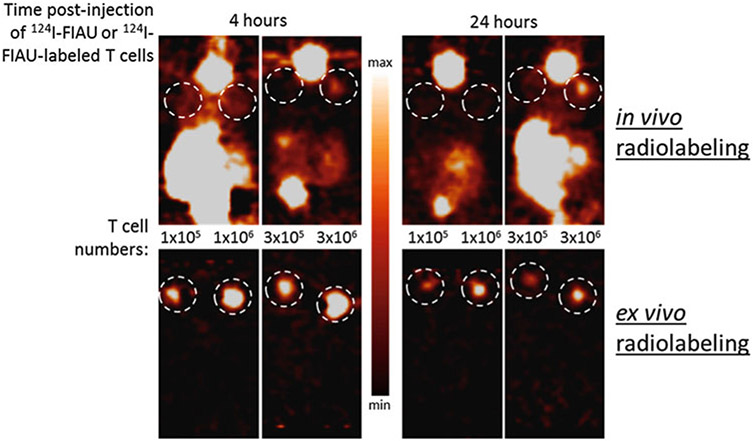
While PET reporter gene imaging techniques vary in detection sensitivity, T cells can be imaged in mice with microPET scanners and are within clinically relevant range of clinical PET scanners. The ability to identify populations as low as 1 × 10⁵ T cells has been shown (Fig. 3). In vivo PET imaging of ex vivo radiolabeled antigen-specific T cells is directly translatable to current adoptive cellular therapy protocols in the clinic and can provide critical information about therapeutic efficacy.
Fig. 3.
A 30-fold improvement in in vivo microPET detection sensitivity of T cells injected subcutaneously when radiolabeled ex vivo with 124I-FIAU prior to implantation in mice compared to in vivo radiolabeling through systemic intravenous injection of 124I-FIAU. Unpublished data from Vladimir Ponomarev et al.
The following describes the methodology for ex vivo radiolabeling of reporter gene-expressing T cells with PET radiotracers and subsequent in vivo PET imaging to assess T cell biodistribution. Other adoptively transferred cell protocols should, in theory, be amenable to this imaging technique and could prove valuable for in vivo assessment of cellular therapy.
2. Materials
2.1. Reporter Gene Constructs and Virus Production
Viral construct bearing transcriptional promoter (constitutive or inducible), reporter gene, targeting receptor (e.g., CAR), and selection marker (e.g., green fluorescent protein, GFP).
Virus-producing cells: PG13 or Phoenix Ampho-Ecotropic are generally efficient for most retroviral productions and are available through the American Type Culture Collection (ATCC).
X-tremeGENE 9 (Roche, 06365787001) or similar reagents for transfection of virus-producing cells with reporter gene-bearing vectors.
2.2. T Cell Isolation and Expansion from Whole Blood or Buffy Coat
Whole blood or buffy coat (available from regional blood banks or blood donations).
1× Phosphate-buffered saline (PBS).
Lymphocyte separation medium (LSM; Corning, 25-072-CI or similar agent), a polysucrose and diatrizoate solution designed for isolating lymphocytes from blood by centrifugation. Store at 25 °C.
Red blood cell lysis buffer. Store at 25 °C, away from light.
Phytohemagglutinin (PHA). Stock solution prepared in sterile PBS at 1 mg/mL. Store at −20 °C. Anti-CD3/CD28 Dynabeads can be used as an alternative for PHA for stimulation purposes at a ratio of three Dynabeads per one T cell (Fisher Scientific, 111.32D).
T cell media: RPMI 1640 media (containing nonessential amino acids, 10 mM HEPES, 1 mM sodium pyruvate, 2 mM L-glutamine, 1.5 g/L sodium bicarbonate, 4.5 g/L glucose) supplemented with 1% penicillin/streptomycin, 10% fetal calf serum, and 50 μM β-mercaptoethanol.
IL-2, available in many stock formulations (final concentration 20 IU per mL of media).
2.3. Reporter Gene Transduction and T Cell Maintenance
RetroNectin (Fisher, T100B) or similar reagent. Stock is 2.5 mg and stored at −20 °C.
IL-15 (1000× stock is 10 mg/mL).
For CAR T cells: antigen-presenting cells (e.g., PSMA) growing in exponential phase will be required, it is beneficial to modify antigen-presenting cells (APCs) to also express co-stimulatory molecules (e.g., B7).
For constructs that include antibiotic resistance genes: an antibiotic, e.g., gentamicin (G418), will be required.
For constructs that include a fluorescent reporter gene or that can be detected with an antibody labeled with fluorophores: fluorescence activated cell sorting (FACS) will be required.
For long-term storage, T cells can be cryopreserved using DMSO-containing cell-freezing media.
Untreated and cell-culture-treated plastic T-175 flasks and six-well plates.
2.4. Ex Vivo Radiolabeling
Ensure all equipment is and the radiolabeling workspace is approved for work with radioactive materials.
Incubator with shaking platform, set at 37° C, 5% CO2.
Cell viability counter, e.g., ViCell.
FACS sorting tubes.
Cell-culture-treated plastic T-175 flasks and six-well plates.
51Cr chromate for 51Cr release assay of T cell cytotoxicity.
Automated gamma counter.
2.5. PET Imaging
MicroPET scanner for animal imaging. Many commercial scanners are available designed for whole-body imaging of mice with relatively high sensitivity and spatial resolution.
CT or MRI scanner. PET data benefit greatly from anatomical co-registration, so it is highly recommended to combine PET with CT or MRI imaging.
Image analysis software (see Subheading 4).
2.6. Other Materials and Equipment
1× phosphate-buffered saline (PBS).
0.05% or 0.25% trypsin.
Isoflurane in oxygen and vaporizer.
Untreated and cell culture-treated plastic T-175 flasks and six-well plates.
50 mL conical tubes.
10 or 20 mL serological pipettes.
Benchtop centrifuge with temperature control and plate holders.
3. Methods
3.1. T Cell Transduction, Expansion, and Preparation
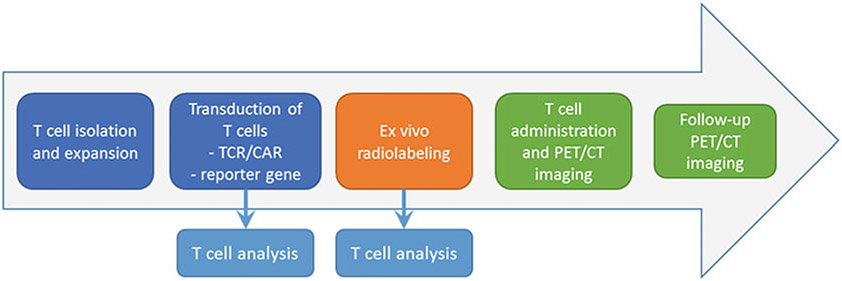
Please see Chapter 13, steps 3.1–4 in Lee et al., Imaging T Cell Dynamics and Function Using PET and Human Nuclear Reporter Genes. Figure 4 below shows a schematic representation of the transduction and imaging workflow.
Fig. 4.
Summary workflow for ex vivo radiolabeling and in vivo PET/CT imaging of T cells
3.2. Ex Vivo Radiolabeling of T Cells
Before radiolabeling, assess T cell viability (trypan blue exclusion assay), proliferation (cell growth), expression of TCR/CAR (e.g., flow cytometry), functional status (activation upon antigen presentation), cytotoxic potential (51Cr release assay).
Animal formulation: T cells can be prepared in T cell culture media at desired concentrations (e.g., 1–10 × 106 T cells per mL of media).
Add radioactivity to T cells: for animal formulation, resuspend pelleted T cells in radioactive media and transfer to untreated tissue culture flasks/plates. Media radioactivity concentration up to 30 μCi/mL and incubation for 2 h does not adversely affect T cells [9].
Place resuspended cells in an incubator for a minimum of 2 h at 37 °C and 5% CO2 on a cell culture rocker/shaker.
Prepare ex vivo radiolabeled T cells for injection. For animal imaging, collect and centrifuge T cells at 400 × g for 5 min. Safely remove and discard radioactive media. Resuspend T cells in 100–250 μL saline or non-radioactive, serum-free media for injections. Obtain an aliquot of cells for further analysis (see step 7). Maintain cells on ice until administration.
Measure amount of radioactivity per T cell. To optimize the activity per cell, alter the radioactivity concentration in media, concentration of T cells, and/or duration of ex vivo labeling. These parameters should be determined empirically for each type of radiopharmaceutical.
After radiolabeling, assess T cell viability (trypan blue exclusion assay), proliferation (cell growth), expression of TCR/CAR (e.g., flow cytometry), functional status (activation upon antigen presentation), cytotoxic potential (51Cr release assay). Compare results with step 1 to determine whether radiolabeling is detrimental to T cells (see Subheading 4, Notes 1-5).
For further investigation of the influence of the radiolabeling procedure on T cell health, repeat step 6 and monitor overall cell proliferation for the next 48–72 h.
3.3. PET Imaging of T Cell Biodistribution
To observe immediate trafficking of T cells after injection, “dynamic” PET imaging should be conducted, e.g., acquire list-mode PET data starting at the time of T cell injection and continuing through 1–2 h post-injections. Otherwise, “static” (single time frame) PET imaging is performed to obtain T cell bio distributions at various time points (see Subheading 4, Note 6). Follow all institutional, local, state and federal ethical and safety regulations. Anesthetics should be used according to approved techniques.
For preclinical imaging, anesthetize animal with 2% isoflurane in pure oxygen in an induction chamber for approximately 5–10 min and then transfer animal to imaging chamber with nose cone flowing 2% isoflurane.
Inject/infuse radiolabeled T cells, generally intravenously (i.v.).
Acquire dynamic or static PET images. For dynamic scans, inject T cells i.v. via catheter (e.g., tail vein for rodents) or direct injection immediately prior to starting PET acquisition. A slow, 10–20 s i.v. injection is recommended for rodents.
It would be beneficial to start with dynamic imaging for first 2 h to observe initial migration and homing. This can be followed with static imaging at later time points. The timing will depend partly on half-life of the isotope and partly on T cell biodistribution and targeting.
After each PET imaging, acquire CT image for anatomical co-registration and PET attenuation correction.
Reconstruct raw images and perform image analysis. Quantitation and image data is generally presented in units of “percent injected dose per gram of tissue” (%ID/g) or normalized to background (e.g., nonspecific tissue).
4. Notes
For proper use of 51Cr release assay it is important to select a suitably narrow photopeak energy window for measuring 51Cr (151 kEV) and use a substantial concentration for target cell uptake (up to 100 μCi per 1 × 10⁶ target cells).
The 51Cr release assay should be performed using T cells with same experimental radiopharmaceutical, but untreated with 51Cr to calculated background.
Ex vivo radiolabeled T cells will be the most beneficial when used with long half-life radionuclides such as 124I, 89Zr, and 64Cu; however it is important to note that the diagnostic value of PET biodistribution studies will decline as T cells die and/or proliferate in vivo, the latter causing a dilution of the activity per cell.
It is important to assess total amount of intracellular radioactivity in experimental cells to optimize for T cell dosage and optimal parameters of imaging such as scanner sensitivity and resolution.
Cell-level dosimetry and radioactivity dose-dependent toxicity for ex vivo radiolabeled T cells and radioactivity dose-dependent T cell immune cytotoxicity should be evaluated (Fig. 5) [9].
Imaging ex vivo radiolabeled cells is informative and can assess therapy efficacy, but in vivo cell division will dilute intracellular tracer concentrations (particularly when imaging longer-lived isotopes) and significant cell death may increase tissue background due to the presence of free tracer. These situations may limit the comparison of PET images with true T cell numbers in vivo and are more pronounced in extended studies (e.g., on the order of days) [9].
Fig. 5.
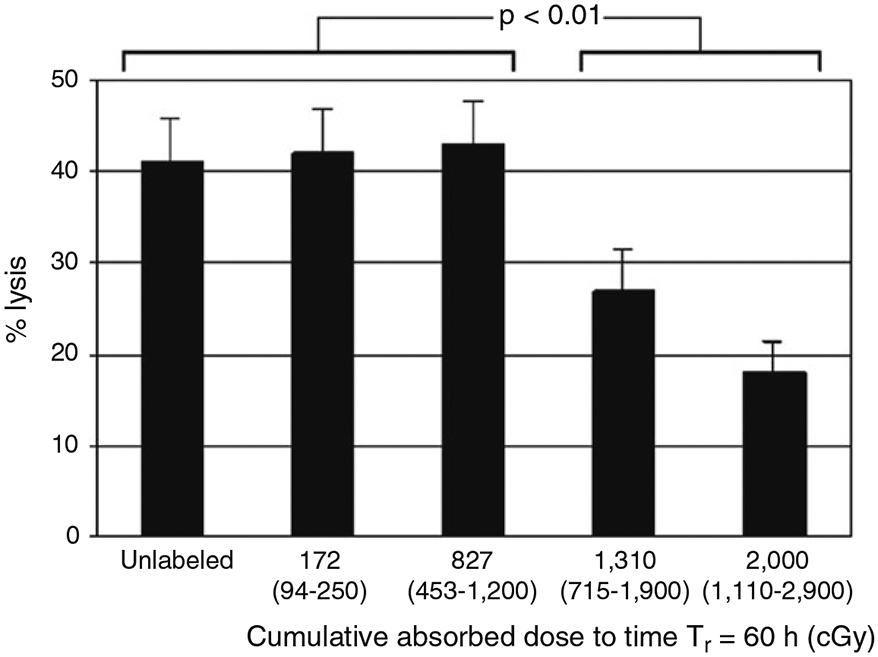
Dose-dependent in vitro immune cytotoxicity of 131I-FIAU-radiolabeled NIT+ cells against BCLCs determined by a 51Cr-release cytotoxicity assay at a target:effector ratio of 20:1. Values indicated represent the calculated median cumulative absorbed doses to the effector-cell nuclei projected to the reference time Tβ = 60 h after a 2-h incubation in 131I-FIAU-containing medium, that is, the absorbed doses assuming 0.5 of the intracellular activity and cumulated activity is in the cytoplasm and 0.5 is in the nucleus. The values in parentheses represent the respective ranges of the calculated nuclear absorbed doses, with the lower limit corresponding to all of the intracellular activity being in the cytoplasm and the upper limit corresponding to all of the intracellular activity being in the nucleus. These data represent the results of triplicate determinations. The error bars represent the standard error of the mean (SEM). Adapted from Zanzonico et al. [9] with permission from the publisher
Assay of T Cell Accumulation Ratio (AR)
Weigh one micro-centrifuge tube labeled “Cells (C)” and two gamma counting tubes, one labeled “Medium (M)” and the other labeled “Wash (W).”
Transfer the 1 mL of radiolabeled T cells (from step 3 above) into the micro-centrifuge tube (labeled “cells (C)”).
Centrifuge the T cells at 400 × g for 5 min to pellet the cells.
Decant the medium into the counting tube labeled “Medium (M).”
Wash the cells by resuspending the pellet in fresh media.
Centrifuge the cell suspension at 400 × g for 5 min to pellet the cells.
Decant the wash medium into the tared counting tube labeled “Wash (W).”
Re-weigh the micro-centrifuge tube and the two counting tubes to determine their respective gross weights.
Subtract the tare weights of each tube from the gross weights of each tube to determine the net weight of the cells (plus any wash adherent to the cells), the media, and the wash media.
- For 1 × 10⁶ cells, the net weight of the “Cells (C)” tube will be due almost entirely to the adherent wash in that tube. Therefore, determine the count rate specifically for the labeled cells as follows:
- Calculate the cpm/gm of cells:
- Calculate the cpm/gm of medium:
-
Finally, calculate the accumulation ratio (AR):
AR values between 50 and 100 are expected.
Acknowledgments
This work was supported by NIH P50 CA86438, R01 CA163980 and R01 CA161138 grants, Mr. William H. Goodwin and Mrs. Alice Goodwin and the Commonwealth Foundation for Cancer Research and The Experimental Therapeutics Center of Memorial Sloan Kettering Cancer Center, NIH Small-Animal Imaging Research Program (SAIRP), NIH Shared Instrumentation Grant No 1 S10 RR020892-01, NIH Shared Instrumentation Grant No 1 S10 RR028889-01, and NIH Center Grants P30 CA08748 and P30 CA08748.
References
- 1.Asperti-Boursin F, Real E, Bismuth G, Trautmann A, Donnadieu E (2007) CCR7 ligands control basal T cell motility within lymph node slices in a phosphoinositide 3-kinase-independent manner. J Exp Med 204:1167–1179 [DOI] [PMC free article] [PubMed] [Google Scholar]
- 2.Salmon H, Rivas-Caicedo A, Asperti-Boursin F, Lebugle C, Bourdoncle P, Donnadieu E (2011) Ex vivo imaging of T cells in murine lymph node slices with widefield and confocal microscopes. J Vis Exp: JoVE (53):e3054. [DOI] [PMC free article] [PubMed] [Google Scholar]
- 3.Ahrens ET, Bulte JW (2013) Tracking immune cells in vivo using magnetic resonance imaging. Nat Rev Immunol 13:755–763 [DOI] [PMC free article] [PubMed] [Google Scholar]
- 4.Koehne G, Doubrovin M, Doubrovina E et al. (2003) Serial in vivo imaging of the targeted migration of human HSV-TK-transduced antigen-specific lymphocytes. Nat Biotechnol 21:405–413 [DOI] [PubMed] [Google Scholar]
- 5.Adonai N, Nguyen KN, Walsh J et al. (2002) Ex vivo cell labeling with 64Cu-pyruvaldehyde-bis (N4-methylthiosemicarbazone) for imaging cell trafficking in mice with positron-emission tomography. Proc Natl Acad Sci U S A 99:3030–3035 [DOI] [PMC free article] [PubMed] [Google Scholar]
- 6.Bansal A, Pandey MK, Demirhan YE et al. (2015) Novel (89)Zr cell labeling approach for PET-based cell trafficking studies. EJNMMI Res 5:19. [DOI] [PMC free article] [PubMed] [Google Scholar]
- 7.Liu Z, Li Z (2014) Molecular imaging in tracking tumor-specific cytotoxic T lymphocytes (CTLs). Theranostics 4:990–1001 [DOI] [PMC free article] [PubMed] [Google Scholar]
- 8.Yaghoubi SS, Campbell DO, Radu CG, Czernin J (2012) Positron emission tomography reporter genes and reporter probes: gene and cell therapy applications. Theranostics 2:374–391 [DOI] [PMC free article] [PubMed] [Google Scholar]
- 9.Zanzonico P, Koehne G, Gallardo HF et al. (2006) [131I]FIAU labeling of genetically transduced, tumor-reactive lymphocytes: cell-level dosimetry and dose-dependent toxicity. Eur J Nucl Med Mol Imaging 33:988–997 [DOI] [PubMed] [Google Scholar]


