Abstract
Many plants originating from the Asteraceae family are applied as herbal medicines and also beverage ingredients in Asian areas, particularly in China. However, they may be confused due to their similar odor, especially when ground into powder, losing their typical macroscopic characteristics. In this paper, 11 different multiple mathematical algorithms, which are commonly used in data processing, were utilized and compared to analyze the electronic nose (E-nose) response signals of different plants from Asteraceae family. Results demonstrate that three-dimensional plot scatter figure of principal component analysis with less extracted components could offer the identification results more visually; simultaneously, all nine kinds of artificial neural network could give classification accuracies at 100%. This paper presents a rapid, accurate, and effective method to distinguish Asteraceae plants based on their response signals in E-nose. It also gives insights to further studies, such as to find unique sensors that are more sensitive and exclusive to volatile components in Chinese herbal medicines and to improve the identification ability of E-nose. Screening sensors made by other novel materials would be also an interesting way to improve identification capability of E-nose.
Keywords: artificial neural networks, Asteraceae family, Chinese herbal medicine, discriminative model, electronic nose
1. Introduction
Plants used as Chinese herbal medicines (CHM) in traditional Chinese medicine system are getting more international attention based on their modern biological activities and as alternative treatments for some chronic [1] and refractory diseases [2]. Among such plants, most are also used as food ingredients, chemical materials, etc. especially in Asian countries. However, raw plants with low quality or even from the wrong source [3] are sold in the markets, resulting in wrong clinic medication, which will surely bring in economic loss, poor clinical effects, or even poisoning [4]. Therefore, there is an urgent need to establish rapid, accurate, and practical methods for medicinal plants identification.
In recent years, many modern techniques have been introduced into CHM analysis, including high-performance liquid chromatography–UV fingerprints [5], mass spectrometry, DNA genetic analysis and so on. The whole chemical profile of CHM could be expressed in different fingerprints that are used to identify original materials, especially combined with multivariate statistical analyses. As for the analyses of volatile components in CHM, gas chromatography, and gas chromatography–mass spectrometry [6] are the most popular ways to determine volatile components in CHM. However, these methods normally only detect one or more chemical compositions, and most of the given information reflects the fragments instead of the holistic state of the volatile components. They are also time-consuming, need complex sample pretreatment, and do not give environmental protection.
Compared to them, electronic nose (E-nose) is a simple, rapid, and noninvasive technology that require less sample and no organic reagents. The initial and unique chemical form of the volatile components in CHM could be reflected by their response to E-nose, which can be used to identify different CHM [7].
E-nose, which has already been applied in various fields in recent decades, is a very promising method for identifying different samples based on their different volatile components. In these studies, E-nose had been used for identifying different rice plants [8,9] and predicting storage time and quality of peanuts [10], peach [11], coffee [12], winter jujube [13], grass carp [14], etc. It has also been employed in clinical breath diagnosis [15]. The data processing methods differ in different areas, but all reach the same goal: establishing the discriminative model from response signals in E-nose with different mathematic algorithms [16]. Questions are as follows: is the data processing method unique for each research? Which one is most suitable and how to filtrate it? Could they simply be equally employed? Therefore, one of the key topics is how to screen and select the efficient discriminative model in the application of E-nose, which could certainly promote its practicability and generalization.
In CHM identification, E-nose has been used in identification [17], quality assessment [18], and geoherbalism evaluation [19] combined with various multiple mathematical algorithms, such as diffusion maps, or principal component analysis (PCA).
However, there are few studies on the comparison of various classification models including PCA, partial least squares (PLS), and artificial neural network (ANN). In this study, 11 different multiple mathematical algorithms, which are commonly used in data processing, were utilized and compared to analyze the E-nose response signals of different plants from Asteraceae family. Results demonstrate that three-dimensional plot scatter figure of PCA with less extracted components could offer the identification results more visually; simultaneously all nine kinds of ANN could give classification accuracies of 100%.
2. Materials and methods
2.1. Plant materials
Eight different species of plants, all originating from Asteraceae family, were purchased from Beijing Tongrentang Co., Ltd. (Beijing, China) and identified by Professor Y. H. Yan in Beijing University of Chinese Medicine (Beijing, China). Samples were labeled as Bai Zhu, Cang Zhu, Gong Ju, Ye Ju Hua, Ai Ye, Mu Xiang, E Bu Shi Cao, and Niu Bang Zi (Table 1).
Table 1.
Labels and origins of eight plants from Asteraceae family.
| Number | Label | Herbal name |
|---|---|---|
| 1 | Bai Zhu | Dried Rhizoma of Atractylodes macrocephala Koidz. |
| 2 | Cang Zhu | Dried Rhizoma of Atractylodes lancea (Thunb.) DC. |
| 3 | Gong Ju | Dried Flos of Chrysanthemum morifolium Ramat. |
| 4 | Ye Ju Hua | Dried Flos of Chrysanthemum indicum L. |
| 5 | Ai Ye | Dried Folium of Artemisia argyi Levl. et Vant. |
| 6 | Mu Xiang | Dried Radix of Aucklandia lappa Decne. |
| 7 | E Bu Shi Cao | Dried Herba of Centipeda minima (L.) A. Br. et Aschers. |
| 8 | Niu Bang Zi | Dried Fructus of Arctium lappa L. |
2.2. E-nose
E-nose (α-FOX3000; Alpha MOS, Toulouse, France) consists of 12 metal oxide semiconductor (MOS) sensors, a head space sampler and a signal processing system. Twelve commercial metal oxide sensors are placed in two rectangular chambers, six in each. A list of their information and their application is in Table 2. They are LY2/LG, LY2/G, LY2/AA, LY2/GH, LY2/gCTL, LY2/gCT, T30/1, P10/1, P10/2, P40/1, T70/2, and PA/2, respectively numbered as S1, S2, S3, …, S12. The sensor response was expressed as the ratio of conductance (G0/G).
Table 2.
Main application of 12 metal oxide semiconductor sensors in α-FOX3000 E-nose.
| No. | Name | Main application |
|---|---|---|
| S1 | LY2/LG | Oxidizing gas |
| S2 | LY2/G | Ammonia, carbon monoxide |
| S3 | LY2/AA | Ethanol |
| S4 | LY2/GH | Ammonia/organic amine |
| S5 | LY2/gCTL | Hydrogen sulfide |
| S6 | LY2/gCT | Propane/butane |
| S7 | T30/1 | Organic solvents |
| S8 | P10/1 | Hydrocarbons |
| S9 | P10/2 | Methane |
| S10 | P40/1 | Fluorine |
| S11 | T70/2 | Aromatic compounds |
| S12 | PA/2 | Ethanol, ammonia/organic amine |
Ground into small particles, 0.2 g of each sample was accurately weighed into a 10-mL septa-sealed bottle and loaded into the auto-sampler tray. After incubation with optimized parameters in the previous research (temperature 30°C, time 300 seconds), 2000 μL of headspace air was injected into the E-nose system automatically via a syringe and detected by the MOS sensor array. The conductance ratio of each sensor changed during the measurement process. The measurement phase lasted for 120 seconds, which was enough for all the sensors to reach stable values and return to the baseline. Signals were collected by the computer and the data acquisition cycle was 1 second.
Six repeated samples were prepared for each kind of plant and a total of 48 measurements were performed by the dynamic headspace sampling procedure. The E-nose responses values of those plants were extracted and recorded by the computer. Then different kinds of classification models were established to process the data and identify them.
2.3. Data analysis
Raw data from E-nose system were imported into software by peak values of responses. Afterwards, the processed data set was analyzed by PCA and PLS using Simca-P software (version 11.0; Umetrics AB, Umea, Sweden) after components screening and data dimension reduction. Visual identification could be obtained both from PCA and PLS including two- and three-dimensional scatter plot figures. The same peak values data set was processed via nine ANN classifiers [Bayes net, naïve Bayes bet, naïve Bayes updateable, logistic analysis, multiple layer perception, radial basis function (RBF) network, NB tree, random tree, and random forest] from WEKA software (http://www.cs.waikato.ac.nz/ml/weka/) to get the exact classification accuracies. In order to investigate the inner network structure, the same data set was imported into SPSS statistics software version 17.0, (IBM Corporation, Armonk, NY, USA) and then three layers (input layer, hidden layer, and output layer) of RBF-ANN were illustrated.
2.4. Evaluation of the classifiers
To evaluate the established models, a 10-fold cross-validation method was applied to avoid over-fitting and get the classification accuracy. The classification results should not be considered if the classification accuracy was < 80%.
3. Results and discussion
3.1. E-nose responses of herbal samples from Asteraceae family
When detecting the sensor response to a given sample, the response values are used as: R = G0/G, where R is the response, G0 is the conductance of a sensor in the reference air, and G is the conductance of the sensor in the sample gas.
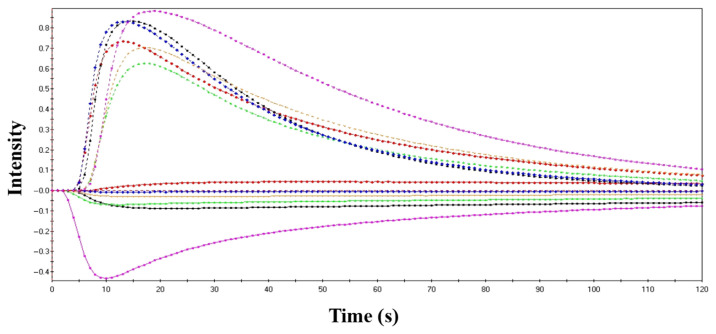
Fig. 1 shows the typical responses of 12 MOS sensors with one sample of Ai Ye (dried folium of Artemisia argyi Levl. et Vant.). Each line represents the signals of an Ai Ye sample in one of the 12 MOS sensors. The horizontal axis is the time line, a total of 120 seconds; the vertical axis is the response value of the MOS sensor. The curves represent the resistance value of each sensor against time due to the electro-valve action when the volatile compounds reached the detection chamber. In the initial period, the response value of each sensor was low and then increased continuously, and finally stabilized after a few seconds or minutes. In this study, 12 maximum response values of each sample from 12 MOS sensors were extracted and analyzed individually.
Fig. 1.
Typical responses of 12 metal oxide semiconductors measuring of a Ai Ye sample.
The repeatability of the established method was evaluated with six parallel tests of the samples. The relative standard deviation (n = 6) values of 12 MOS sensors were calculated. The results were all < 3%, proving a high repeatability of E-nose response.
3.2. PCA and PLS analysis and dimension reduction
PCA is a typical data dimension reduction analysis method that applies linear transformation to process original data from high dimensions into low dimensions. These processed data carry enough crucial information to find the inner correlation and difference among these massive amounts of information. Basically speaking, PCA helps us to determine which samples are different from the others and which principal components extracted from the original variances contribute more to this difference. It is commonly used in many areas such as human demography, quantitative geography, and molecular dynamics.
PLS is a fundamental method for data analysis based on optimal lurie function confirmation via minimizing the square of errors in the original data set. Theoretically speaking, PLS is an important derivation algorithm from multivariate linear regression analysis, canonical correlation analysis and PCA. Two of its outstanding features are: (1) it is practical in PLS system to regression modeling with less amount of variables than samples; and (2) it is easier in PLS system to distinguish the systematic noise, even some kind of random noise, which enables PLS to identify samples even with minor differences. Additionally, PLS is as popular as PCA in several fields, including economics, mechanical control engineering, drug design, etc.
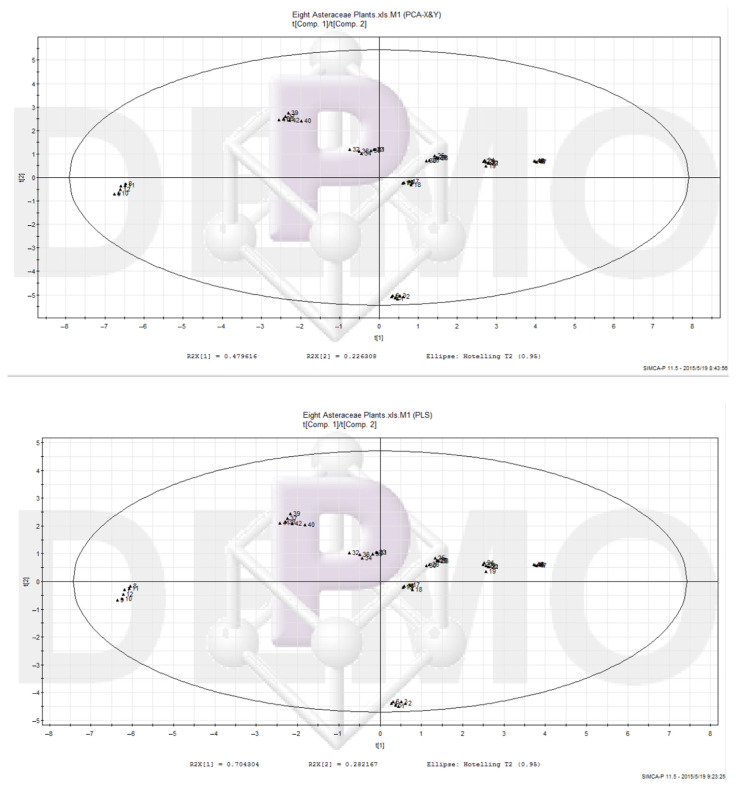
In this paper, both of them were employed to find out the characteristic information of each Asteraceae plant’s odor response signals in E-nose. As illustrated in two-dimensional scatter plots of PCA and PLS (Fig. 2), samples from eight kinds of herbal plants from Asteraceae family could be successfully classified. The left-most samples are from Cang Zhu and the lower-most samples from Bai Zhu, far away from the other six (E Bu Shi Cao, Mu Xiang, Gong Ju, Ai Ye, Ye Ju Hua, and Niu Bang Zi). From the point of sensory smell, the former two are strong while the later six are slight. In terms of chemical compositions, those two, Cang Zhu and Bai Zhu, contain more volatile oil. The others have less, or even major in other kind of chemical components. For instance, the required detecting compound in Ye Ju Hua in Chinese pharmacopeia is linarin, and in the case of Niu Bang Zi, it is arctiin, which is also glycosides. Therefore, the response signal of these plants in E-nose also offer potential information closely related to their chemical constituents, which indicates that E-nose could be a promising method to identify herbal plants not only qualitatively but also quantitatively.
Fig. 2.
Two dimensional scatter plots of principal component analysis (PCA) and partial least squares (PLS) for E-nose response signals of eight plants from Asteraceae family.
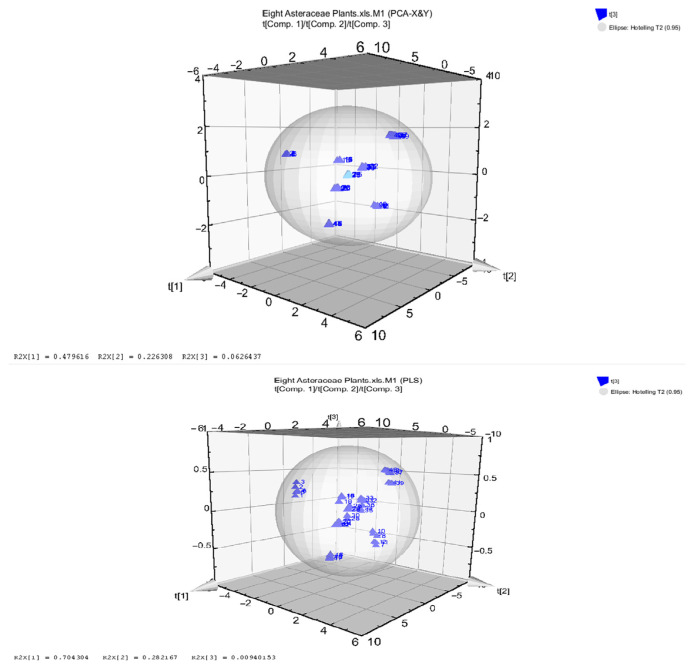
From the demonstrations in the three-dimensional scatter plots of PCA and PLS (Fig. 3), it could be visually gained that PCA did a better job than PLS. This may be a result of the different numbers of extractive components for modeling between them. Seven principal components were extracted via PCA but three more via PLS. That means there is more redundant information in the PLS classifier.
Fig. 3.
Three dimensional scatter plots of principal component analysis (PCA) and partial least squares (PLS) for E-nose response signals of eight plants from Asteraceae family.
3.3. Identification results of discriminative models from nine different ANN classifiers
Nine different kinds of ANN classifiers were utilized to obtain the precise classification accuracies and a 10-fold cross-validation method was employed to train them. The results gave us 100% for all nine (Table 3), which shows feasibility and veracity of them to identify eight kinds of herbal plants combined with E-nose. This leads us to the idea that there is no need to choose one exclusive classifier to work with E-nose. Coupled with the results of PCA and PLS, it should be significant to focus on attribution screening and redundant information reduction in the future.
Table 3.
Identification accuracies of nine types of artificial neural networks classifiers.
| Artificial neural networks classifiers | Classification accuracy through 10-folder cross-validation (%) |
|---|---|
| Bayes net | 100 |
| Naïve Bayes net | 100 |
| Naïve Bayes updateable | 100 |
| Logistic analysis | 100 |
| Multiple layer perception | 100 |
| Radial basis function network | 100 |
| NB tree | 100 |
| Random tree | 100 |
| Random forest | 100 |
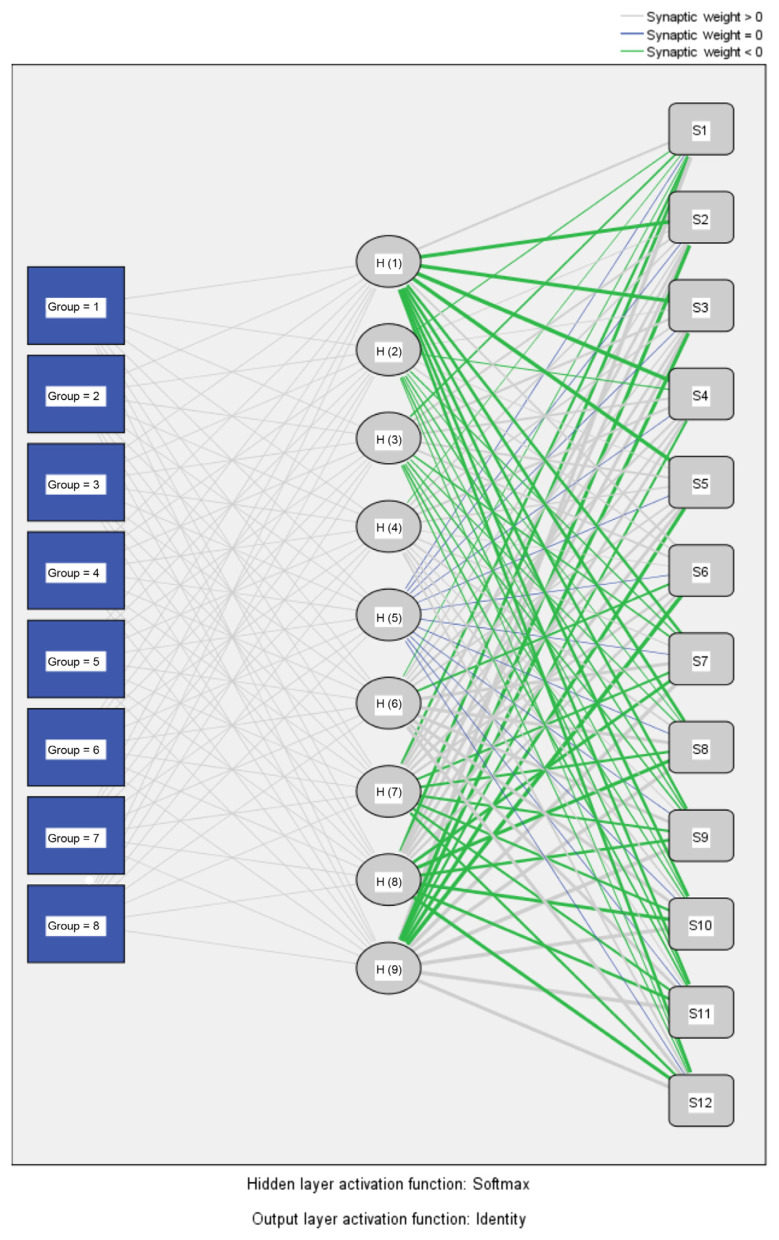
A typical architecture of RBF-ANN for training and identification is normally composed of three layers, namely the input layer, the hidden layer, and the output layer (Fig. 4). In this initial RBF-ANN model, the input layer contains 12 units from 12 MOS sensors. All the original data of the input layer were imported into the hidden layer and then calculated by RBF. Afterwards identification results were gained and the samples were divided into eight different groups. The ANN-related calculating mechanism could be explained in this way.
Fig. 4.
Architecture of three layers of radial basis function artificial neural network with 12 units in the input layer (codes stand for samples and S1–S12 stand for 12 metal oxide semiconductor sensors).
4. Conclusion
Many plants originating from the Asteraceae family are applied as herbal medicines and also beverage ingredients in Asian areas, particularly in China. However, they may be confused due to their similar odor, especially when they were ground into powder, losing their typical macroscopic characteristics. In this paper, E-nose was employed to extract and analyze the volatile components fingerprints of eight species of Asteraceae plants. PCA, PLS, and nine ANN classifiers were applied to establish the discriminative models. In PCA and PLS, eight plants could be clearly identified and PCA did a better job as told from the three dimensions scatter plot. Nine classification accuracies at 100% showed us successful models for authentication.
This paper presents a rapid, accurate, and effective method to distinguish Asteraceae plants based on their response signals in E-nose. Also, it gives insights to further studies, such as to search for some kind of unique sensor that is more sensitive and exclusive to volatile components in CHM, to improve the identification ability of E-nose. Screening sensors made by other novel materials would be also an interesting way to improve the identification capability of E-nose.
Acknowledgments
This study was supported by grants from National Natural Science Foundation of China (No. 81403054). As well, we would like to send our gratitude to China Scholarship Council providing scholarship to one of our team members and sponsoring the abroad research in University of Graz in Austria.
Funding Statement
This study was supported by grants from National Natural Science Foundation of China (No. 81403054).
Footnotes
Conflicts of interest
The authors have no personal or financial conflict of interests associated with this work.
REFERENCES
- 1. Rahte S, Evans R, Eugster PJ, Marcourt L, Wolfender JL, Kortenkamp A, Tasdemir D. Salvia officinalis for hot flushes: towards determination of mechanism of activity and active principles. Planta Med. 2013;79:753–60. doi: 10.1055/s-0032-1328552. [DOI] [PubMed] [Google Scholar]
- 2. Zhang J, Wang P, Ouyang HQ, Yin J, Liu A, Ma C, Liu L. Targeting cancer-related inflammation: Chinese herbal medicine inhibits epithelial-to-mesenchymal transition in pancreatic cancer. PloS One. 2013;8:e70334. doi: 10.1371/journal.pone.0070334. [DOI] [PMC free article] [PubMed] [Google Scholar]
- 3. Liang ZT, Jiang ZH, Leung KSY, Chan CL, Zhao Z. Authentication and differentiation of two easily confusable Chinese materia medica: Herba Solani Lyrati and Herba Aristolochiae Mollissimae. J Food Drug Anal. 2006;14:36–43. [Google Scholar]
- 4. Zhao ZZ, Hu Y, Liang ZT, Yuen JP, Jiang Z, Leung KS. Authentication is fundamental for standardization of Chinese medicines. Planta Med. 2006;72:865–74. doi: 10.1055/s-2006-947209. [DOI] [PubMed] [Google Scholar]
- 5. Qiao CF, He ZD, Han QB, Xu HX, Jiang RW, Li SL, Zhang YB, But PPY, Shaw PC. The use of lobetyolin and HPLC-UV fingerprints for quality assessment of Radix Codonopsis. J Food Drug Anal. 2007;15:258–64. [Google Scholar]
- 6. Tao NP, Wu R, Zhou PG, Gu SQ, Wu W. Characterization of odor-active compounds in cooked meat of farmed obscure puffer (Takifugu obscurus) using gas chromatography-mass spectrometry-olfactometry. J Food Drug Anal. 2014;22:431–8. doi: 10.1016/j.jfda.2014.02.005. [DOI] [PMC free article] [PubMed] [Google Scholar]
- 7. Rock F, Barsan N, Weimar U. Electronic nose: current status and future trends. Chem Reviews. 2008;108:705–25. doi: 10.1021/cr068121q. [DOI] [PubMed] [Google Scholar]
- 8. Zhou B, Wang J. Use of electronic nose technology for identifying rice infestation by Nilaparvata lugens. Sen Actu B-Chem. 2011;160:15–21. [Google Scholar]
- 9. Zhou B, Wang J. Discrimination of different types damage of rice plants by electronic nose. Biosys Engin. 2011;109:250–7. [Google Scholar]
- 10. Wei Z, Wang J, Zhang W. Detecting internal quality of peanuts during storage using electronic nose responses combined with physicochemical methods. Food Chem. 2015;177:89–96. doi: 10.1016/j.foodchem.2014.12.100. [DOI] [PubMed] [Google Scholar]
- 11. Zhang H, Wang J, Ye S, Chang M. Application of electronic nose and statistical analysis to predict quality indices of peach. Food Biopro Tech. 2012;5:65–72. [Google Scholar]
- 12. Barie N, Bücking M, Stahl U, Rapp M. Detection of coffee flavour ageing by solid-phase microextraction/surface acoustic wave sensor array technique (SPME/SAW) Food Chem. 2015;176:212–8. doi: 10.1016/j.foodchem.2014.12.032. [DOI] [PubMed] [Google Scholar]
- 13. Hui G, Jin J, Deng S, Ye X, Zhao M, Wang M, Ye D. Winter jujube (Zizyphus jujuba Mill.) quality forecasting method based on electronic nose. Food Chem. 2015;170:484–91. doi: 10.1016/j.foodchem.2014.08.009. [DOI] [PubMed] [Google Scholar]
- 14. Hui G, Wang L, Mo Y, Zhang L. Study of grass carp (Ctenopharyngodon idellus) quality predictive model based on electronic nose. Sen Actu B-Chem. 2012;166:301–8. [Google Scholar]
- 15. Wang D, Wang L, Yu J, Wang P, Hu Y, Ying K. Characterization of a modified surface acoustic wave sensor used in electronic nose for potential application in breath diagnosis. Sen Let. 2011;9:884–9. [Google Scholar]
- 16. Dong Q, Du L, Zhuang L, Li R, Liu Q, Wang P. A novel bioelectronic nose based on brain-machine interface using implanted electrode recording in vivo in olfactory bulb. Biosens Bioelectron. 2013;49:263–9. doi: 10.1016/j.bios.2013.05.035. [DOI] [PubMed] [Google Scholar]
- 17. Luo DH, Chen HQ, Yu H, Sun Y. A novel approach for classification of Chinese herbal medicines using diffusion maps. Inter J of Pattern Recog Arti Intelli. 2015;29:15500003. [Google Scholar]
- 18. Xu G, Liao C, Ren X, Zhang X, Zhang X, Liu S, Fu X, Lin H, Wu H, Huang L, Liu C, Wang X. Rapid assessment of quality of deer antler slices by using an electronic nose coupled with chemometric analysis. Revi Bras Farm. 2014;24:716–21. [Google Scholar]
- 19. Zheng S, Ren W, Huang L. Geoherbalism evaluation of Radix Angelica sinensis based on electronic nose. J Pharm Biomed Anal. 2015;105:101–6. doi: 10.1016/j.jpba.2014.10.033. [DOI] [PubMed] [Google Scholar]


