Abstract
Abstract
In Myocardial Perfusion Imaging (MPI) with Positron Emission Tomography/Computed Tomography (PET/CT) systems, accurate quantification is essential. We assessed flow quantification accuracy over various injected activities using a flow phantom.
Methods
The study was performed on the digital 4-ring Discovery MI (DMI-20) and analog Discovery 690 (D690) PET/CT systems, using 325-1257 MBq of [15O]H2O. PET performance and flow quantification accuracy were assessed in terms of count-rates, dead-time factors (DTF), scatter fractions (SF), time-activity curves (TACs), areas-under-the-curves (AUCs) and flow values.
Results
On DMI-20, prompts of 12.8 Mcps, DTF of 2.06 and SF of 46.1% were measured with 1257 MBq of activity. On the D690, prompts of 6.85 Mcps, DTF of 1.57 and SF of 32.5% were measured with 1230 MBq of activity. AUC values were linear over all activities. Mean wash-in flow error was − 9% for both systems whereas wash-out flow error was − 5% and − 6% for DMI-20 and D690. With the highest activity, wash-out flow error was − 12% and − 7% for the DMI-20 and D690.
Conclusion
DMI-20 and D690 preserved accurate flow quantification over all injected activities, with maximum error of − 12%. In the future, flow quantification accuracy over the activities and count-rates evaluated in this study should be assessed.
Supplementary Information
The online version of this article (10.1007/s12350-021-02631-9) contains supplementary material, which is available to authorized users.
Introduction
Myocardial Perfusion Imaging (MPI) with dynamic Positron Emission Tomography (PET) allows quantitative measurements of absolute Myocardial Blood Flow (MBF).1 MPI assessed using PET and short-lived tracers is highly reproducible.2-5 However, physical performance of PET systems has been a key issue in achieving accurate flow quantification over a wide range of activities.6-9 PET systems are exposed to high count-rates and dead-time when activity is present in the injected vein and heart chamber, which may compromise image accuracy and quality.10 Due to dead-time effects, time-activity curves (TACs) from left ventricle blood pool and myocardial tissue may be underestimated, resulting in MBF quantification inaccuracy.2,11-13
With the introduction of digital PET/Computed Tomography (PET/CT) systems, improvements in count-rate performance and image quality have been shown with National Electrical Manufacturers Association (NEMA) tests.14,15 Therefore, there might be potential advantages in applying digital PET/CT systems in MPI quantification. Thus, the count-rate capabilities of digital systems need to be assessed with phantom studies at high count-rates representative to MPI measurements. Evaluation of flow quantification at various injected activities is of paramount importance to understand the effects of count-rate performance, which differs among PET systems.6,7,9,16
Most importantly, flow quantification accuracy of digital PET/CT systems over various count-rates should be evaluated not only on static phantoms but with phantoms simulating dynamic imaging conditions. In 16 the authors investigated perfusion quantification accuracy at various activities by using a PET/MR compatible flow phantom. A similar phantom modelling realistic cardiac flow was presented and validated for MPI in PET in Reference 17, allowing flow modelling and quantification against a ground truth value. Thus, PET system assessment using a flow phantom allows to evaluate both count-rate performance and flow quantification accuracy.
In this study, we aimed at assessing flow quantification accuracy of a novel digital PET/CT system in comparison to an analog PET/CT system. A state-of-the-art flow phantom was selected to evaluate the accuracy of flow quantification for various activities up to 1260 MBq of [15O]H2O at scan start time.
Materials and Methods
PET/CT Systems
The digital Discovery MI with four detector rings (DMI-20) 15 and analog Discovery 690 (D690) (GE Healthcare, US) 18 PET/CT systems were assessed. Performance characteristics are summarized in Supplemental Table 1.
Table 1.
Activities at scan start time with flow meter readings. Qpump was 200 mL/min and Qcyl was 60% of Qpump
| Measurement | Activity at scan start time | Qcyl | Qtube | |||
|---|---|---|---|---|---|---|
| MBq | mL/min | ML/min | ||||
| DMI-20 | D690 | DMI-20 | D690 | DMI-20 | D690 | |
| 1 | 325 | 359 | 123 | 120 | 79.0 | 91.0 |
| 2 | 488 | 400 | 121 | 117 | 82.0 | 91.0 |
| 3 | 546 | 532 | 121 | 117 | 83.0 | 93.0 |
| 4 | 621 | 607 | 120 | 121 | 83.0 | 92.0 |
| 5 | 655 | 729 | 122 | 120 | 82.0 | 92.0 |
| 6 | 691 | 833 | 119 | 117 | 84.0 | 93.0 |
| 7 | 906 | 995 | 118 | 119 | 85.0 | 93.0 |
| 8 | 1060 | 1130 | 117 | 118 | 86.0 | 93.0 |
| 9 | 1257 | 1230 | 117 | 115 | 87.0 | 94.0 |
| Mean ± SD | - | - | 120 ± 2.2 | 118 ± 2.0 | 83.4 ± 2.4 | 92.4 ± 1.0 |
DMI-20 has 4 rings of silicon photomultiplier (SiPM) detectors. One detector block comprises 4 × 9 array of 3.95 × 5.3 × 25 mm LBS-crystals coupled to 3 × 6 array of SiPM with 2 × 3 pixels. Transaxial and axial field-of-views (FOV) are 70 cm and 20 cm.15
D690 has 24 detector rings with photomultiplier tube (PMT) blocks. One block comprises 9 × 6 array of 4.2 × 6.3 × 25 mm LBS-crystals coupled to a single square PMT with 4 anodes. Transaxial and axial FOVs are 70 cm and 15.7 cm.18
Both systems employ similar randoms, scatter and dead-time corrections in image reconstruction: randoms from singles,19 model-based scatter correction with extension to time-of-flight (TOF) 20,21 and dead-time measured from the detector pile-up losses.22,23
Flow Phantom System
To investigate flow quantification accuracy, a flow phantom (DCE Dynamic Flow Phantom, Shelley Medical Imaging Technologies, Canada) was used. Phantom validation for MPI in PET is presented in Reference 17.
The phantom set-up contains water container, peristaltic pump, injection port, phantom shell, flow constrictor valves and flow meters. The phantom schematic is shown in Supplemental Figure. 1. The shell has similar dimensions as the NEMA image quality phantom (diameter of 31 cm). An input chamber (volume of 15.7 mL) and an exchange cylinder (volume of 161 mL) containing a perforated tube (volume of 35 mL) are located inside the shell. The input chamber models the left ventricle blood pool whereas the exchange cylinder and perforated tube model tracer exchange in myocardial tissue. These allow to measure input and tissue TACs for kinetic modelling.
Flow inside the system is controlled with the peristaltic pump . Flow inside the exchange cylinder () and perforated tube () are controlled with flow constrictor valves and recorded with microturbine flow meters (Omega Engineering Inc., US).24 Ideally, and should be equal to . Reference flow () values are related to and derived from flow meter calibration using a lookup table. Further information from the flow values is given in Supplemental Figure. 1.
Kinetic Modeling of Flow Values
The input and tissue TACs can be measured by a volume-of-interest (VOI) analysis, defined for the input chamber and exchange cylinder, namely and . VOIs were selected as in Reference 5. The TACs are used for image-based flow () modelling based on a two-compartment kinetic (one-tissue compartment) model as implemented in the phantom flow quantification software (QuantifyDCE 1.1, Shelley Medical Imaging Technologies, Canada).17
The software models tracer concentration in the exchange cylinder as:
| 1 |
where represents discrete convolution operation, the time-dependent tracer concentration in the exchange cylinder, the tracer wash-in rate to the exchange cylinder (min−1), and the tracer wash-out rate from the exchange cylinder (min−1). represents tracer concentration in the perforated tube, which can be estimated from the input chamber TAC by transport delay of when Moreover, as contains contributions from both and , a signal mixing correction function is implemented as:
| 2 |
Thus, complete kinetic model consists of following free parameters: , and . Model fitting is performed with a weighted (by frame length) least squares algorithm.
The modeled parameters and can be considered analogous to rate parameters and in kinetic modelling of blood-tissue exchange. Final image-derived flow values and can be computed based on and , multiplied with the cylinder volume (), representing flow from the perforated tube to the exchange cylinder () and flow out from the exchange cylinder (). Ideally, these flow values should be equal to the reference flow value, i.e. (mL/min). 17
PET and CT Data Acquisition
At the start of the measurement, the flow meters, peristaltic pump (MasterFlex L/S, 07522-20, US) and [15O]H2O dispenser (Hidex Oy, Finland) were calibrated. Flow meter calibration and flow rates were fixed for all studies. was set to 200 mL/min, while was adjusted to 60% of , following previous protocols.5,17
A CT-based attenuation correction (CTAC) using a tube voltage of 120 kV and current of 67mAs was acquired. The flow phantom was imaged in the center of the PET FOV. Dynamic list-mode PET acquisition was started 50 s after the dose injection, with a duration of 4 min and 40 s, following the clinical protocol.25 Measurements were repeated 9 times with individual doses. Injected doses were measured automatically by the [15O]H2O dispenser (Hidex Oy, Finland), which is cross-calibrated to a Veenstra VDC-404 (Veenstra Instruments, Netherlands) dose calibrator. Activities at scan start times and flow rates are reported in Table 1.
Data Reconstruction
List-mode data was binned into 24 time-frames of 14 × 5 s, 3 × 10 s, 3 × 20 s and 4 × 30 s. On both systems, reconstructions were performed using three-dimensional ordered-subset-expectation-maximization (3D-OSEM) algorithm using point-spread function modelling (PSF) and TOF (vendor name: VUE Point FX-S), with 5 mm Gaussian post-filter and 35 cm FOV. On DMI-20, 3 iterations, 16 subsets and matrix size of 192 × 192 were used. On D690, 2 iterations, 24 subsets and matrix size of 128 × 128 were used. All data corrections including decay, attenuation, scatter, randoms and dead-time were performed.
Flow Quantification Accuracy
Count-rate performance was assessed for each measurement by extracting count-rate data from DICOM headers. Specifically, peak prompts (P), randoms (R), dead-time factors (DTF) and scatter fractions (SF) corresponding the peak prompts were extracted.
Scatter rates (S) and trues rates (T) were derived based on the extracted P, R and SF. The scatter rate was derived as:
| 3 |
and the trues rate was derived as:
| 4 |
We report the peak count-rates (P, T, R, S), DTF and SF as function of activity at scan start time.
Flow quantification accuracy was assessed in terms of shape of the input and tissue TACs and area-under-the-curve (AUC) of the TACs. Linearity of AUCs was determined with regression analysis of the AUC values versus activities at scan start time. We report AUCs and goodness-of-fits (R2) of the regression slopes.
Finally, accuracy of the modeled flow values and with respect to the reference flow was calculated as relative error:
| 5 |
where represents either or for each measurement. We report the accuracy of flow values with activity at scan start time. All flow values are reported as mean ± standard deviation (SD).
Results
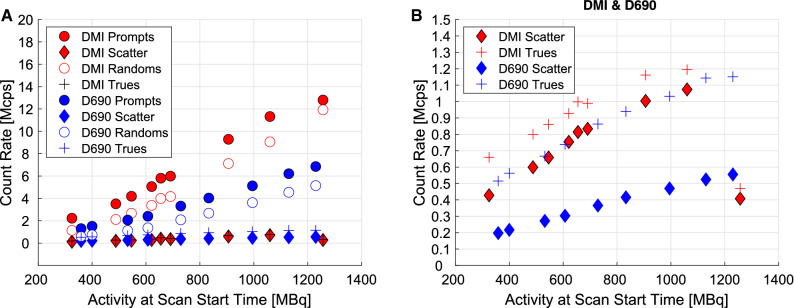
Figure 1 shows peak prompts, scatter, randoms and trues as a function of activity at scan start time on DMI-20 and D690. On both systems, count-rates increased in relation to activities, as expected. For DMI-20, peak prompts were 12.8 Mcps with 1257 MBq. On D690, peak prompts were 6.85 Mcps with 1230 MBq. Additional data of the DMI prompts and randoms for the measurement with the highest injected activity (1257 MBq) is given in Supplementary Data 1.
Figure 1.
Count-rates for (a) prompts, scatter, randoms and trues and (b) zoomed-in plot for scatter and trues for DMI-20 and D690 systems for all flow phantom measurements as a function of activity at scan start time (Table 1)
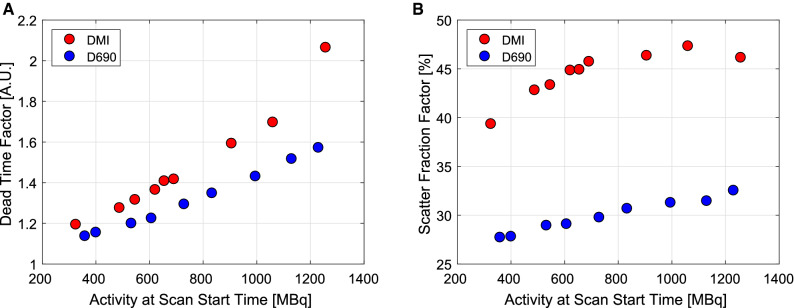
DTFs as a function of activity at scan start time are presented in Figure 2A. DTFs increased nearly linearly in relation to activities, reflecting the count-rates (Figure 1). DTFs were higher with DMI-20 compared to D690. The highest DTFs 2.06 and 1.57 were measured with 1257 MBq and 1230 MBq on DMI-20 and D690.
Figure 2.
(a) Dead-time factors (DTFs) and (b) scatter fraction factors (SFs) at peak prompts as a function of activity at scan start time for all flow phantom measurements
Figure 2B shows SFs as a function of activity at scan start time. Due to larger axial FOV, SFs were higher on DMI-20 compared to D690. SFs increased up to the three highest activities (906 MBq, 1060 MBq, 1257 MBq at scan start time), after which SFs were nearly constant on DMI-20. On D690, SFs increased in relation to all activities.
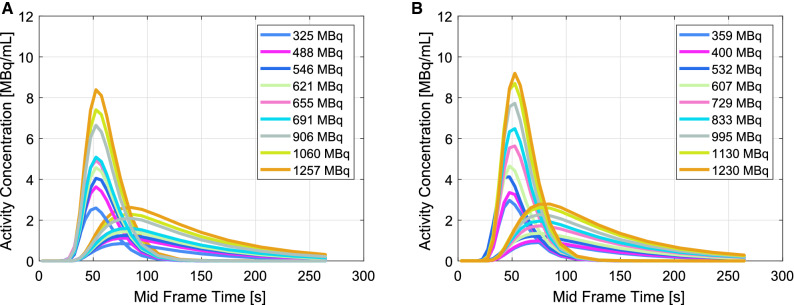
Figure 3 shows TACs derived from the input chamber and exchange cylinder of the flow phantom. No visible distortions in TAC shapes were seen. Two-compartmental model fitting R2 values were 0.998 and 0.999 on both DMI-20 and D690.
Figure 3.
Time-activity curves (TACs) measured from the input chamber (input curve) and exchange cylinder (tissue curve) on (a) Discovery MI (DMI-20) and (b) Discovery 690 (D690) PET/CT system for all flow phantom measurements
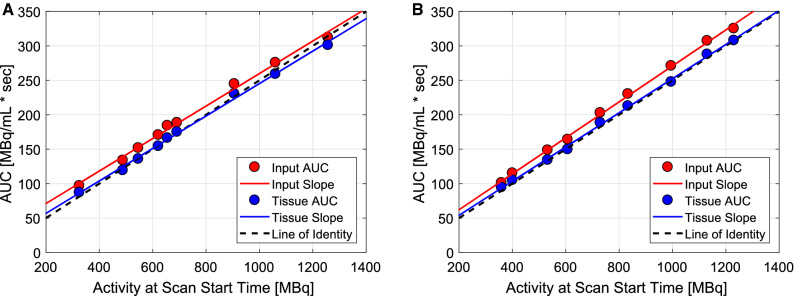
AUCs as a function of activity at scan start time with regression analysis are presented in Figure 4. R2 values for the input and tissue AUCs were 0.995 and 0.997 for DMI-20 and 0.998 and 0.998 for D690. AUCs increased linearly in relation to all activities on both systems. Tissue AUCs followed the line-of-identity closely whereas the input AUCs were above the identity line on both systems.
Figure 4.
Areas-under-the-curves (AUCs) of the time-activity curves (TACs) on the (a) Discovery MI (DMI-20) and (b) Discovery 690 (D690) PET/CT system as a function of activity at scan start time with regression slope lines and line-of-identities for all flow phantom measurements
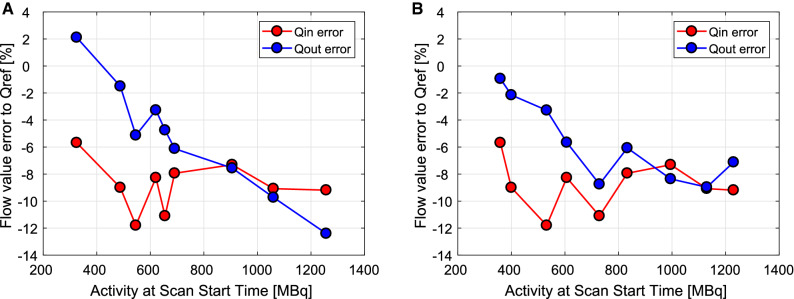
Prompts, DTFs and SFs with the accuracy of the modeled flow values are presented in Supplemental Table 2. Errors of the modeled flow values with respect to are presented as a function of activity at scan start time in Figure 5. A slight increase in error was seen above activities of 906 MBq and 995 MBq at scan start time on DMI-20 and D690. In general, the error in flow quantification accuracy was small over all count-rates and activities. Also, the error magnitude of and can be considered small (below 5%) between DMI-20 and D690.
Figure 5.
Errors of the modeled and flow values with respect to the reference flow measured on the (a) Discovery MI (DMI-20) and (b) Discovery 690 (D690) as a function of activity at scan start time for all flow phantom measurements
Discussion
We assessed the accuracy of flow quantification on digital (DMI-20) and analog (D690) PET/CT systems over various injected activities with a flow phantom, for the first time.
DMI-20 showed improved performance with higher prompts compared to D690 over similar activities (Figure 1), in line with 9 and NEMA performance studies.15 DMI-20 limits the amount of data passed to the acquisition sorter after reaching a throttle limit, due to its sensitivity. The throttle is specific for different ring configurations on DMI systems, limiting the amount of data transmitted for histogramming. The number of prompts in the DICOM header will be also capped at the scanner-specific limit due to the throttle. The DMI-20 specific 12.8 Mcps limit was reached at activity of 1257 MBq. Therefore, a sudden notch in scatter and trues rate in Figure 1A and B is seen, similarly as in Reference 16.
However, during reconstruction, a scaling factor based on the prompts seen by the coincidence processor and prompts transmitted to histogramming will be applied to preserve quantification despite the throttle. Moreover, the actual RFS estimate will be slightly lower than the value for randoms in the DICOM header above throttle, as no count losses are taken into account for the randoms value saved in the DICOM header. The interested reader is referred to Supplementary Data 1 for more information.
Higher DTFs and SFs (Figure 2) were seen on DMI-20 over all activities. SFs increased in relation to activities, stabilizing at the highest activities (Figure 2B). This might be caused by biased scatter scaling at high activities by counts outside the body contour or by increased detector scatter, which is usually seen in NEMA testing.15 However, we detected no CTAC-PET misalignment that could affect scatter scaling. In general, no artifacts were seen resulting from scatter overcorrection on either system.
For flow quantification, TACs showed no visible artifacts (Figure 3). Similarly, the input and tissue AUCs showed high linearity (R2 close to 0.99) and followed the line-of-identity well (Figure 4). Saturation of TACs and non-linearity of AUCs over activities of 594 MBq of [18F]F− 16 and saturation of input TAC with activities of 1006-1491 MBq of [82Rb] 13 have been shown previously. Saturation or non-linearity of AUCs were not seen on either system, contrary to 16 and.13 However, the input AUCs were slightly higher compared to tissue AUCs, which can contribute to the difference seen between and values (Figure 5), as we have previously discussed in.5
In line with the AUC linearity, errors in the modeled flow values were similar over all activities and systems (Figure 5). Mean error was -9% and mean error was -5% and -6% on DMI-20 and D690. The small difference between systems is contributed by different reconstruction parameters, which were selected based on clinical protocols on each system. error increased when activity increased, up to − 12% on DMI-20 at the highest activity, and up to 7% on D690. Our finding is similar to 13 measured with [82Rb], although the maximum error in (− 12%) was smaller compared to the reported error of 22%. Similarly to Reference 5, there was a systematic offset between in vs (Supplementary Table 1) and offset of 10 mL/min in Qcyl and Qtube (Table 1), which results in systematic negative bias irrespective of count-rate performance or the PET systems.
As a limitation, flow quantification was assessed only up to 1257 MBq at scan start time due to reaching the maximum limit of our [15O]H2O cyclotron production rate. Most importantly, image quantification was preserved up to highest activities. Therefore, we recommend limiting the injected activities to within the investigated range pending further investigation into values outside of this range on DMI-20 and D690. In clinical MPI studies, the injected doses for e.g. [82Rb] might exceed the limit of 1260 MBq, as both European and North American guidelines recommend injected doses from 1100 to 1500 MBq of [82Rb].26-28 At our institute, the injected activity is approximately 500 MBq, which decays to approximately 400 MBq at scan start time on both systems in clinical [15O]H2O MPI studies.
As an extension, other DMI systems should be evaluated. However, we expect that different DMI systems should behave similarly in terms of count-rate linearity despite the system-specific throttling limit. Additionally, we encourage future assessments with other perfusion tracers, such as [82Rb] or [13N] and an alternative MPI software estimation, as we only assessed [15O]H2O and the flow quantification software designed specifically for the phantom (QuantifyDCE).
Finally, our study indicates accurate MPI with [15O]H2O can be achieved if PET is acquired under the activities and count-rates specified above, as in References 6, 7, 9, and 16. The advantage of using a flow phantom is two-fold: the reference flow is always known, and CT-PET data can be collected free of any motion artefacts or misalignment. Thus, the phantom protocol used in this study could be applied for MPI harmonization studies for several PET/CT systems, according to their count-rate performance and reconstruction methods.
New Knowledge Gained
Flow quantification accuracy in MPI with PET was preserved over various injected activities on DMI-20 and D690 PET/CT systems. Mean flow quantification error was -9% for wash-in flow and − 5% and − 6% for wash-out flow on DMI-20 and D690, indicating similar flow quantification errors on both systems. As flow quantification error was − 12% at 12.8 Mcps prompts on the DMI and − 7% at 6.85 Mcps prompts on the D690, we assume DMI-20 system might offer potential benefits in MPI in PET.
Conclusions
Flow quantification accuracy was preserved over activities of 325-1257 MBq and 359-1230 MBq at scan start time on the digital 4-ring Discovery MI PET/CT system and analog Discovery 690 PET/CT system using [15O]H2O. The measurement with the highest prompts rate of 12.8 Mcps with corresponding DTF of 2.06 showed flow quantification error of − 12% on DMI-20. On D690 the highest prompts rate of 6.85 Mcps with corresponding DTF of 1.57 showed an error of − 7%. Generally, Discovery MI 4-ring system might offer potential benefits in MPI PET, although future studies should be conducted to assess the system performance at higher injected activities and prompt rates. We recommend performing MPI under 1257 MBq of activity at scan start time and a prompts rate of 12.8 Mcps on DMI-20.
Supplementary Information
Below is the link to the electronic supplementary material.
Acknowledgments
The authors acknowledge Shelley Medical Imaging Technologies for technical assistance and Floris Jansen (GE Healthcare) for technical discussion about the DMI throttle limit and information concerning the count-rate data. The study was conducted within the Finnish Center of Excellence in Molecular Imaging in Cardiovascular and Metabolic Research supported by the Academy of Finland, University of Turku, Turku University Hospital and Åbo Akademi University.
Funding
This project (15HLT05 PerfusImaging, 19SIP04 TracPETperf) has received funding from the EMPIR programme co-financed by the Participating States and from the European Union’s Horizon 2020 research and innovation programme, from the Academy of Finland (Grant No. 314483, Project MINMOTION), State Research Funding (the expert responsibility area of Turku University Hospital) (Project No. 13236) and Instrumentarium Science Foundation.
Disclosures
The authors declare no conflict of interest.
Abbreviations
- MPI
Myocardial perfusion imaging
- PET
Positron emission tomography
- MBF
Myocardial blood flow
- TAC
Time-activity curve
- PET/CT
Positron emission tomography/computed tomography
- NEMA
National Electrical Manufacturers Association
- DMI-20
Discovery MI with 4 detector rings
- SiPM
Silicon photomultiplier
- FOV
Field-of-view
- D690
Discovery 690
Funding
Open access funding provided by University of Turku (UTU) including Turku University Central Hospital.
Footnotes
This article includes a PowerPoint file that should be made available as ESM on SpringerLink.
The authors of this article have provided a PowerPoint file, available for download at SpringerLink, which summarises the contents of the paper and is free for re-use at meetings and presentations. Search for the article DOI on SpringerLink.com.
Publisher's Note
Springer Nature remains neutral with regard to jurisdictional claims in published maps and institutional affiliations.
References
- 1.Danad I, Uusitalo V, Kero T, Saraste A, Raijmakers PG, Lammertsma AA, et al. Quantitative assessment of myocardial perfusion in the detection of significant coronary artery disease: Cutoff values and diagnostic accuracy of quantitative [15O]H2O PET imaging. J Am Coll Cardiol. 2014;64:1464–1475. doi: 10.1016/j.jacc.2014.05.069. [DOI] [PubMed] [Google Scholar]
- 2.Kero T, Nordström J, Harms HJ, Sörensen J, Ahlström H, Lubberink M. Quantitative myocardial blood flow imaging with integrated time-of-flight PET-MR. EJNMMI Phys. 2017;4:1–13. doi: 10.1186/s40658-016-0171-2. [DOI] [PMC free article] [PubMed] [Google Scholar]
- 3.Kaufmann PA, Gnecchi-Ruscone T, Yap JT, Rimoldi O, Camici PG. Assessment of the reproducibility of baseline and hyperemic myocardial blood flow measurements with 15O-labeled water and PET. J Nucl Med. 1999;40:1848–1856. [PubMed] [Google Scholar]
- 4.El Fakhri G, Kardan A, Sitek A, Dorbala S, Abi-Hatem N, Lahoud Y, et al. Reproducibility and accuracy of quantitative myocardial blood flow assessment with 82Rb PET: Comparison with 13 N-ammonia PET. J Nucl Med. 2009;50:1062–1071. doi: 10.2967/jnumed.104.007831. [DOI] [PMC free article] [PubMed] [Google Scholar]
- 5.Siekkinen R, Teuho J, Smith NAS, Fenwick A, Kirjavainen AK, Koskensalo K, et al. Study of the effect of reconstruction parameters for myocardial perfusion imaging in PET with a novel flow phantom. Front Phys. 2020;8:1–10. doi: 10.3389/fphy.2020.00148. [DOI] [Google Scholar]
- 6.Renaud JM, Yip K, Guimond J, Trottier M, Pibarot P, Turcotteet E, et al. Characterization of 3-dimensional PET systems for accurate quantification of myocardial blood flow. J Nucl Med. 2017;58:103–109. doi: 10.2967/jnumed.116.174565. [DOI] [PubMed] [Google Scholar]
- 7.De Kemp RA, Klein R, Renaud J, Alghamdi A, Lortie M, DaSilva JN, et al. 3D List-mode Cardiac PET for simultaneous quantification of myocardial blood flow and ventricular function. IEEE Nucl Sci Symp Conf Rec. 2008 doi: 10.1109/NSSMIC.2008.4774409. [DOI] [Google Scholar]
- 8.Nazir MS, Gould S-M, Milidonis X, Reyes E, Ismail TF, Nejiet R, et al. Simultaneous 13 N-Ammonia and gadolinium first-pass myocardial perfusion with quantitative hybrid PET-MR imaging: A phantom and clinical feasibility study. Eur J Hybrid Imaging. 2019 doi: 10.1186/s41824-019-0062-6. [DOI] [PMC free article] [PubMed] [Google Scholar]
- 9.van Dijk JD, Jager PL, van Osch JAC, Khodaverdi M, van Dalen JA. Comparison of maximal Rubidium-82 activities for myocardial blood flow quantification between digital and conventional PET systems. J Nucl Cardiol. 2019;26:1286–1291. doi: 10.1007/s12350-017-1156-9. [DOI] [PubMed] [Google Scholar]
- 10.Nordström J, Kero T, Harms HJ, Widström C, Flachskampf FA, Sörensen J, et al. Calculation of left ventricular volumes and ejection fraction from dynamic cardiac-gated 15O-water PET/CT: 5D-PET. EJNMMI Phys. 2017 doi: 10.1186/s40658-017-0195-2. [DOI] [PMC free article] [PubMed] [Google Scholar]
- 11.Moody JB, Lee BC, Corbett JR, Ficaro EP, Murthy VL. Precision and accuracy of clinical quantification of myocardial blood flow by dynamic PET: A technical perspective. J Nucl Cardiol. 2015;22:935–951. doi: 10.1007/s12350-015-0100-0. [DOI] [PubMed] [Google Scholar]
- 12.Juneau D, Erthal F, Ohira H, Mc Ardle B, Hessian R, deKemp RA, et al. Clinical PET myocardial perfusion imaging and flow quantification. Cardiol Clin. 2016;34:69–85. doi: 10.1016/j.ccl.2015.07.013. [DOI] [PubMed] [Google Scholar]
- 13.Lassen ML, Manabe O, Otaki Y, Eisenberg E, Huynh PT, Wang F, et al. 3D PET/CT 82Rb PET myocardial blood flow quantification: Comparison of half-dose and full-dose protocols. Eur J Nucl Med Mol Imaging. 2020;47(13):3084–3093. doi: 10.1007/s00259-020-04811-0. [DOI] [PubMed] [Google Scholar]
- 14.National Electrical Manufacturers Association. Performance Measurements of Positron Emission Tomographs. NEMA Standards publication NU2-2012; 2012.
- 15.Hsu DFC, Ilan E, Peterson WT, Uribe J, Lubberink M, Levin CS. Studies of a next-generation silicon-photomultiplier-based Time-of-Flight PET/CT system. J Nucl Med. 2017;58:1511–1518. doi: 10.2967/jnumed.117.189514. [DOI] [PubMed] [Google Scholar]
- 16.O’Doherty J, Chalampalakis Z, Schleyer P, Nazir MS, Chiribiri A, Marsden PK. The effect of high count rates on cardiac perfusion quantification in a simultaneous PET-MR system using a cardiac perfusion phantom. EJNMMI Phys. 2017 doi: 10.1186/s40658-017-0199-y. [DOI] [PMC free article] [PubMed] [Google Scholar]
- 17.Gabrani-Juma H, Clarkin OJ, Pourmoghaddas A, Driscoll B, Wells RG, deKemp RA, et al. Validation of a multimodality flow phantom and its application for assessment of dynamic SPECT and PET technologies. IEEE Trans Med Imaging. 2017;36:132–141. doi: 10.1109/TMI.2016.2599779. [DOI] [PubMed] [Google Scholar]
- 18.Bettinardi V, Presotto L, Rapisarda E, Picchio M, Gianolli L, Gilardi MC. Physical performance of the new hybrid PETCT discovery-690. Med Phys. 2011;38:5394–411. doi: 10.1118/1.3635220. [DOI] [PubMed] [Google Scholar]
- 19.Stearns CW, McDaniel DL, Kohlmyer SG, Arul PR, Geiser BP, Shanmugam V. Random coincidence estimation from single event rates on the Discovery ST PET/CT scanner. 2003 IEEE Nucl Sci Symp Conf Rec (IEEE Cat No03CH37515); 2004. 10.1109/NSSMIC.2003.1352545.
- 20.Ollinger JM. Model-based scatter correction for fully 3D PET. Phys Med Biol. 1996;41:153–176. doi: 10.1088/0031-9155/41/1/012. [DOI] [PubMed] [Google Scholar]
- 21.Iatrou M, Manjeshwar RM, Stearns CW. Comparison of two 3D implementations of TOF Scatter Estimation in 3D PET. IEEE Nucl Sci Symp Conf Rec. 2007;5:3474–3477. doi: 10.1109/NSSMIC.2007.4436878. [DOI] [Google Scholar]
- 22.Lewellen TK, Kohlmyer SG, Miyaoka RS, Schubert S, Stearns CW. Investigation of the count rate performance of the General Electric Advance positron emission tomograph. Nucl Sci Symp Med Imaging Conf Rec. 1994;3:1169–1173. doi: 10.1109/NSSMIC.1994.474637. [DOI] [Google Scholar]
- 23.Stearns CW. Estimating an acquisition-specific NEC curve for PET acquisitions. 2003 IEEE Nucl Sci Symp Conf Rec (IEEE Cat No03CH37515), vol. 4, p. 2578-80. 10.1109/nssmic.2003.1352417.
- 24.Driscoll B, Keller H, Jaffray D, Coolens C. Development of a dynamic quality assurance testing protocol for multisite clinical trial DCE-CT accreditation. Med Phys. 2013;10(1118/1):4812429. doi: 10.1118/1.4812429. [DOI] [PubMed] [Google Scholar]
- 25.Maaniitty T, Stenström I, Bax JJ, Uusitalo V, Ukkonen H, Kajander S, et al. Prognostic value of coronary CT angiography with selective PET perfusion imaging in coronary artery disease. JACC Cardiovasc Imaging. 2017;10:1361–1370. doi: 10.1016/j.jcmg.2016.10.025. [DOI] [PubMed] [Google Scholar]
- 26.Murthy VL, Bateman TM, Beanlands RS, Berman DS, Borges-Neto S, Chareonthaitawee P, et al. Clinical quantification of myocardial blood flow using PET: Joint position paper of the SNMMI cardiovascular council and the ASNC. J Nucl Med. 2018;59:273–293. doi: 10.2967/jnumed.117.201368. [DOI] [PubMed] [Google Scholar]
- 27.Dilsizian V, Bacharach SL, Beanlands RS, Bergmann SR, Delbeke D, Dorbala S, et al. ASNC imaging guidelines/SNMMI procedure standard for positron emission tomography (PET) nuclear cardiology procedures. J Nucl Cardiol. 2016;23:1187–1226. doi: 10.1007/s12350-016-0522-3. [DOI] [PubMed] [Google Scholar]
- 28.Hesse B, Lindhardt TB, Acampa W, Anagnostopoulos C, Ballinger J, Bax JJ, et al. EANM/ESC guidelines for radionuclide imaging of cardiac function. Eur J Nucl Med Mol Imaging. 2008;35:851–885. doi: 10.1007/s00259-007-0694-9. [DOI] [PubMed] [Google Scholar]
Associated Data
This section collects any data citations, data availability statements, or supplementary materials included in this article.


