Abstract
Aims/hypothesis
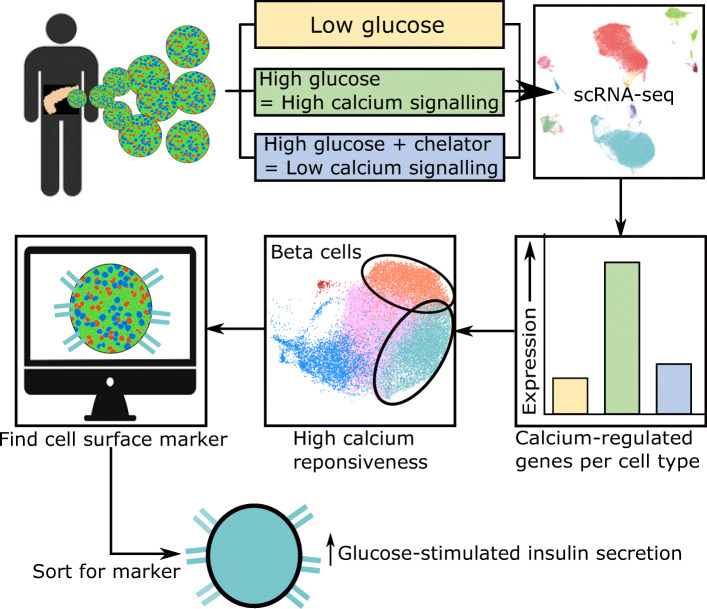
Pancreatic islets depend on cytosolic calcium (Ca2+) to trigger the secretion of glucoregulatory hormones and trigger transcriptional regulation of genes important for islet response to stimuli. To date, there has not been an attempt to profile Ca2+-regulated gene expression in all islet cell types. Our aim was to construct a large single-cell transcriptomic dataset from human islets exposed to conditions that would acutely induce or inhibit intracellular Ca2+ signalling, while preserving biological heterogeneity.
Methods
We exposed intact human islets from three donors to the following conditions: (1) 2.8 mmol/l glucose; (2) 16 mmol/l glucose and 40 mmol/l KCl to maximally stimulate Ca2+ signalling; and (3) 16 mmol/l glucose, 40 mmol/l KCl and 5 mmol/l EGTA (Ca2+ chelator) to inhibit Ca2+ signalling, for 1 h. We sequenced 68,650 cells from all islet cell types, and further subsetted the cells to form an endocrine cell-specific dataset of 59,373 cells expressing INS, GCG, SST or PPY. We compared transcriptomes across conditions to determine the differentially expressed Ca2+-regulated genes in each endocrine cell type, and in each endocrine cell subcluster of alpha and beta cells.
Results
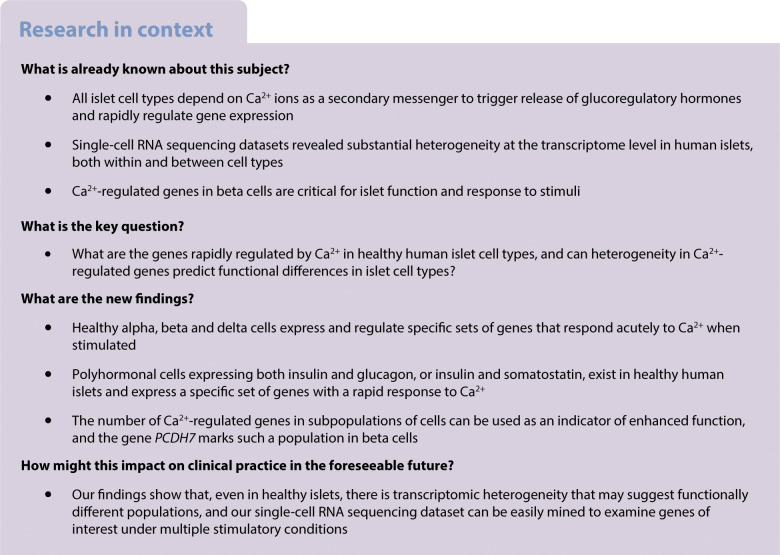
Based on the number of Ca2+-regulated genes, we found that each alpha and beta cell cluster had a different magnitude of Ca2+ response. We also showed that polyhormonal clusters expressing both INS and GCG, or both INS and SST, are defined by Ca2+-regulated genes specific to each cluster. Finally, we identified the gene PCDH7 from the beta cell clusters that had the highest number of Ca2+-regulated genes, and showed that cells expressing cell surface PCDH7 protein have enhanced glucose-stimulated insulin secretory function.
Conclusions/interpretation
Here we use our large-scale, multi-condition, single-cell dataset to show that human islets have cell-type-specific Ca2+-regulated gene expression profiles, some of them specific to subpopulations. In our dataset, we identify PCDH7 as a novel marker of beta cells having an increased number of Ca2+-regulated genes and enhanced insulin secretory function.
Data availability
A searchable and user-friendly format of the data in this study, specifically designed for rapid mining of single-cell RNA sequencing data, is available at https://lynnlab.shinyapps.io/Human_Islet_Atlas/. The raw data files are available at NCBI Gene Expression Omnibus (GSE196715).
Graphical abstract
Supplementary Information
The online version contains peer-reviewed but unedited supplementary material available at 10.1007/s00125-022-05718-1.
Keywords: Calcium signalling, Islet heterogeneity, Islets of Langerhans, Polyhormonal cells, Single-cell RNA sequencing, Transcriptional regulation
Introduction
The pancreatic islets of Langerhans is a glucoregulatory micro-organ composed of insulin-secreting beta cells, glucagon-secreting alpha cells and somatostatin-secreting delta cells. Like most electrically excitable secretory cells, islets require calcium (Ca2+) influx to secrete glucoregulatory hormones. However, intracellular Ca2+ leads to other processes in islets, including transcription [1]. As recently reviewed [1], two main pathways regulate Ca2+-dependent transcription: (1) the calmodulin-dependent protein kinase (CAMK)/cAMP response element-binding protein (CREB) pathway [1–6]; and (2) the calcineurin (CaN)/nuclear factor of activated T cells (NFAT) pathway [1, 7]. Due to the complexities of Ca2+ signalling and the ready availability of mouse and human beta cell lines, most studies have focused on Ca2+ signalling specifically in beta cells [5, 8, 9].
Using single-cell RNA sequencing (scRNA-seq), it is now possible to study multiple cell types in islets simultaneously. A number of human islet scRNA-seq datasets have focused on how diabetes alters the islet transcriptome, identifying rare cell types, and coupling function to transcriptomes [10–15]. Here, we used scRNA-seq to identify rapidly responding Ca2+-regulated genes in islet cell types. We generated a large-scale adult human islet dataset from three donors, using islets exposed to three experimental conditions. Our large scRNA-seq dataset is available as a user-friendly web tool for studying islet heterogeneity and transcriptional response to stimuli.
Methods
For detailed methods, primers and antibodies, please refer to electronic supplementary materials (ESM) Methods.
Human islets
Human islets were isolated by the University of Alberta Islet Research or Clinical Cores as described (dx.doi.org/10.17504/protocols.io.x3mfqk6, accessed 20 January 2021). Details of donor metrics and functional data are available at https://www.epicore.ualberta.ca/IsletCore/ and are summarised in Table 1 and the Human Islets Checklist in the ESM.
Table 1.
Summary of sequenced donor data and numbers of sequenced cells
| Characteristic | Donor ID | ||
|---|---|---|---|
| R253 | R282 | R317 | |
| Age (years) | 57 | 57 | 54 |
| Sex | Male | Male | Male |
| Height (m) | 1.78 | 1.86 | 1.8 |
| Weight (kg) | 81.1 | 91.5 | 85.5 |
| BMI (kg/m2) | 25.5 | 26.4 | 26.4 |
| HbA1c (mmol/mol) | 31.1 | 43.2 | 32.2 |
| HbA1c (%) | 5.0 | 6.0 | 5.1 |
| Diabetes | None | None | None |
| No. of sequenced cellsa | 17,645 | 33,770 | 49,033 |
| Average reads/cell | 37,911 | 21,447 | 14,841 |
| No. of cells in Fig. 1bb | 12,753 | 21,372 | 34,525 |
Data show a high degree of similarity between donor biometrics. Further data on donor islets are available at Alberta Diabetes Institute Islet Core Facility (https://www.epicore.ualberta.ca/IsletCore/) and in the Human Islets Checklist in the ESM
aThe number of cells per donor that were sequenced, prior to the filtering and quality control
bThe number of cells per donor that were sequenced and passed all filtering and quality control thresholds
Human islet stimulation and dispersion
Islets were handpicked into CMRL 1066 medium (VWR, USA; CA45001–114) and incubated overnight at 37°C in a humidified CO2 incubator. The next morning, 450 islets per donor were handpicked into three wells (150 islets/well) of a 12-well plate containing Krebs-Ringer bicarbonate HEPES (KRBH) medium (2.8 mmol/l glucose) and incubated at 37°C for 1 h. Next, the islets were incubated for 1 h in a new well containing KRBH under one of three experimental conditions: Low (2.8 mmol/l glucose); Positive (25 mmol/l glucose, 40 mmol/l KCl); or Negative (25 mmol/l glucose, 40 mmol/l KCl, 5 mmol/l EGTA).
Islets were washed with PBS (Mg2+/Ca2+-free) containing 0.5 mmol/l EDTA, then dispersed for 12–15 min in 200 μl of 0.25% trypsin/EDTA at 37°C. Trypsinisation was quenched with 25% FBS (1 ml; in PBS). Cells were centrifuged for 3 min at 200 g, the supernatant fraction was removed, and cells were resuspended in 300 μl of PBS with 2% FBS. Cell were filtered through a 40 μm cell strainer (Corning, USA; 352,340). Cells were counted prior to centrifugation and resuspension in PBS at 1000 cells/μl for scRNA-seq.
NanoString gene profiling assay
Fifty islets from each donor batch were used to assess islet quality by profiling expression of 132 human islet genes (ESM Table 1). Gene expression was measured using nCounter prep kits and nCounter SPRINT profiler according to manufacturer’s instructions (NanoString, USA).
scRNA-seq
Libraries were generated with 10x Genomics (USA) Chromium single-cell 3′ reagent kits according to the manufacturer’s instructions. Version 2 reagent kits were used for donors R253 and R282, and Version 3 was used for donor R317. Each experimental condition was labelled as a sample, with a total of three samples per donor. Completed libraries were pooled and sequenced on the Illumina (USA) NextSeq500.
Immunofluorescence staining
Briefly, 100–200 human islets per donor were fixed in 4% paraformaldehyde for 1 h, embedded in 2% agarose, paraffin-embedded, and sectioned at 5 μm. The sections were de-paraffinised, rehydrated, blocked and incubated with primary antibodies at 4°C overnight in PBS containing 5% horse serum. Sections were washed and incubated with secondary antibodies for 1 h at 22°C. Sections were imaged using a Leica SP8 confocal microscope.
Fluorescence in situ hybridisation
Sections (5 μm) of embedded human islets or human pancreas biopsies were probed for human INS and GCG mRNA using RNAscope fluorescent multiplex v2 kit according to manufacturer’s instructions (ACDbio, USA).
FACS and reaggregation of protocadherin 7-positive cells
Human islets were dispersed as above, washed with PBS, and incubated with rabbit AlexFluor647-labelled anti-protocadherin 7 (PCDH7) antibodies (Bioss Antibodies, USA; bs-11085R-A647) on ice for 30 min. Cells were washed with PBS, filtered (40 μm), resuspended in 500 μl of 2% FBS in PBS, and sorted using a BD FACSAria IIu (BD Biosciences, USA). Sorted PCDH7+ and PCDH7− cells were plated onto a Corning Elplasia 96-well round bottom ultra-low attachment microcavity microplate (Corning, USA; 4442) at 80 aggregates/well (1000 cells/aggregate) and cultured in CMRL medium for 48 h prior to determining glucose-stimulated insulin secretion (GSIS).
GSIS assay
Islets from donors R366, R367, R369, H2330, H2337 and H2338 were incubated in KRBH with 2.8 mmol/l glucose for 1 h, then sequentially stimulated with 2.8 mmol/l glucose, 16 mmol/l glucose, and 2.8 mmol/l glucose with 40 mmol/l KCl in KRBH for 1 h at 37°C. Human C-peptide ELISA kits (Mercodia, Sweden; 10-1136-01) were used and stimulation index was calculated by normalising to values at 2.8 mmol/l glucose.
Quantitative PCR
Reaggregated PCDH7+ and PCDH7− cells were harvested for RNA isolation and RT-PCR was performed. Taqman quantitative PCR (qPCR) was performed to assess expression levels of PCDH7, INS, ERO1B, NKX6-1 and SLC30A8.
Analysis of scRNA-seq data
Briefly, raw sequencing files were processed using 10x Genomics software CellRanger v.3.0.2. Quality control and filtering steps were performed with R packages Scater v.1.0.4 [16] and Seurat version 3 [17]. Clustering, differentially expressed genes (DEG) analysis, and finding Ca2+-regulated genes were performed with Seurat. RNA Velocity analysis was performed with the Python package scVelo v.0.2.1 (Theis lab, Germany; https://github.com/theislab/scvelo) [18].
Statistical analysis
All DEG were determined as those with an adjusted p value (padjusted) less than 0.05 using a non-parametric Wilcoxon rank sum test. Student’s t test was performed on qPCR data, with significance defined as p<0.05. All statistical analyses were performed using Rstudio or GraphPad Prism software v.8.0.1.
Results
Human islet scRNA-seq and identification of cell types
We generated islet single-cell libraries from three healthy male, BMI- and age-matched donors (Table 1). Islet quality was assessed prior to library generation by comparing potential islet donor gene expression (panel of 132 genes) to that in islets from 107 healthy people (ESM Table 1).
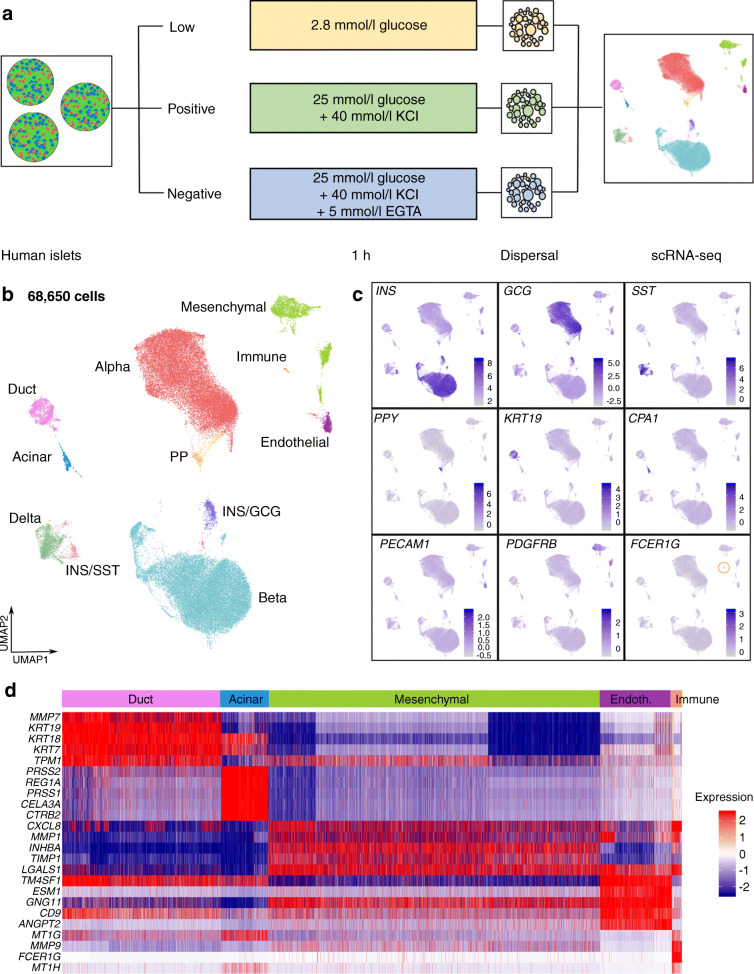
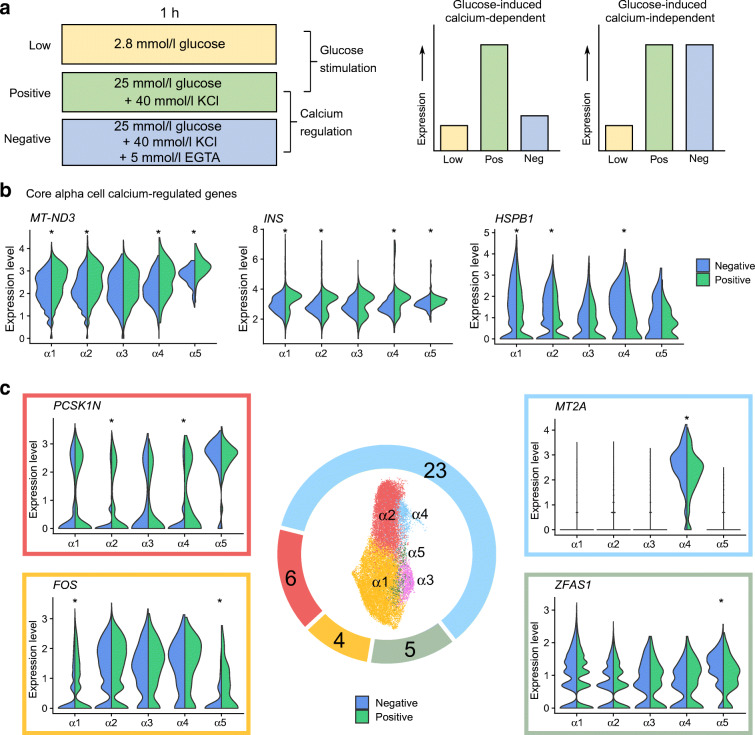
To study islet cell Ca2+-regulated genes, we stimulated islets for 1 h under the following conditions: (1) ‘Low’ glucose to ‘stimulate’ alpha cells and inhibit beta cells; (2) ‘Positive’, a high glucose/high KCl stimulus to depolarise cells and stimulate Ca2+ influx; and (3) ‘Negative’, a control condition with high glucose/high KCl stimulus and Ca2+ chelator EGTA (Fig. 1a). The short stimulation time was to ensure the detection of only the most robust and acutely Ca2+-regulated genes.
Fig. 1.
scRNA-seq of human islets. (a) Schematic of experimental design. (b) Uniform Manifold Approximation and Projection (UMAP) plot of 68,650 cells, clustered and labelled by cell type. (c) Feature plots showing expression of marker genes for each cell type. The immune cell cluster with high and specific FCER1G expression is highlighted by the yellow circle. (d) Heatmap of top five DEG for each non-endocrine cell type vs all other cell types. Expression is shown as log10 fold change. Endoth., endothelial; GCG, glucagon; INS, insulin; SST, somatostatin
Of 100,448 sequenced cells, 68.7% passed the filtering and quality control thresholds, resulting in 68,992 cells as 25 clusters (ESM Fig. 1a). We removed non-endocrine clusters smaller than 200 cells that were poorly integrated across donors (ESM Table 2 and ESM Fig. 1a). The remaining clusters showed similar proportions of Low, Positive and Negative cells, implying that clustering was minimally influenced by experimental conditions and that existing biological heterogeneity was preserved (ESM Fig. 1b). This supported our goal of designing experimental conditions that would allow us to investigate Ca2+-regulated genes and islet heterogeneity with the same dataset.
In the 68,650 cells remaining after the removal of clusters, we identified all expected cell types, including 60,851 endocrine and 7799 non-endocrine cells (Fig. 1b and ESM Fig. 1c, d). We determined cluster identity using expression of known marker genes for alpha, beta, delta, pancreatic polypeptide (PP; encoded by PPY)-expressing, duct, acinar and endothelial cells (Fig. 1c). We observed two clusters expressing both INS and GCG (INS/GCG) or both INS and SST (INS/SST). We detected 1203 ghrelin (encoded by GHRL)-expressing cells across the dataset, but not as a distinct cluster (ESM Fig. 1f).
We next determined DEG in each cell type. As expected, genes coding for islet hormones (e.g. INS, GCG, SST and PPY) or well-known ductal and acinar markers (e.g. KRT19 and CPA1) were within the top ten DEG of their respective cell types (Fig. 1d and ESM Table 3). From this list of genes, we identified INHBA and TIMP1 as markers of the mesenchymal clusters (ESM Fig. 1e). We showed that ESM1 and PLVAP expression specifically marked islet endothelial cells (Fig. 1b and ESM Fig. 1e). We found 127 FCER1G-expressing resident macrophages (Fig. 1c,d) [19].
Alpha and beta cells have distinct cluster-specific gene expression profiles
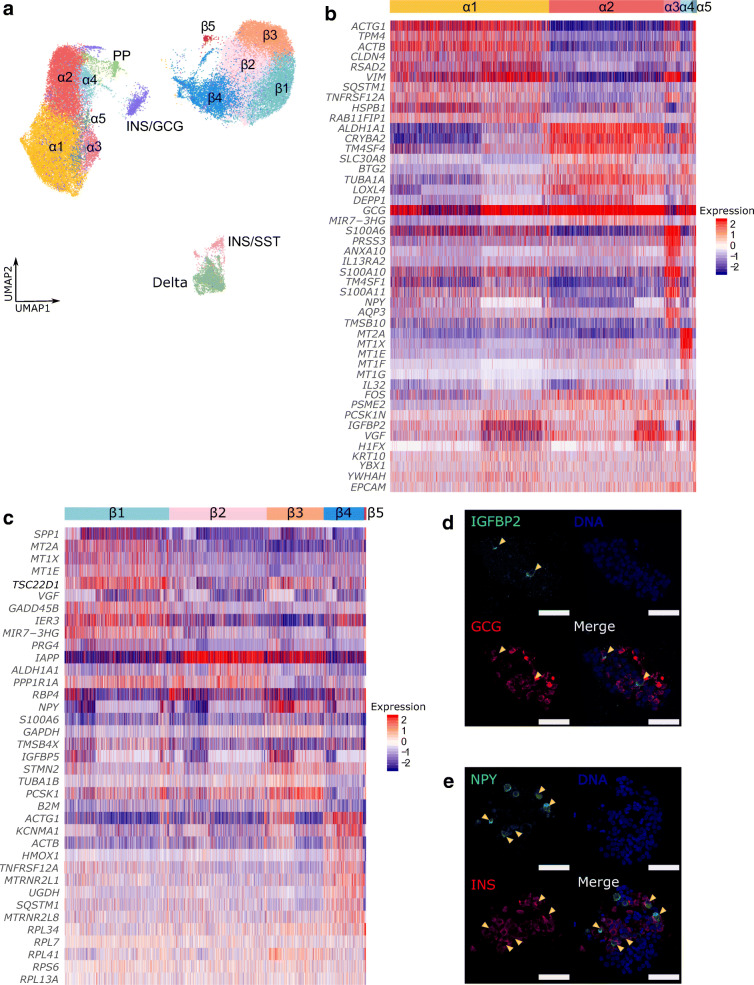
We subsetted and reclustered 59,373 alpha, beta, delta, PP, INS/GCG and INS/SST cells for further analysis (42% alpha cells, 48% beta cells, 4.6% delta cells, 1.4% PP cells, 2.9% INS/GCG cells and <1% INS/SST cells; ESM Fig. 2a, b). We visualised five alpha cell clusters and five beta cell clusters, which we named α1–α5 and β1–β5, respectively (Fig. 2a) and obtained the top 10 DEG per cluster in each cell type to find cluster-specific marker genes (ESM Tables 4, 5).
Fig. 2.
Heterogeneity within alpha and beta cells. (a) UMAP plot of reclustered endocrine cells. (b, c) Heatmap of top ten enriched genes in each alpha cell cluster (b) and each beta cell cluster (c), with representative genes shown. Expression is shown as log10 fold change. (d) Representative images of human islet sections immunostained for insulin-like growth factor binding protein 2 (green) and glucagon (red), with arrowheads indicating IGFBP2+ GCG+ cells. (e) Representative images of human islet sections immunostained for insulin (red) and neuropeptide Y (green), with arrowheads indicating NPY+ INS+ cells. See the Human Islets Checklist (ESM) for donors used for immunostaining. Scale bars, 50 μm. GCG, glucagon; IGFBP2, insulin-like growth factor binding protein 2; INS, insulin; NPY, neuropeptide Y; SST, somatostatin
In alpha cells, α1 and α3 clusters were similar and expressed TMP4 and CLDN4 (Fig. 2b and ESM Fig. 2c). Likewise, clusters α2 and α4 were similar and expressed novel alpha cell markers [12] ALDH1A1, CRYBA2 and TM4SF4. Notably, cluster α3 was enriched for PRSS3, a digestive serine protease-coding gene [20] and α4 was enriched for three metallothionein genes, MT2A, MT1X and MT1E, suggesting increased protective capacity against oxidative stress [21]. Despite its small cell numbers, the α5 cluster DEG list showed IGFBP2 had high cluster specificity, which we detected with immunostaining in a few glucagon-positive alpha cells (Fig. 2d).
Within beta cells, the β1 cluster expressed SPP1, MT2A, MT1X and MT1E, much like the α4 cluster (Fig. 2c and ESM Fig. 2c). Cluster β2 had a lacklustre number of DEG but showed high expression levels of IAPP. High protein levels of human islet amyloid polypeptide are associated with a pathological islet, beta cell maturity or beta cell dysfunction [22, 23]. Cluster β3 expressed elevated levels of NPY, which has been shown to mark immature beta cells [24]. We detected neuropeptide Y protein in a subset of insulin- expressing cells (Fig. 2e). Cluster β4 uniquely expressed KCNMA1, encoding an α-subunit for a Ca2+-sensitive potassium channel, and had reduced expression of PCSK1, encoding the prohormone convertase. Cluster β4 also expressed higher levels of mitochondrial transcripts (data not shown), which supports previous observations [25]. Cluster β5 did not express any DEG. Rather, this cluster was characterised by low expression of key beta cell maturation markers such as PDX1, UCN3 and ERO1B (ESM Fig. 3a) and could comprise transcriptionally immature beta cells, such as virgin beta cells [26].
To determine whether cluster β5 was ‘metabolically immature’, we examined genes involved in the tricarboxylic acid (TCA) cycle, oxidative phosphorylation (OxPhos) and glycolysis. In all gene panels, cluster α1 consistently showed overall lower expression, while α5 had elevated expression of TCA cycle genes but reduced expression of OxPhos genes (ESM Fig. 3b). In beta cells, cluster β5 showed reduced expression of TCA cycle and glycolysis genes but elevated expression of OxPhos genes (ESM Fig. 3c), similar to virgin beta cells that have reduced TCA cycle and OxPhos gene expression [26]. It is likely that the transcriptional immaturity suggested by lower expression of beta cell identity genes in cluster β5 is linked to an immature metabolic state. These results imply a small proportion of metabolically unique alpha and beta cells exist in the adult human islet.
Identification of Ca2+-regulated gene sets in alpha cells
We next focused on the Ca2+- and glucose-regulated transcription in endocrine cells by pairwise comparison of transcriptomes from different conditions between each cluster in each cell type. A gene that is expressed at low levels in low glucose (Low), high levels in response to depolarisation and calcium signalling (Positive) and at low levels when calcium signalling is inhibited by EGTA (Negative) would indicate a typical Ca2+-regulated gene (Fig. 3a).
Fig. 3.
Ca2+-regulated genes in alpha cells. (a) Schematic for the strategy of identifying Ca2+-regulated and glucose-regulated genes, and example gene expression profiles across conditions for ideal Ca2+-dependent and Ca2+-independent genes. (b) Split-violin plots showing core Ca2+-regulated genes in α1–α5 clusters. (c) Total number of Ca2+-regulated genes per cluster shown in the donut pie chart, with representative gene expression levels in Positive (green) and Negative (blue) conditions. *padjusted<0.05
In alpha cells, two genes were Ca2+-regulated in all clusters (except for α3, which had no detectable Ca2+-regulated genes). These were the mitochondrial gene MT-ND3, which encodes NADH dehydrogenase I, and INS (Fig. 3b). HSPB1 was calcium-regulated in α1, α2 and α4, rounding out the ‘Core’ alpha cell Ca2+-regulated genes. We also found cluster-specific Ca2+-regulated genes (Fig. 3c and ESM Table 6). Cluster α4, which highly expressed metallothionein genes, expressed the highest number of cluster-specific Ca2+-regulated genes (Figs 2b, 3b and ESM Table 6). Interestingly, α4 regulated typical beta cell genes such as IAPP and INS. Notably, ZFAS1, a long non-coding RNA [27], was regulated in cluster α5 (Fig. 3c). Overall, eight Ca2+-regulated genes were shared between two or more clusters, 17 were unique to α4 and two were unique to α5. By the absolute number of Ca2+-regulated genes, we suspect that α4 is the most Ca2+-responsive cluster, while α3 may have a blunted Ca2+ response.
Since alpha cells secrete glucagon under low glucose conditions, we also compared Low and Negative conditions. In contrast to the comparison between Positive and Negative conditions, the Low vs Negative comparison showed no Core genes. The most common was the transcription factor gene JUNB, which was expressed at higher levels in the Low condition in α1, α3 and α4 (ESM Table 6 and ESM Fig. 4a–c). As expected, 13 out of 15 genes were expressed at higher levels in the Low condition, except for IRF1 in α3 and α4, and ZFAS1 in α5 (ESM Fig. 4d, e).
Identification of Ca2+-regulated gene sets in beta and delta cells
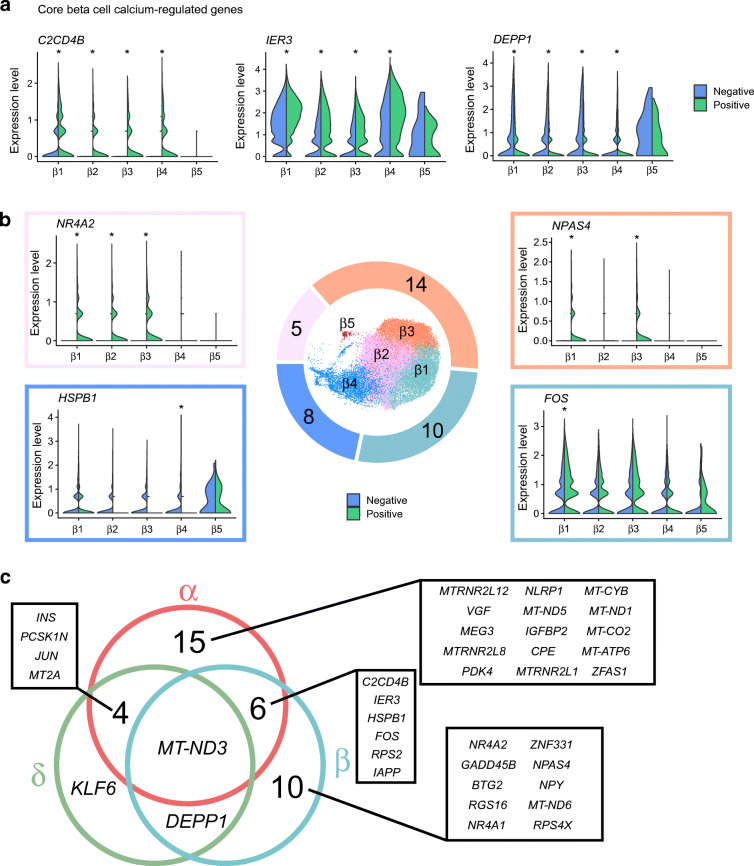
Unlike alpha cells, beta and delta cells secrete hormones when ambient glucose levels are high, and have similar intracellular mechanisms downstream of glucose uptake [28]. Therefore, we focused on first identifying the Ca2+-regulated genes by comparing Positive vs Negative conditions. Cluster β5 had no detectable Ca2+-regulated genes (ESM Table 6), further supporting our idea that β5 is dysfunctional or immature compared with other beta cells (ESM Fig. 3a, c). Such populations have been shown before [26]. The other four clusters had a Core list of Ca2+-regulated genes: C2CD4B; IER3; and DEPP1 (Fig. 4a). Following the Core list, there are several known Immediate Early Genes shared between two or three clusters, including NR4A1 and NR4A2 [29], with β1 and β3 having the highest degree of overlap. FOS was the only Ca2+-regulated gene specific to cluster β1, while β2 had no unique Ca2+-regulated genes, and β4 had three unique Ca2+-regulated genes (Fig. 4b). β3 expressed the highest number of Ca2+-regulated genes, including known activity-regulated genes like IAPP and NPAS4 [30, 31], and novel genes ZNF331 and BTG2 (ESM Fig. 5a, ESM Table 6). In sum, β3 is the most Ca2+-responsive beta cell cluster, and beta cells have an overall more homogeneous Ca2+-regulated profile than alpha cells.
Fig. 4.
Ca2+-regulated genes in beta cells. (a) Split-violin plots showing ‘Core’ genes that are significantly Ca2+-regulated in β1–β4 clusters. (b) Total number of Ca2+-regulated genes per cluster shown in the donut pie chart, with representative gene expression levels in Positive (green) and Negative (blue) conditions. *padjusted<0.05. (c) Venn diagram of shared and unique Ca2+-regulated genes between alpha (α), beta (β) and delta (δ) cells
We next compared the Low and Positive conditions to determine the glucose-regulated profile for beta cells (ESM Table 6). In cluster β3, NR4A1, NR4A2, BTG2, RGS16, IER3 and NPAS4 were all glucose-induced and Ca2+-regulated but NPY and ZNF331 were only Ca2+-regulated (ESM Fig. 5a, c, d and ESM Table 6). Conversely, C2CD4B was only glucose-induced in the β3 cluster, while FTH1 was glucose-inhibited (higher expression in Low) and not Ca2+-regulated (ESM Fig. 5e). From these lists, we see that not all glucose-regulated genes are Ca2+-regulated, and we can identify purely Ca2+-regulated genes using our methods.
In delta cells, seven Ca2+-regulated genes and 11 glucose-regulated genes were detected, with only INS present in both categories (Fig. 4c, ESM Fig. 6a and ESM Table 6). KLF6 was the only Ca2+-regulated gene unique to delta cells, while six out of 11 genes were only glucose-regulated in delta cells (ESM Fig. 6a, b). Notably, GCG, INS and PPY were glucose-regulated genes in delta cells, even though they are canonically specific to adult alpha, beta and PP cells, respectively.
Characterisation of INS/GCG and INS/SST clusters
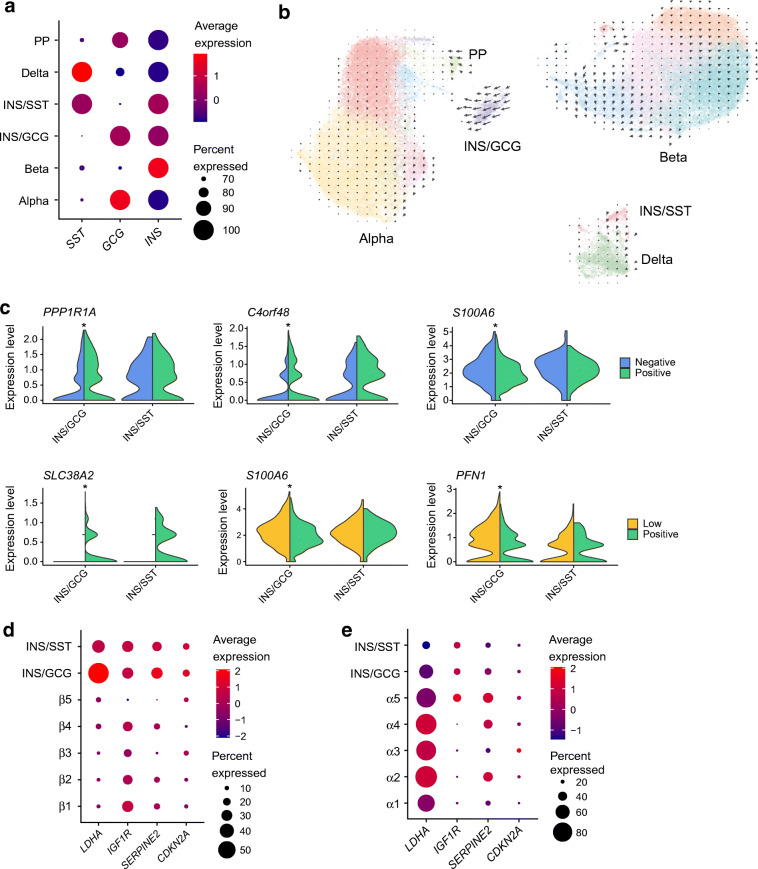
Our dataset showed two clusters that co-expressed INS and GCG, or INS and SST (Fig. 5a and ESM Fig. 2a). We do not believe these are sequencing artefacts composed of doublets, for the following reasons. First, there are multiple filtering steps in our analysis pipeline that are designed to remove cells suspected of being doublets. Second, comparing the number of genes and transcripts per cell across all endocrine cells in our dataset shows that INS/GCG and INS/SST cells are similar to other cell types, and are not the cells that are closest to the upper limit of genes and transcripts (ESM Fig. 7a, b). However, it is possible for a true doublet and INS/GCG or INS/SST cells to have overlapping transcriptomes and to have a similar number of genes. Third, housekeeping gene levels are comparable between INS/GCG and INS/SST cells and other endocrine cells (ESM Fig. 7c). Fourth, we did not detect any GCG/SST cells within our dataset; these would be present in similar numbers to the INS/SST or INS/GCG cells if these clusters resulted from doublets. Finally, we observed islet cells that expressed both INS and GCG mRNA using RNA FISH in sections of both ex vivo embedded islets and human pancreas biopsies from multiple male donors (ESM Fig. 8a, b). Overall, we are confident that INS/GCG and INS/SST cells are a bona fide cell type in adult human islets.
Fig. 5.
The INS/GCG and INS/SST clusters. (a) Dot plot showing average expression of INS, SST and GCG in each endocrine cell type compared with every other cell type. (b) RNA Velocity vectors from scVelo projected onto clusters in UMAP space. (c) Split-violin plots showing representative Ca2+-regulated and glucose-regulated genes in INS/GCG and INS/SST clusters. *padjusted<0.05. (d, e) Dot plots showing average expression levels of known markers of human beta cell senescence across the INS/GCG and INS/SST clusters, compared with β1–β5 clusters (d) and α1–α5 clusters (e). GCG, glucagon; INS, insulin; SST, somatostatin
To investigate whether INS/GCG and INS/SST cells could be a transitional state between transdifferentiating cells, we performed RNA Velocity analysis with scVelo [18]. As expected, we saw minimal trajectories across clusters within a cell type (Fig. 5b). There were clear trajectories originating from the INS/GCG cluster going towards the alpha cells but no trajectories from any monohormonal cell type going towards the multihormonal clusters. Thus, these cells were most likely not transdifferentiating or dedifferentiating. Finally, the multihormonal cells expressed similar levels of beta or alpha cell markers when compared with beta or alpha cells (ESM Fig. 7d, e).
Next, we determined the Ca2+- and glucose-regulated genes for the multihormonal clusters and compared with other cell types. We found 43 Ca2+-regulated and 15 glucose-regulated genes in the INS/GCG cluster, and seven Ca2+-regulated and seven glucose-regulated genes in the INS/SST cluster (ESM Table 6). Thirteen out of 15 Ca2+-induced genes in the INS/GCG cluster were also regulated in alpha and beta cells, while all but one of the Ca2+-suppressed genes were unique to INS/GCG cells (ESM Fig. 9a). All 13 of the glucose-induced genes were also regulated in beta cells, but the seven genes that had higher expression in the Low condition were unique to INS/GCG cells (ESM Fig. 9b).
Given the age of the sequenced donors, it is possible that the multihormonal clusters are senescent cells [32–34]. We compared the average expression of previously identified senescence markers across alpha, beta and multihormonal clusters. CDKN2A and SERPINE2 showed slightly higher expression in the INS/GCG cluster compared with beta cell clusters (Fig. 5d). Expression of IGF1R in multihormonal cells was similar to that in beta cells but greater than that in alpha cells (Fig. 5d,e).
In addition to senescence markers, we found that the beta cell ‘disallowed’ gene LDHA [35] was robustly expressed in the majority of INS/GCG cells when compared with beta cells but not alpha cells (Fig. 5d,e). We can conclude that, at least at the mRNA level, INS/GCG cells can be characterised by high LDHA and IGF1R expression, different from normal adult alpha and beta cells.
PCDH7 is a marker of a novel beta cell subtype with elevated function
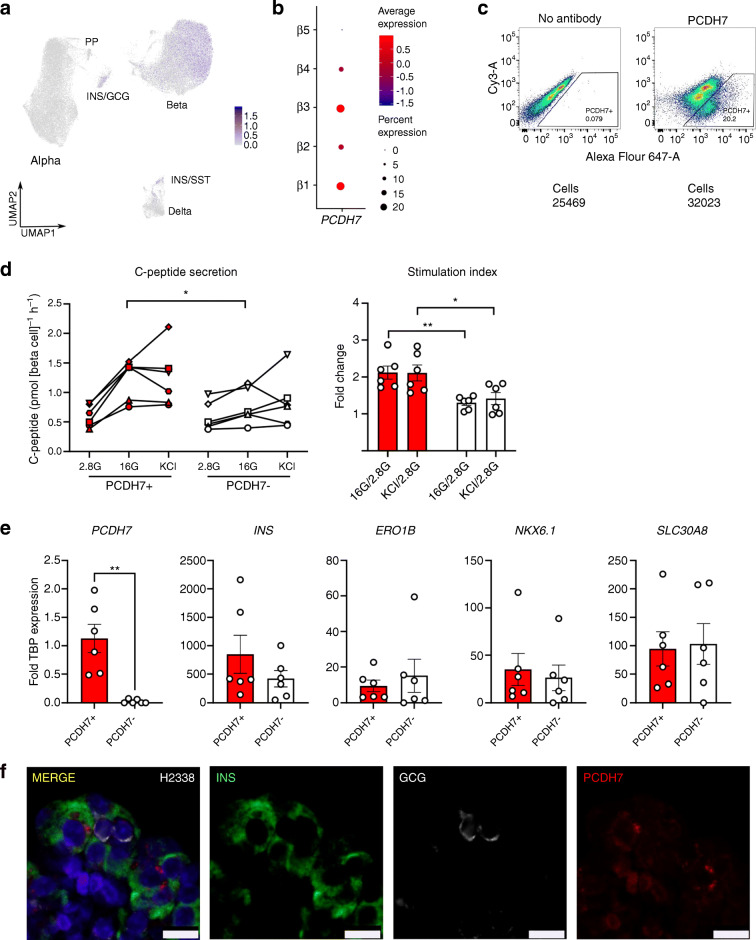
Heterogeneity within beta and alpha cells at the mRNA or functional level has been shown before, with or without scRNA-seq [10, 12, 14, 26, 36–38]. We found that β1 and β3 clusters expressed the most Ca2+-regulated genes and activity-regulated genes (Fig. 4b and ESM Table 6). We were interested in further studying cells in the β1 and β3 clusters, and decided to look for cell surface markers that could be used to enrich for this highly Ca2+-responsive population. We found that PCDH7, a previously unappreciated marker, was expressed in beta, INS/GCG and INS/SST cells (Fig. 6a). Its expression was particularly enriched in the β1 and β3 clusters, while it was absent in the β5 cluster (Fig. 6b). In addition, PCDH7 was shown as one of the DEG for CD9-negative beta cells with elevated GSIS, but was not explored as a marker of this elevated function [37]. Therefore, we hypothesised that PCDH7 was a marker of mature beta cells with elevated function.
Fig. 6.
PCDH7 marks beta cells with enhanced GSIS. (a) UMAP plot of PCDH7 expression in endocrine cells. (b) Dot plot showing PCDH7 expression across beta cell clusters. (c) Sorting protocol used to isolate PCDH7+ beta cells from human islets. (d) C-peptide concentrations from a static GSIS performed on reaggregated PCDH7+ and PCDH7− beta cells from donors R366, R367, R369, H2330, H2337 and H2338, shown as separate symbols (see the Human Islets Checklist [ESM] for more details). Cells were exposed to 2.8 mmol/l glucose (2.8G), 16 mmol/l glucose (16G), and 40 mmol/l KCl (KCl). (e) qPCR for key beta cell maturity genes in PCDH7+ and PCDH7− sorted cells. (f) Immunostaining for INS (green), PCDH7 (red), GCG (white) and DAPI (blue) in a representative islet section of donor H2338. Scale bar, 10 μm *p<0.05 and **p<0.01. GCG, glucagon; INS, insulin; SST, somatostatin
Based on PCDH7 expression levels, we divided all beta cells into PCDH7-high and PCDH7-low cells (Fig. 6a). Out of the 28,534 beta cells, 5629 (19.7%) cells were PCDH7-high. A DEG analysis comparing PCDH7-high cells and PCDH7-low cells revealed only four genes that were enriched in PCDH7-high cells: PCDH7, SPP1, TSC22D1 and NEFM (ESM Table 7). Since SPP1 had already been identified as a DEG in the β1 cluster, this finding supports the fact that most PCDH7-high cells were part of the β1 cluster (Fig. 2c). TSC22D1 encodes a member of the leucine zipper transcription factors that can be induced by TGF-β signalling [39] but has no reported role in islets. NEFM, a neurofilament gene, may be involved in proliferation in human beta cells [40].
To validate whether PCDH7-high cells were functionally different, we sorted human islets using an antibody for PCDH7. Similar to our scRNA-seq data, we obtained a maximum of 20% of PCDH7+ cells (Fig. 6c). We reaggregated these sorted PCDH7+ and PCDH7− cells, then performed static GSIS to assess function from secreted C-peptide. PCDH7+ cells showed roughly twofold higher GSIS compared with PCDH7− cells, with similar total KCl-induced insulin secretion (Fig. 6d). We observed no significant differences in INS expression with qPCR (Fig. 6e). We can conclude that the enhanced GSIS in PCDH7+ cells was not due to differences in total insulin expression or maturity state, shown by expression levels of beta cell maturity genes ERO1B, SLC30A8 and NKX6–1. Furthermore, immunostaining of human islets showed that PCDH7 was present on the membrane of some insulin-positive beta cells but was absent in glucagon-positive alpha cells (Fig. 6f). In conclusion, we show that while it is unknown whether PCDH7 is mechanistically involved in the enhanced function, correlating Ca2+-regulated gene expression to function in islet cells is a novel method of identifying cells with functional heterogeneity using scRNA-seq data.
Discussion
Here, we used a large-scale, multi-conditional human islet scRNA-seq dataset of over 68,000 cells to identify Ca2+-regulated genes in adult alpha, beta and delta cells. We also showed distinct clusters of polyhormonal cells that express their own unique Ca2+-regulated profile, and histologically validated these cells in human islets. Finally, we found that a proportion of beta cells with the most Ca2+-regulated genes is marked by PCDH7, and these cells have greater GSIS function, establishing PCDH7 as a novel marker of beta cells with enhanced function.
A limitation of our study is the low number of donors we used to generate the single-cell dataset. Nevertheless, we used scRNA-seq to identify Ca2+-regulated genes in each islet cell type and demonstrated that the number of Ca2+-regulated genes is indicative of cell maturity and function.
One unexpected finding was the regulation of INS expression in non-beta cell populations. INS was detected as a Ca2+-regulated gene in four out of five alpha cell clusters and in delta cells, albeit at lower levels overall compared with beta cell clusters (Fig. 5a). One possibility is that the non-physiological stimulatory conditions could have led to abnormal expression and regulation of INS in alpha and delta cells. While alpha cells can respond to high glucose, their activation and glucagon secretion would normally be inhibited in a hyperglycaemic environment due to paracrine signalling from beta cells and delta cells [41–45]. However, we exposed the islets to high glucose and directly depolarised all populations, a condition that would not occur physiologically but might occur pathophysiologically in diabetes. It is possible that under these conditions, non-beta cells can express a low level of INS. Whether this is translated to the protein level is unknown but could have implications in the aetiology of type 2 diabetes.
While our goal was not to specifically study rare cell populations, we found cells that expressed both INS and GCG, or both INS and SST. We are not the first to detect so-called ‘polyhormonal’ cells, as others have found cells that express two or even three characteristic endocrine genes [10, 12, 46–48]. We did not observe any progenitor gene expression, so it is unlikely that this resulted from dedifferentiation of mature cells. In previous studies, there have been very few polyhormonal cells relative to the overall dataset. However, we saw enough INS/GCG and INS/SST cells that distinctly clustered away from alpha, beta and delta cells (Figs 1b and 2a). While we do not know the biological role of these cells within the islet, the cells express unique sets of Ca2+-regulated genes, and both LDHA and IGF1R. In the future, it would be ideal to isolate this population from human islets for closer study.
Finally, we attempted to find any rare beta cells that were previously established, such as virgin beta cells, hub beta cells and senescent beta cells [26, 32, 38, 49]. There was no single cluster that perfectly aligned with published gene expression profiles of these rare populations. While we did find the cluster β5 lacked expression of many key beta cell genes, this cluster was very small and showed lower levels of transcripts compared with other clusters. In this case, the lack of gene expression is not a compelling argument of immaturity.
In summary, our multi-condition human islet scRNA-seq dataset demonstrates that the differences in Ca2+-regulated genes that we see in our dataset could be associated with islet cell function and maturity.
Supplementary information
(PDF 6.64 mb)
(XLSX 399 kb)
Acknowledgements
We thank members of the Lynn laboratory and the Canadian Islet Research and Training Network for their helpful discussions and technical support. We thank Tatsuya Kin, James Lyon and Joss Manning Fox for provision of human islets. We thank the families of the human islet donors who made this research possible.
Authors’ relationships and activities
The authors declare that there are no relationships or activities that might bias, or be perceived to bias, their work.
Contribution statement
JSY and FCL designed the overall research. JSY, MYYL, SS and CN performed experiments. JSY, SS, MYYL, JV and HW analysed data. JSY, SS, JV, HW and FCL wrote the manuscript. JV designed and made the website. All authors read and edited the manuscript before giving final approval of the version to be published. FCL is responsible for the integrity of the work as a whole.
Abbreviations
- DEG
Differentially expressed genes
- GCG
Glucagon
- GSIS
Glucose-stimulated insulin secretion
- INS
Insulin
- KRBH
Krebs-Ringer Bicarbonate HEPES
- OxPhos
Oxidative phosphorylation
- PCDH7
Protocadherin 7
- PP
Pancreatic polypeptide
- qPCR
Quantitative PCR
- scRNA-seq
Single-cell RNA sequencing
- SST
Somatostatin
- TCA
Tricarboxylic acid
- UMAP
Uniform Manifold Approximation and Projection
Funding
This work was supported by Transitional Open Operating Grant support to FCL from the Canadian Institutes of Health Research (MOP 142222). Salary (FCL) was supported by the Michael Smith Foundation for Health Research (no. 5238 BIOM) and the BC Children’s Hospital Research Institute. Fellowship support was provided by the BC Children’s Hospital Research Institute (to JSY and MYYL), the Canucks For Kids Fund (to JSY), the JDRF (to SS), the Michael Smith Foundation for Health Research (SS), the Manpei Suzuki Foundation (to SS) and the University of British Columbia (to JSY, MYYL and JV).
Data availability
All data needed to evaluate the conclusions in the paper are present in the paper and/or the ESM. Requests for resources and further information should be directed to the lead contact, Francis C. Lynn (francis.lynn@ubc.ca). Sequencing data are available at NCBI Gene Expression Omnibus (GSE196715). A searchable and user-friendly format of the data in this study is available at https://lynnlab.shinyapps.io/Human_Islet_Atlas/.
Footnotes
This article has been retracted. Please see the retraction notice for more detail: https://doi.org/10.1007/s00125-023-05983-8
Publisher’s note
Springer Nature remains neutral with regard to jurisdictional claims in published maps and institutional affiliations.
Change history
8/4/2023
This article has been retracted. Please see the Retraction Notice for more detail: 10.1007/s00125-023-05983-8
References
- 1.Sabatini PV, Speckmann T, Lynn FC. Friend and foe: β-cell ca 2+ signaling and the development of diabetes. Mol Metab. 2019;21(2018):1–12. doi: 10.1016/j.molmet.2018.12.007. [DOI] [PMC free article] [PubMed] [Google Scholar]
- 2.Chin D, Means AR. Calmodulin: A prototypical calcium sensor. Trends Cell Biol. 2000;10(8):322–328. doi: 10.1016/S0962-8924(00)01800-6. [DOI] [PubMed] [Google Scholar]
- 3.Hoeflich KP, Ikura M. Calmodulin in action: diversity in target recognition and activation mechanisms. Cell. 2002;108(6):739–742. doi: 10.1016/S0092-8674(02)00682-7. [DOI] [PubMed] [Google Scholar]
- 4.Wayman GA, Tokumitsu H, Davare MA, Soderling TR. Analysis of CaM-kinase signaling in cells. Cell Calcium. 2011;50(1):1–8. doi: 10.1016/j.ceca.2011.02.007. [DOI] [PMC free article] [PubMed] [Google Scholar]
- 5.Persaud SJ, Liu B, Sampaio HB, Jones PM, Muller DS. Calcium/calmodulin-dependent kinase IV controls glucose-induced Irs2 expression in mouse beta cells via activation of cAMP response element-binding protein. Diabetologia. 2011;54(5):1109–1120. doi: 10.1007/s00125-011-2050-7. [DOI] [PubMed] [Google Scholar]
- 6.Yu X, Murao K, Sayo Y, et al. The role of calcium/calmodulin-dependent protein kinase cascade in glucose upregulation of insulin gene expression. Diabetes. 2004;53(6):1475–1481. doi: 10.2337/diabetes.53.6.1475. [DOI] [PubMed] [Google Scholar]
- 7.Crabtree GR, Schreiber SL. Snapshot: calcium-calcineurin-NFAT signaling. Cell. 2010;138(1):1–4. doi: 10.1016/j.cell.2009.06.026.SnapShot. [DOI] [PMC free article] [PubMed] [Google Scholar]
- 8.Bernal-Mizrachi E, Cras-Méneur C, Ye BR, Johnson JD, Permutt MA. Transgenic overexpression of active calcineurin in β-cells results in decreased β-cell mass and hyperglycemia. PLoS One. 2010;5(8):e11969. doi: 10.1371/journal.pone.0011969. [DOI] [PMC free article] [PubMed] [Google Scholar]
- 9.Jhala US, Canettieri G, Screaton RA, et al. cAMP promotes pancreatic β-cell survival via CREB-mediated induction of IRS2. Genes Dev. 2003;17(13):1575–1580. doi: 10.1101/gad.1097103. [DOI] [PMC free article] [PubMed] [Google Scholar]
- 10.Segerstolpe Å, Palasantza A, Eliasson P, et al. Single-cell transcriptome profiling of human pancreatic islets in health and type 2 diabetes. Cell Metab. 2016;24(4):593–607. doi: 10.1016/j.cmet.2016.08.020. [DOI] [PMC free article] [PubMed] [Google Scholar]
- 11.Avrahami D, Wang YJ, Schug J, et al. Single-cell transcriptomics of human islet ontogeny defines the molecular basis of β-cell dedifferentiation in T2D. Mol Metab. 2020;42(July):1–14. doi: 10.1016/j.molmet.2020.101057. [DOI] [PMC free article] [PubMed] [Google Scholar]
- 12.Muraro MJ, Dharmadhikari G, Grün D, et al. A single-cell transcriptome atlas of the human pancreas. Cell Syst. 2016;3(4):385–394. doi: 10.1016/j.cels.2016.09.002. [DOI] [PMC free article] [PubMed] [Google Scholar]
- 13.Tritschler S, Theis FJ, Lickert H, Böttcher A. Systematic single-cell analysis provides new insights into heterogeneity and plasticity of the pancreas. Mol Metab. 2017;6(9):974–990. doi: 10.1016/j.molmet.2017.06.021. [DOI] [PMC free article] [PubMed] [Google Scholar]
- 14.Camunas-Soler J, Dai XQ, Hang Y, et al. Patch-Seq links single-cell transcriptomes to human islet dysfunction in diabetes. Cell Metab. 2020;31(5):1017–1031. doi: 10.1016/j.cmet.2020.04.005. [DOI] [PMC free article] [PubMed] [Google Scholar]
- 15.Wang Y, Schug J, Lin J, Wang Z, Kossenkov A, Kaestner K (2019) Comparative analysis of commercially available single-cell RNA sequencing platforms for their performance in complex human tissues. bioRxiv 541433. 10.1101/541433
- 16.McCarthy DJ, Campbell KR, Lun ATL, Wills QF. Scater: pre-processing, quality control, normalization and visualization of single-cell RNA-seq data in R. Bioinformatics. 2017;33(8):1179–1186. doi: 10.1093/bioinformatics/btw777. [DOI] [PMC free article] [PubMed] [Google Scholar]
- 17.Butler A, Hoffman P, Smibert P, Papalexi E, Satija R. Integrating single-cell transcriptomic data across different conditions, technologies, and species. Nat Biotechnol. 2018;36(5):411–420. doi: 10.1038/nbt.4096. [DOI] [PMC free article] [PubMed] [Google Scholar]
- 18.Bergen V, Lange M, Peidli S, Wolf FA, Theis FJ. Generalizing RNA velocity to transient cell states through dynamical modeling. Nat Biotechnol. 2020;38(12):1408–1414. doi: 10.1038/s41587-020-0591-3. [DOI] [PubMed] [Google Scholar]
- 19.Dang D, Taheri S, Das S, Ghosh P, Prince LS, Sahoo D. Computational approach to identifying universal macrophage biomarkers. Front Physiol. 2020;11(April):1–14. doi: 10.3389/fphys.2020.00275. [DOI] [PMC free article] [PubMed] [Google Scholar]
- 20.Bateman A. UniProt: a worldwide hub of protein knowledge. Nucleic Acids Res. 2019;47(D1):D506–D515. doi: 10.1093/nar/gky1049. [DOI] [PMC free article] [PubMed] [Google Scholar]
- 21.Bensellam M, Shi YC, Chan JY, et al. Metallothionein 1 negatively regulates glucose-stimulated insulin secretion and is differentially expressed in conditions of beta cell compensation and failure in mice and humans. Diabetologia. 2019;62(12):2273–2286. doi: 10.1007/s00125-019-05008-3. [DOI] [PubMed] [Google Scholar]
- 22.Augsornworawat P, Maxwell KG, Velazco-Cruz L, Millman JR. Single-cell transcriptome profiling reveals β cell maturation in stem cell-derived islets after transplantation. Cell Rep. 2020;32(8):108067. doi: 10.1016/j.celrep.2020.108067. [DOI] [PMC free article] [PubMed] [Google Scholar]
- 23.Westwell-Roper C, Dai DL, Soukhatcheva G, et al. IL-1 blockade attenuates islet amyloid polypeptide-induced proinflammatory cytokine release and pancreatic islet graft dysfunction. J Immunol. 2011;187(5):2755–2765. doi: 10.4049/jimmunol.1002854. [DOI] [PubMed] [Google Scholar]
- 24.Rodnoi P, Rajkumar M, Moin ASM, Georgia SK, Butler AE, Dhawan S. Neuropeptide Y expression marks partially differentiated β cells in mice and humans. JCI insight. 2017;2(12):e94005. doi: 10.1172/jci.insight.94005. [DOI] [PMC free article] [PubMed] [Google Scholar]
- 25.Medini H, Cohen T, Mishmar D. Mitochondrial gene expression in single cells shape pancreatic beta cells’ sub-populations and explain variation in insulin pathway. Sci Rep. 2021;11(1):1–13. doi: 10.1038/s41598-020-80334-w. [DOI] [PMC free article] [PubMed] [Google Scholar]
- 26.van der Meulen T, Mawla AM, DiGruccio MR, et al. Virgin beta cells persist throughout life at a neogenic niche within pancreatic islets. Cell Metab. 2017;25(4):911–926. doi: 10.1016/j.cmet.2017.03.017. [DOI] [PMC free article] [PubMed] [Google Scholar]
- 27.Li T, Xie J, Shen C, et al. Amplification of long noncoding RNA ZFAS1 promotes metastasis in hepatocellular carcinoma. Cancer Res. 2015;75(15):3181–3191. doi: 10.1158/0008-5472.CAN-14-3721. [DOI] [PubMed] [Google Scholar]
- 28.Denwood G, Tarasov A, Salehi A, et al. Glucose stimulates somatostatin secretion in pancreatic δ-cells by cAMP-dependent intracellular Ca2+ release. J Gen Physiol. 2018;151(9):1094–1115. doi: 10.1085/JGP.201912351. [DOI] [PMC free article] [PubMed] [Google Scholar]
- 29.Maxwell MA, Muscat GEO. The NR4A subgroup: immediate early response genes with pleiotropic physiological roles. Nucl Recept Signal. 2006;4(1):nrs.04002. doi: 10.1621/nrs.04002. [DOI] [PMC free article] [PubMed] [Google Scholar]
- 30.Sabatini PV, Krentz NAJ, Zarrouki B, et al. Npas4 is a novel activity-regulated cytoprotective factor in pancreatic β-cells. Diabetes. 2013;62(8):2808–2820. doi: 10.2337/db12-1527. [DOI] [PMC free article] [PubMed] [Google Scholar]
- 31.Sabatini PV, Speckmann T, Nian C, et al. Neuronal PAS domain protein 4 suppression of oxygen sensing optimizes metabolism during excitation of neuroendocrine cells. Cell Rep. 2018;22(1):163–174. doi: 10.1016/j.celrep.2017.12.033. [DOI] [PubMed] [Google Scholar]
- 32.Aguayo-Mazzucato C, Andle J, Lee TB, et al. Acceleration of β cell aging determines diabetes and Senolysis improves disease outcomes. Cell Metab. 2019;30(1):129–142. doi: 10.1016/j.cmet.2019.05.006. [DOI] [PMC free article] [PubMed] [Google Scholar]
- 33.Li N, Liu F, Yang P, et al. Aging and stress induced β cell senescence and its implication in diabetes development. Aging. 2019;11(21):9947–9959. doi: 10.18632/aging.102432. [DOI] [PMC free article] [PubMed] [Google Scholar]
- 34.Helman A, Klochendler A, Azazmeh N, et al. p16Ink4a-induced senescence of pancreatic beta cells enhances insulin secretion. Nat Metab. 2016;22(4):412–420. doi: 10.1038/nm.4054. [DOI] [PMC free article] [PubMed] [Google Scholar]
- 35.Pullen TJ, Khan AM, Barton G, Butcher SA, Sun G, Rutter GA. Identification of genes selectively disallowed in the pancreatic islet. Islets. 2010;2(2):89–95. doi: 10.4161/isl.2.2.11025. [DOI] [PubMed] [Google Scholar]
- 36.Ghazvini Zadeh EH, Huang ZJ, Xia J, Li D, Davidson HW, Li W. ZIGIR, a granule-specific Zn2+ indicator, reveals human islet α cell heterogeneity. Cell Rep. 2020;32(2):107904. doi: 10.1016/j.celrep.2020.107904. [DOI] [PMC free article] [PubMed] [Google Scholar]
- 37.Dorrell C, Schug J, Canaday PS, et al. Human islets contain four distinct subtypes of β cells. Nat Commun. 2016;7:1–9. doi: 10.1038/ncomms11756. [DOI] [PMC free article] [PubMed] [Google Scholar]
- 38.Johnston NR, Mitchell RK, Haythorne E, et al. Beta cell hubs dictate pancreatic islet responses to glucose. Cell Metab. 2016;24(3):389–401. doi: 10.1016/j.cmet.2016.06.020. [DOI] [PMC free article] [PubMed] [Google Scholar]
- 39.Zheng L, Suzuki H, Nakajo Y, Nakano A, Kato M. Regulation of c-MYC transcriptional activity by transforming growth factor-beta 1-stimulated clone 22. Cancer Sci. 2018;109(2):395–402. doi: 10.1111/cas.13466. [DOI] [PMC free article] [PubMed] [Google Scholar]
- 40.Dirice E, Walpita D, Vetere A, et al. Inhibition of DYRK1A stimulates human β-cell proliferation. Diabetes. 2016;65(6):1660–1671. doi: 10.2337/db15-1127. [DOI] [PMC free article] [PubMed] [Google Scholar]
- 41.Olsen HL, Theander S, Bokvist K, Buschard K, Wollheim CB, Gromada J. Glucose stimulates glucagon release in single rat α-cells by mechanisms that mirror the stimulus-secretion coupling in β-cells. Endocrinology. 2005;146(11):4861–4870. doi: 10.1210/en.2005-0800. [DOI] [PubMed] [Google Scholar]
- 42.Franklin I, Gromada J, Gjinovci A, Theander S, Wollheim CB. Glucagon release. Diabetes. 2005;54(June):808–1815. doi: 10.2337/diabetes.54.6.1808. [DOI] [PubMed] [Google Scholar]
- 43.MacDonald PE, De Marinis YZ, Ramracheya R, et al. A KATP channel-dependent pathway within α cells regulates glucagon release from both rodent and human islets of Langerhans. PLoS Biol. 2007;5(6):1236–1247. doi: 10.1371/journal.pbio.0050143. [DOI] [PMC free article] [PubMed] [Google Scholar]
- 44.Dickerson XMT, Dadi PK, Altman MK, et al. Glucose-mediated inhibition of calcium-activated potassium channels limits α-cell calcium influx and glucagon secretion. Am J Physiol Endocrinol Metab. 2019;316(4):E646–E659. doi: 10.1152/ajpendo.00342.2018. [DOI] [PMC free article] [PubMed] [Google Scholar]
- 45.Lai BK, Chae H, Gómez-Ruiz A, et al. Somatostatin is only partly required for the glucagonostatic effect of glucose but is necessary for the glucagonostatic effect of KATP channel blockers. Diabetes. 2018;67(11):2239–2253. doi: 10.2337/db17-0880. [DOI] [PubMed] [Google Scholar]
- 46.Li J, Klughammer J, Farlik M, et al. Single-cell transcriptomes reveal characteristic features of human pancreatic islet cell types. EMBO Rep. 2016;17(2):178–187. doi: 10.15252/embr.201540946. [DOI] [PMC free article] [PubMed] [Google Scholar]
- 47.Lawlor N, George J, Bolisetty M, et al. Single-cell transcriptomes identify human islet cell signatures and reveal cell-type-specific expression changes in type 2 diabetes. Genome Res. 2017;27(2):208–222. doi: 10.1101/gr.212720.116. [DOI] [PMC free article] [PubMed] [Google Scholar]
- 48.Teo AKK, Lim CS, Cheow LF, et al. Single-cell analyses of human islet cells reveal de-differentiation signatures. Cell Death Discov. 2018;4(1):1–11. doi: 10.1038/s41420-017-0014-5. [DOI] [PMC free article] [PubMed] [Google Scholar]
- 49.Thompson PJ, Shah A, Ntranos V, Van Gool F, Atkinson M, Bhushan A. Targeted elimination of senescent beta cells prevents type 1 diabetes. Cell Metab. 2019;29(5):1045–1060. doi: 10.1016/j.cmet.2019.01.021. [DOI] [PubMed] [Google Scholar]
Associated Data
This section collects any data citations, data availability statements, or supplementary materials included in this article.
Supplementary Materials
(PDF 6.64 mb)
(XLSX 399 kb)
Data Availability Statement
A searchable and user-friendly format of the data in this study, specifically designed for rapid mining of single-cell RNA sequencing data, is available at https://lynnlab.shinyapps.io/Human_Islet_Atlas/. The raw data files are available at NCBI Gene Expression Omnibus (GSE196715).
All data needed to evaluate the conclusions in the paper are present in the paper and/or the ESM. Requests for resources and further information should be directed to the lead contact, Francis C. Lynn (francis.lynn@ubc.ca). Sequencing data are available at NCBI Gene Expression Omnibus (GSE196715). A searchable and user-friendly format of the data in this study is available at https://lynnlab.shinyapps.io/Human_Islet_Atlas/.


