

Abstract
Background
Consolidation tumor ratio (CTR) is associated with cancer progression and histological invasiveness in lung adenocarcinoma (LAD). However, little is known about the association between CTR and immune‐related factors, including tumor‐infiltrating lymphocytes (TILs) density or tumor expression of programmed death ligand 1 (PD‐L1) and indoleamine 2,3‐dioxygenase 1 (IDO1) in small‐sized LAD.
Methods
This study included 258 patients with LAD (<3 cm) who underwent surgery. Patients were assigned to four groups: CTR = 0; 0 < CTR <0.5; 0.5 ≤ CTR <1 (ground‐glass opacity [GGO] group); and CTR = 1 (pure‐solid group). CD4+, CD8+, and FoxP3+ TIL density and PD‐L1 and IDO1 tumor expression were assessed by immunohistochemistry.
Results
Among the GGO group, CD8+ and FoxP3+ TIL density increased significantly with increasing CTR (p < 0.001 and p < 0.001, respectively). Moreover, PD‐L1 and IDO1 expression was significantly higher in the pure‐solid group than in the GGO group (p < 0.001 and p < 0.001, respectively).
Conclusions
CTR was correlated with the abundance of CD8+ and FoxP3+ TILs in the GGO group. PD‐L1 and IDO1 positivity rates were significantly higher in the pure‐solid group than in the GGO group. Increased CTR may be correlated with immunosuppressive condition.
Keywords: IDO1, lung adenocarcinoma, PD‐L1, surgery, tumor‐infiltrating lymphocytes
High CTR was correlated with the abundance of CD8+ and FoxP3+ TILs in the GGO group. PD‐L1 and IDO1 expression were significantly higher in the pure‐solid group than in the GGO group. Small‐sized LAD with high CTR might be in a more immunosuppressive state than that with low CTR in small‐sized LAD.
INTRODUCTION
Lung adenocarcinoma (LAD) is the most common histological type among patients with non‐small cell lung cancer. 1 Widespread screening using low‐dose helical computed tomography (CT) has led to a higher early detection rate of small‐sized lung cancers. 2 The consolidation tumor ratio (CTR), which is an imaging feature of small‐sized LAD, is the ratio of solid tumor diameter to total tumor diameter. LAD patients with ground‐glass opacities (GGO) have been reported to have a good prognosis, and the pathological features of most cases indicated minimal invasion. 3 , 4 CTR is an established radiological parameter for identifying pathological non‐ or invasive tumors on CT images. 4 , 5
Programmed death ligand 1 (PD‐L1) is an immune checkpoint molecule expressed on tumor cells and suppresses the immune response to tumor cells by binding to programmed death 1 expressed on the surface of T cells. 6 Additionally, indoleamine 2,3‐dioxygenase 1 (IDO1) metabolizes tryptophan to kynurenine, and tryptophan deficiency suppresses T cell proliferation and induces regulatory T cell differentiation. 7 , 8 Therefore, PD‐L1 and IDO1 are important factors that suppress antitumor immune responses. We previously reported that high expression of PD‐L1 or IDO1 was correlated with poor prognosis in LAD. 9 , 10 A recent clinical study demonstrated that PD‐L1 inhibitors, which are approved as a standard treatment for advanced lung cancer with high PD‐L1 expression, significantly improved prognosis. 11
Tumor‐infiltrating lymphocytes (TILs) play a major role in the tumor immune response, and there are multiple phenotypes of TILs. CD4 is a surface antigen expressed on helper T cells that receive antigen presentation. 12 While CD8+ TILs have a cytotoxic function, regulatory T cells expressing FoxP3 suppress the immune response. 13 , 14 Our previous study demonstrated that a low ratio of CD8+ TILs and FoxP3+ TILs is an independent poor prognostic factor of disease‐free survival in stage IA LAD. 15
A retrospective study has examined the relevance between CTR and prognosis or pathological characteristics in early lung cancer; however, the detailed analysis between CTR and the TILs or immunosuppressive factors has not been performed. 16 In this study, we examined the relationship between CTR and TILs and the expression of PD‐L1 and IDO1.
METHODS
Patients
This retrospective study was reviewed and approved by the institutional review board of Kyushu University (approval no. 2019–232). The study included 365 patients with clinical stage 0/I LAD and a tumor diameter <3 cm who underwent surgical resection at the Department of Surgery and Science, Graduate School of Medical Sciences, Kyushu University, between January 2003 and December 2016. We excluded 107 patients because of insufficient tumor tissue or missing data, incomplete resection, or receipt of neoadjuvant therapy, and a total of 258 patients was enrolled. Clinical stage was defined by the T (tumor), N (node), and M (metastasis) classification of the International Association for the Study of Lung Cancer guidelines (8th edition). 17 The clinicopathological features analyzed were age at surgical resection, sex, smoking history, radiological whole tumor size, radiological solid component size, CTR, surgical procedure, pleural invasion, lymphatic invasion, vascular invasion, histological subtype, epidermal growth factor receptor (EGFR) and anaplastic lymphoma kinase (ALK). The EGFR status was examined in resected specimens with the peptide nucleic acid‐locked nucleic acid polymerase chain reaction clamp method 18 ; and ALK gene rearrangement was tested by fluorescence in situ hybridization. Genetic alterations of EGFR or ALK were available in 167 patients. Clinical data were obtained from patient records.
Calculation of CTR
All patients underwent CT imaging in the supine position during inspiratory breath‐hold using various multidetector row scanners (Aquilion 4, Aquilion 64, Aquilion ONE, Aquilion ONE Vision [Toshiba], SOMATOM Plus4 Volume Zoom [Siemens Medical Solutions, Malvern], Brilliance CT, and Brilliance iCT [Philips Healthcare]).
The diameter of consolidation in each tumor and the diameter of the whole tumor, including GGO, were measured with axial two‐dimensional CT data at 2‐mm slice thicknesses, and the CTR was calculated. The CT images were evaluated by three of the authors (Y.O., K.T., and T.K.). When independent assessments disagreed, the images were viewed and discussed together to reach a final consensus. Patients were assigned to four groups of CTR = 0; 0 < CTR < 0.5; 0.5 ≤ CTR < 1; and CTR = 1. Additionally, tumors without GGO component were defined as the pure‐solid group (CTR = 1) and the other tumors with GGO were defined as the GGO group (0 ≤ CTR < 1).
Immunohistochemical staining
Immunohistochemistry was performed for 258 LAD using formalin‐fixed tissue sections. The detailed method has been described in previous reports (primary monoclonal antibodies: antihuman CD4 [1:100; ab213215, Abcam], antihuman CD8 [1:100; C8/144B; Dako], antihuman FoxP3 [1:100; 236A/E7; eBiosciences], antihuman PD‐L1 [1:100; SP142; Spring Bioscience], and antihuman IDO1 [1:200; UMAB126; Origene Technologies). 9 , 10 , 15 , 19
We selected hot spots within 0.04 mm2 areas in five fields per section and counted the numbers of CD4+, CD8+, and FoxP3+ TILs; the results are presented as the average densities. As reported previously, PD‐L1 and IDO1 expression on tumor cells was evaluated and the cutoff value for positivity was set at 1% of tumor cells. 9 , 10 Staining was evaluated by at least two investigators, one of whom was a pathologist.
Statistical analysis
Associations between CTR and clinicopathological factors were analyzed using Wilcoxon's rank sum test and Fisher's exact test; associations between CTR and TILs in the GGO group were analyzed by regression analysis, and differences in TILs between the GGO and the pure‐solid groups were analyzed by Student's t‐test. A Cochran–Armitage test was applied to investigate trends in PD‐L1 and IDO1 positivity among the GGO group.
Comparisons of PD‐L1 and IDO1 positivity between the GGO and pure‐solid groups were performed using Fisher's exact test. All statistical analyses were performed with JMP Statistical Discovery software (version 14.0; SAS Institute), and a p‐value <0.05 was regarded as statistically significant.
RESULTS
Clinicopathological characteristics of patients with small‐sized LAD
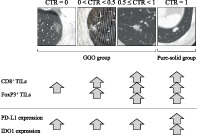
The clinicopathological characteristics of the study cohort of 258 patients with clinical stage 0/I LAD (<3 cm) are shown in Table 1. The CTR = 0, 0 < CTR <0.5, 0.5 ≤ CTR < 1, and CTR = 1 groups consisted of 31 (12.0%), 57 (22.1%), 59 (22.9%), and 111 (43.0%) patients, respectively. The mean density (cells/0.04 mm2) of CD4+, CD8+, and FoxP3+ TILs was 38.6 (range, 0–104.6), 41.5 (range, 0–114.2), and 12.8 (range, 0–49.4), respectively. PD‐L1 and IDO1 expression was positive (≥1% of cells) in tumors from 69 (26.7%) and 142 (55.0%) patients, respectively. A total of 235 patients (91.1%) had pathological N0. Figure 1 shows representative CT images and each immunohistochemistry images according to CTR (Figure 1a–d).
TABLE 1.
Clinicopathological characteristics of patients with small‐sized LAD
| Characteristics | Number of patients (n = 258) |
|---|---|
| Age (mean), years | 69 (29–85) |
| Sex | |
| Female | 136 (52.7%) |
| Male | 122 (47.3%) |
| Smoking history | |
| Never smoker | 132 (51.2%) |
| Smoker | 126 (48.8%) |
| CTR | |
| CTR = 0 | 31 (12.0%) |
| 0 < CTR < 0.5 | 57 (22.1%) |
| 0.5 ≤ CTR < 1 | 59 (22.9%) |
| CTR = 1 | 111 (43.0%) |
| Clinical T status | |
| Tis | 31 (12.0%) |
| T1mi | 27 (10.5%) |
| T1a | 52 (20.1%) |
| T1b | 90 (34.9%) |
| T1c | 58 (22.5%) |
| Surgical procedure | |
| Sublobar resection | 90 (34.8%) |
| Lobectomy | 168 (65.2%) |
| Pleural invasion | |
| Positive | 32 (12.4%) |
| Negative | 226 (87.6%) |
| Vascular invasion | |
| Positive | 45 (17.4%) |
| Negative | 213 (82.6%) |
| Lymphatic invasion | |
| Positive | 20 (7.8%) |
| Negative | 238 (92.2%) |
| Histological subtype | |
| AIS/MIS/lepidic | 73 (28.3%) |
| Others | 185 (71.7%) |
| TILs (mean), cells/0.04 mm2 | |
| CD4+ TILs | 38.6 (0–104.6) |
| CD8+ TILs | 41.5 (0–114.2) |
| FoxP3+ TILs | 12.8 (0–49.4) |
| PD‐L1 expression | |
| Positive (≥1%) | 69 (26.7%) |
| Negative (<1%) | 189 (73.3%) |
| IDO1 expression | |
| Positive (≥1%) | 142 (55.0%) |
| Negative (<1%) | 116 (45.0%) |
| Pathological nodal status | |
| N0 | 235 (91.1%) |
| N1–2 | 23 (8.9%) |
| Driver oncogene | |
| Absent | 83 (32.2%) |
| Present | 84 (32.5%) |
| Unknown | 91 (35.3%) |
Abbreviations: AIS, adenocarcinoma in situ; CD, cluster of differentiation; CTR, consolidation tumor ratio; FoxP3, forkhead box protein P3; IDO1, indoleamine 2,3‐dioxygenase 1; LAD, lung adenocarcinoma; MIA, minimally invasive adenocarcinoma; PD‐L1, programmed cell death ligand 1; TILs, tumor‐infiltrating lymphocytes.
FIGURE 1.

Representative images of computed tomography scans, H&E staining, and immunohistochemical staining of immune markers in resected lung adenocarcinoma specimens. (a–d) Specimens with consolidation tumor ratio (CTR) of 0 (a), 0.12 (b), 0.92 (c), and 1 (d). Scale bar: 100 μm
Associations between clinicopathological characteristics and CTR
The associations between clinicopathological features and CTR are shown in Table 2. Clinical T factor increased in parallel with increasing CTR (p < 0.001, Wilcoxon rank sum test), and increased CTR was significantly associated with cancer progression. The proportion of patients with pleural, vascular, and lymphatic invasion also increased in parallel with increasing CTR (all p < 0.001; Fisher's exact test). The ratio of nonlepidic pattern to lepidic pattern histological subtype was significantly higher in patients with high CTR (p < 0.001).
TABLE 2.
Association between CTR and clinicopathological features
| Characteristics | n | CTR = 0 (n = 31) | 0 < CTR < 0.5 (n = 57) | 0.5 ≤ CTR < 1.0 (n = 59) | CTR = 1 (n = 111) | p‐value |
|---|---|---|---|---|---|---|
| Age | ||||||
| <69 | 126 | 13 (41.9%) | 29 (50.9%) | 23 (39.0%) | 61 (55.0%) | 0.199* |
| ≥69 | 132 | 18 (58.1%) | 28 (49.1%) | 36 (61.0%) | 50 (45.0%) | |
| Sex | ||||||
| Female | 136 | 18 (58.1%) | 37 (64.9%) | 33 (55.9%) | 48 (43.2%) | 0.045* |
| Male | 122 | 13 (41.9%) | 20 (35.1%) | 26 (44.1%) | 63 (56.8%) | |
| Smoking history | ||||||
| Never smoker | 132 | 19 (61.3%) | 34 (59.7%) | 33 (55.9%) | 46 (41.4%) | 0.053* |
| Smoker | 126 | 12 (38.7%) | 23 (40.3%) | 26 (44.1%) | 65 (58.6%) | |
| Clinical T status | ||||||
| Tis | 31 | 31 (100%) | 0 (0%) | 0 (0%) | 0 (0%) | <0.001** |
| T1mi | 27 | 0 (0%) | 24 (42.1%) | 2 (3.4%) | 1 (0.9%) | |
| T1a | 52 | 0 (0%) | 27 (47.4%) | 17 (28.8%) | 8 (7.2%) | |
| T1b | 90 | 0 (0%) | 6 (10.5%) | 35 (59.3%) | 49 (44.1%) | |
| T1c | 58 | 0 (0%) | 0 (0%) | 5 (8.5%) | 53 (47.8%) | |
| Surgical procedure | ||||||
| Sublober resection | 90 | 19 (61.3%) | 25 (43.9%) | 19 (32.2%) | 27 (24.3%) | <0.001* |
| Lobectomy | 168 | 12 (38.7%) | 32 (56.1%) | 40 (67.8%) | 84 (75.7%) | |
| Pleural invasion | ||||||
| Negative | 226 | 30 (96.8%) | 56 (98.3%) | 56 (94.9%) | 84 (75.7%) | <0.001* |
| Positive | 32 | 1 (3.2%) | 1 (1.7%) | 3 (5.1%) | 27 (24.3%) | |
| Vascular invasion | ||||||
| Negative | 213 | 31 (100%) | 54 (94.7%) | 53 (89.8%) | 75 (67.6%) | <0.001* |
| Positive | 45 | 0 (0%) | 3 (5.3%) | 6 (10.2%) | 36 (32.4%) | |
| Lymphatic invasion | ||||||
| Negative | 238 | 31 (100%) | 56 (98.3%) | 58 (98.3%) | 93 (83.8%) | <0.001* |
| Positive | 20 | 0 (0%) | 1 (1.7%) | 1 (1.7%) | 18 (16.2%) | |
| Histological subtype | ||||||
| AIS/MIA/lepidic | 73 | 30 (96.8%) | 33 (58.9%) | 10 (16.9%) | 0 (0%) | <0.001* |
| Others | 185 | 1 (3.2%) | 24 (41.1%) | 49 (83.1%) | 111 (100%) | |
| Pathological nodal status | ||||||
| N0 | 235 | 31 (100%) | 56 (98.3%) | 56 (94.9%) | 92 (82.9%) | <0.001* |
| N1–2 | 23 | 0 (0%) | 1 (1.7%) | 3 (5.1%) | 19 (17.1%) | |
Abbreviations: AIS, adenocarcinoma in situ; CTR, consolidation tumor ratio; MIA, minimally invasive adenocarcinoma.
p‐value was estimated by Fisher's exact test.
p‐value was estimated by Wilcoxon rank sum test.
Associations between CTR and the abundance of TILs
We next analyzed the associations between CTR and the density of TIL. In the CTR = 0, 0 < CTR <0.5, 0.5 ≤ CTR < 1, and CTR = 1 groups, the mean (± standard deviation) density of CD4+ TILs was 41.3 ± 4.2, 43.0 ± 3.1, 40.3 ± 3.1, and 34.7 ± 2.2 per 0.04 mm2, respectively (Figure 2a), while the mean density of CD8+ TILs was 28.7 ± 4.8, 38.7 ± 3.6, 49.1 ± 3.5, and 42.5 ± 2.6 per 0.04 mm2, respectively (Figure 2b), and the mean density of FoxP3+ TILs was 6.3 ± 1.8, 9.6 ± 1.3, 17.1 ± 1.3, and 14.0 ± 0.9 per 0.04 mm2, respectively (Figure 2c).
FIGURE 2.

Correlations between consolidation tumor ratio (CTR) and tumor‐infiltrating lymphocytes (TILs) in lung adenocarcinoma specimens. (a) CD4+ TILs, (b) CD8+ TILs, (c) FoxP3+ TILs according to CTR. Data are presented as the mean (horizontal line in green diamond) and confidence interval (upper and lower points of green diamonds), with individual samples shown as solid black circles. N = 31, 57, 59, and 111, for CTR = 0, 0 < CTR < 0.5, 0.5 ≤ CTR < 1, and CTR = 1, respectively. p = 0.776, p < 0.001 and p < 0.001 for ground‐glass opacity tumors trends in (a), (b), and (c), respectively
To determine whether the densities of TILs were significantly associated with CTR in the GGO group, we performed regression analysis of the cell densities of each TIL type in the CTR = 0, 0 < CTR < 0.5, and 0.5 ≤ CTR < 1 groups. We found that CTR was not significantly associated with the density of CD4+ TILs (p = 0.776; Figure 2a); however, it was significantly positively associated with the densities of both CD8+ and FoxP3+ TILs (p < 0.001 and p < 0.001, respectively; Figure 2b,c).
In contrast, when comparing TILs between the GGO and pure‐solid groups, we observed the opposite trend. Thus, the CD4+ TIL density was significantly lower in the pure‐solid group than in the GGO group (p = 0.022; Figure S1a), whereas the density of CD8+ and FoxP3+ TILs was comparable between the GGO and pure‐solid groups (p = 0.618 and p = 0.116, respectively; Figure S1b,c).
Associations between CTR and PD‐L1 and IDO1 positivity
Next, we determined whether CTR was positively associated with the rate of PD‐L1 and IDO1 tumor expression. The positivity rates of PD‐L1 in tumors in the CTR = 0, 0 < CTR <0.5, 0.5 ≤ CTR < 1, and CTR = 1 groups were 12.9% (4/31), 15.8% (9/57), 16.9% (10/59), and 41.4% (46/111), respectively (Figure 3a), and the positivity rates of IDO1 were 38.7% (12/31), 36.8% (21/57), 50.9% (30/59), and 71.2% (79/111), respectively (Figure 3c). To determine whether a significant trend existed in the tumor expression of PD‐L1 or IDO1 between the GGO groups, we performed a Cochran–Armitage trend test. However, this analysis revealed no significant trend in either PD‐L1 or IDO1 positivity between the CTR = 0, 0 < CTR < 0.5, and 0.5 ≤ CTR < 1 groups (p = 0.628 and p = 0.188, respectively; Figure S2a,b).
FIGURE 3.

Correlation between positivity rates for programmed death ligand 1 (PD‐L1) (a and b) and indoleamine 2,3‐dioxygenase 1 (IDO1) (c and d) in ground‐glass opacity (GGO) tumors compared with pure‐solid tumors. p < 0.001 and p < 0.001 for PD‐L1 (b) and IDO1 (d), respectively
When PD‐L1 and IDO1 positivity was compared between the pure‐solid and the GGO groups, using Fisher's exact test we detected significantly higher PD‐L1 and IDO1 positivity in the pure‐solid group than in the GGO group (p < 0.001 and p < 0.001, respectively (Figure 3b,d).
Associations between driver oncogene and TILs and immunosuppressive molecules
We performed an exploratory analysis of the relationship between driver oncogenes including EGFR and ALK, and TILs and immunosuppressive molecules. Driver oncogene information was available in 167 patients (Figure S3). Of these, 84 patients had some driver oncogenes, all of which were EGFR. The group with driver oncogenes had significantly lower CTR than those without (p = 0.004); however, it was not associated with the abundance of CD4+, CD8+, and FoxP3+ TILs, and the expression of PD‐L1 and IDO1 (p = 0.187, p = 0.737, p = 0.125, p = 0.108, p = 0.438, respectively).
DISCUSSION
The present study evaluated the associations between the CTR of small‐sized LAD and immune‐related factors, including CD4+, CD8+, and FoxP3+ TIL abundance, and PD‐L1 and IDO1 positivity. Our study revealed several findings of significant positive associations between the CTR and the density of CD8+ and FoxP3+ TILs among the GGO group, and significantly higher PD‐L1 and IDO1 positivity in the pure‐solid group compared with the GGO group. Our study implies that increased CTR might be correlated with immunosuppressive condition in antitumor immune response.
The current study showed that the density of CD8+ and FoxP3+ TILs was significantly higher in high CTR tumors than that in low CTR tumors among GGO tumors. These results may reflect the transition of the antitumor immune response as the tumor grows. LAD without solid component, which pathologically corresponds to adenocarcinoma in situ (AIS), 20 exhibits a low antitumor immune response. 21 As tumor grows, the antitumor immune response is triggered, and cytotoxic cells including CD8+ lymphocytes infiltrate into tumors. However, immunosuppressive cells including Foxp3+ lymphocytes also infiltrate into tumors as the tumor grows, which may cause an immunosuppressive state. 22 The gradual increases in the density of CD8+ and FoxP3+ TILs paralleling the CTR may be related to tumor growth.
In the present study, the positive rate of PD‐L1 and IDO1 expression was significantly higher in the pure‐solid group than in the GGO group (Figure 3), which was similar to a previous study. 16 Moreover, pure‐solid group has been pathologically more invasive than GGO group (Table S1). In several studies, the survival of LAD without the GGO component has been reported to be worse than those with the GGO component. Additionally, PD‐L1 and IDO1 on tumor cells was reported to be poor prognostic factors in several types of cancer, including LAD. 10 , 23 , 24 Our results suggest that these immunosuppressive factors might have been correlated with the poor prognosis of pure‐solid LAD.
The differences of two types of LADs with or without GGO component are well known regarding to survival, pathological aggressiveness and the frequency of gene alterations. Our present and previous study demonstrated that pure‐solid LAD was more pathological invasive and was associated with poor clinical outcome. 25 Moreover, a previous report revealed that the frequency of an epidermal growth factor receptor (EGFR) mutation in early‐stage pure‐solid LAD was significantly low than LAD with GGO component. 26 In our result, there were no significant differences in the abundance of CD8+ and FoxP3+ TILs between the pure‐solid and the GGO groups (Figure S1), although CD8+ and FoxP3+ TILs increased significantly with increasing CTR among the GGO group. However, as previously described, the expression of both PD‐L1 and IDO1 was significantly higher in the pure‐solid group than in the GGO group (Figure 3); on the other hand, the expression of PD‐L1 and IDO1 was statistically comparable among the GGO group (Figure S2). These findings might be associated with the differences in the biological characteristics between LAD with and without GGO component. Our exploratory analysis showed that TILs and the immunosuppressive molecules were comparable between the tumors with and without driver oncogene, although driver oncogene was associated with CTR (Figure S3). A previous study revealed that advanced LADs with EGFR wild‐type had more CD8+ TILs and higher PD‐L1 expression than those with EGFR mutation. 27 A few reports have shown the association between diver oncogenes and TILs in small‐sized LAD. 27 Further analyses of larger numbers of patients are needed to clarify the association between CTR and immune condition in small‐sized LAD.
The role of CD4+ TILs in the tumor micro environment was not evaluated in this study. TILs expressing CD4 are classified into some types of lymphocytes, such as T helper‐1 (Th1), Th2, Th17, and regulatory T cells. CD4+ Th1 produces interferon‐γ, which has a cytotoxic function to tumor cells; on the other hand, CD4+ Th17 secretes interleukin‐4, interleukin‐10, and interleukin‐13, which assists in tumor progression. 28 To further research, the correlation between CD4+ TILs and CTR in small‐sized LAD, cytokines and the surface antigen of CD4+ TILs needs to be assessed.
There were several limitations to this study. First, this was a retrospective analysis performed at a single institution. Validation cohort studies should be conducted for the same analysis. Second, there is no definitive assessment method for quantifying TILs in lung cancer. 29 Furthermore, the score of TILs may fluctuate in the evaluation of randomly selected areas in the entire tumor; however, the method of selecting the hot spots is considered to have a small variation in the score. Although several limitations exist, we report important findings that are necessary for understanding tumor progression and the accompanying changes.
In conclusion, high CTR in small‐sized LAD was positively correlated with the abundance of CD8+ and FoxP3+ TILs, and PD‐L1 and IDO1 positivity rates were significantly higher in the pure‐solid group than in the GGO group. These features suggest that small‐sized LAD with high CTR might be in a more immunosuppressive state than that with low CTR in small‐sized LAD.
CONFLICT OF INTEREST
All authors declare no conflicts of interest associated with this research.
Supporting information
Figure S1 Comparison of the density of tumor‐infiltrating lymphocytes (TILs) in GGO tumors and pure‐solid tumors. Diamond plots of the density of (a) CD4+ TILs, (b) CD8+ TILs, and (c) FoxP3+ TILs. Data are presented as the mean of TILs in GGO (n = 147) and pure‐solid (n = 111) tumors, with individual samples shown as solid circles. p = 0.022, p = 0.618, and p = 0.116 for (a), (b), and (c), respectively
Figure S2. Correlation between consolidation tumor ratio (CTR) and rate of programmed death ligand 1 (PD‐L1) (a) and indoleamine 2,3‐dioxygenase 1 (IDO1) (b) expression. Data are presented as the rate of PD‐L1‐ or IDO1‐positive expression in CTR = 0 (n = 31), <CTR < 0.5 (n = 57), and 0.5 ≤ CTR <1 (n = 59) tumor groups. No significant trend was detected for either PD‐L1 (p = 0.628) or IDO1 (p = 0.188)
Figure S3 Comparison of consideration tumor ratio (CTR) (a), the density of tumor‐infiltrating lymphocytes (TILs) (b, c, d) and rate of programmed death ligand 1 (PD‐L1) (e) and indoleamine 2,3‐dioxygenase 1 (IDO1) (f) expression according driver oncogene. There was no significant difference in CD4+, CD8+ and FoxP3+ TILs, PD‐L1 and IDO1 (p = 0.187, p = 0.737, p = 0.125, p = 0.108, p = 0.438, respectively), while CTR of the tumors with driver oncogene was significantly lower than without (p = 0.004)
Table S1 Clinicopathological features based on the presence of ground glass opacity (GGO) components
ACKNOWLEDGMENTS
We thank Anne M. O'Rourke, PhD, and H. Nikki March, PhD, from Edanz (https://jp.edanz.com/ac) for editing a draft of this manuscript.
Ono Y, Tagawa T, Kinoshita F, Haratake N, Takada K, Kohno M, et al. Relationship between consolidation tumor ratio and tumor‐infiltrating lymphocytes in small‐sized lung adenocarcinoma. Thorac Cancer. 2022;13(15):2134–2141. 10.1111/1759-7714.14524
REFERENCES
- 1. Molina JR, Yang P, Cassivi SD, Schild SE, Adjei AA. Non‐small cell lung cancer: epidemiology, risk factors, treatment, and survivorship. Mayo Clin Proc. 2008;83(5):584–94. [DOI] [PMC free article] [PubMed] [Google Scholar]
- 2. Aberle DR, Adams AM, Berg CD, Black WC, Clapp JD, Fagerstrom RM, et al. Reduced lung‐cancer mortality with low‐dose computed tomographic screening. N Engl J Med. 2011;365(5):395–409. [DOI] [PMC free article] [PubMed] [Google Scholar]
- 3. Aokage K, Yoshida J, Ishii G, Matsumura Y, Haruki T, Hishida T, et al. Identification of early T1b lung adenocarcinoma based on thin‐section computed tomography findings. J Thorac Oncol. 2013;8(10):1289–94. [DOI] [PubMed] [Google Scholar]
- 4. Hattori A, Matsunaga T, Takamochi K, Oh S, Suzuki K. Importance of ground glass opacity component in clinical stage IA radiologic invasive lung cancer. Ann Thorac Surg [Internet] 2017;104(1):313–20. 10.1016/j.athoracsur.2017.01.076 [DOI] [PubMed] [Google Scholar]
- 5. Eguchi T, Kadota K, Park BJ, Travis WD, Jones DR, Adusumilli PS. The new IASLC‐ATS‐ERS lung adenocarcinoma classification: what the surgeon should know. Semin Thorac Cardiovasc Surg. 2014;26(3):210–22. [DOI] [PMC free article] [PubMed] [Google Scholar]
- 6. Francisco LM, Sage PT, Sharpe AH. The PD‐1 pathway in tolerance and autoimmunity. Immunol Rev. 2010;236(1):219–42. [DOI] [PMC free article] [PubMed] [Google Scholar]
- 7. Fallarino F, Grohmann U, You S, McGrath BC, Cavener DR, Vacca C, et al. The combined effects of tryptophan starvation and tryptophan catabolites Down‐regulate T cell receptor ζ‐chain and induce a regulatory phenotype in naive T cells. J Immunol. 2006;176(11):6752–61. [DOI] [PubMed] [Google Scholar]
- 8. Della Chiesa M, Carlomagno S, Frumento G, Balsamo M, Cantoni C, Conte R, et al. The tryptophan catabolite L‐kynurenine inhibits the surface expression of NKp46‐ and NKG2D‐activating receptors and regulates NK‐cell function. Blood. 2006;108(13):4118–25. [DOI] [PubMed] [Google Scholar]
- 9. Takada K, Okamoto T, Shoji F. Clinical Signi fi cance of PD‐L1 protein expression in surgically resected primary lung adenocarcinoma. J Thorac Oncol [Internet]. 2016;11(11):1879–90. 10.1016/j.jtho.2016.06.006 [DOI] [PubMed] [Google Scholar]
- 10. Kozuma Y, Takada K, Toyokawa G, Kohashi K, Shimokawa M, Hirai F, Tagawa T, Okamoto T, Oda Y, Maehara Y Indoleamine 2,3‐dioxygenase 1 and programmed cell death‐ligand 1 co‐expression correlates with aggressive features in lung adenocarcinoma. Eur J Cancer [Internet]. 2018;101:20–9. 10.1016/j.ejca.2018.06.020 [DOI] [PubMed] [Google Scholar]
- 11. Reck M, Rodriguez‐Abreu D, Robinson AG, Hui R, Csöszi T, Fülöp A, et al. Pembrolizumab versus chemotherapy for PD‐L1‐positive non‐small‐cell lung cancer. N Engl J Med. 2016;375(19):1823–33. [DOI] [PubMed] [Google Scholar]
- 12. Kim HJ, Cantor H. CD4 T‐cell subsets and tumor immunity: the helpful and the not‐so‐helpful. Cancer Immunol Res. 2014;2:91–8. [DOI] [PubMed] [Google Scholar]
- 13. Voskoboinik I, Smyth MJ, Trapani JA. Perforin‐mediated target‐cell death and immune homeostasis. Nat Rev Immunol. 2006;6(12):940–52. [DOI] [PubMed] [Google Scholar]
- 14. Kim CH. FOXP3 and its role in the immune system. Adv Exp Med Biol. 2009;665:17–29. [DOI] [PubMed] [Google Scholar]
- 15. Kinoshita F, Takada K, Yamada Y, Oku Y, Kosai K, Ono Y, Tanaka K, Wakasu S, Oba T, Osoegawa A, Tagawa T, Shimokawa M, Oda Y, Mori M Combined evaluation of tumor‐infiltrating CD8+ and FoxP3+ lymphocytes provides accurate prognosis in stage IA lung adenocarcinoma. Ann Surg Oncol [Internet]. 2020;27(6):2102–9. 10.1245/s10434-019-08029-9 [DOI] [PubMed] [Google Scholar]
- 16. Suda K, Shimoji M, Shimizu S, Sato K, Chiba M, Tomizawa K, et al. Comparison of PD‐L1 expression status between pure‐solid versus part‐solid lung adenocarcinomas. Biomolecules. 2019;9(9):5–11. [DOI] [PMC free article] [PubMed] [Google Scholar]
- 17. Chansky K, Detterbeck FC, Nicholson AG, Rusch VW, Vallières E, Groome P, et al.The IASLC lung cancer staging project: external validation of the revision of the TNM stage groupings in the eighth edition of the TNM classification of lung cancer. J Thorac Oncol 2017;12(7):1109–21. [DOI] [PubMed] [Google Scholar]
- 18. Kohno M, Okamoto T, Suda K, Shimokawa M, Kitahara H, Shimamatsu S, et al. Prognostic and therapeutic implications of aromatase expression in lung adenocarcinomas with EGFR mutations. Clin Cancer Res. 2014;20(13):3613–22. [DOI] [PubMed] [Google Scholar]
- 19. Takada K, Kohashi K, Shimokawa M, Haro A, Osoegawa A, Tagawa T, et al. Co‐expression of IDO1 and PD‐L1 in lung squamous cell carcinoma: potential targets of novel combination therapy. Lung Cancer. 2019;128(December 2018):26–32. [DOI] [PubMed] [Google Scholar]
- 20. Aherne EA, Plodkowski AJ, Montecalvo J, Hayan S, Zheng J, Capanu M, Adusumilli PS, Travis WD, Ginsberg MS What CT characteristics of lepidic predominant pattern lung adenocarcinomas correlate with invasiveness on pathology? Lung Cancer [Internet]. 2018. 10.1016/j.lungcan.2018.01.013, 118, 83, 89 [DOI] [PMC free article] [PubMed] [Google Scholar]
- 21. Binnewies M, Roberts EW, Kersten K, Chan V, Fearon DF, Merad M, et al. Understanding the tumor immune microenvironment (TIME) for effective therapy. Nat Med. 2018;24(5):541–50. [DOI] [PMC free article] [PubMed] [Google Scholar]
- 22. Dejima H, Hu X, Chen R, Zhang J, Fujimoto J, Parra ER, et al. Immune evolution from preneoplasia to invasive lung adenocarcinomas and underlying molecular features. Nat Commun [Internet] 2021;12(1):1–11. 10.1038/s41467-021-22890-x [DOI] [PMC free article] [PubMed] [Google Scholar]
- 23. Mo RJ, Han ZD, Liang YK, Ye JH, Wu SL, Lin SX, et al. Expression of PD‐L1 in tumor‐associated nerves correlates with reduced CD8+ tumor‐associated lymphocytes and poor prognosis in prostate cancer. Int J Cancer. 2019;144(12):3099–110. [DOI] [PubMed] [Google Scholar]
- 24. Feng X, Tang R, Zhang R, Wang H, Ji Z, Shao Y, et al. A comprehensive analysis of IDO1 expression with tumour‐infiltrating immune cells and mutation burden in gynaecologic and breast cancers. J Cell Mol Med. 2020;24(9):5238–48. [DOI] [PMC free article] [PubMed] [Google Scholar]
- 25. Kinoshita F, Toyokawa G, Matsubara T, Kozuma Y, Haratake N, Takamori S, et al. Prognosis of early‐stage part‐solid and pure‐solid lung adenocarcinomas. Anticancer Res. 2019;39(5):2665–70. [DOI] [PubMed] [Google Scholar]
- 26. Hsu KH, Chen KC, Yang TY, Yeh YC, Chou TY, Chen HY, Tsai CR, Chen CY, Hsu CP, Hsia JY, Chuang CY, Tsai YH, Chen KY, Huang MS, Su WC, Chen YM, Hsiung CA, Chang GC, Chen CJ, Yang PC Epidermal growth factor receptor mutation status in stage i lung adenocarcinoma with different image patterns. J Thorac Oncol [Internet] 2011;6(6):1066–72. 10.1097/JTO.0b013e31821667b0 [DOI] [PubMed] [Google Scholar]
- 27. Dong ZY, Zhang JT, Liu SY, Su J, Zhang C, Xie Z, et al. EGFR mutation correlates with uninflamed phenotype and weak immunogenicity, causing impaired response to PD‐1 blockade in non‐small cell lung cancer. Onco Targets Ther. 2017;6(11):e1356145. 10.1080/2162402X.2017.1356145 [DOI] [PMC free article] [PubMed] [Google Scholar]
- 28. Tumeh PC, Harview CL, Yearley JH, Shintaku IP, Taylor EJM, Robert L, et al. PD‐1 blockade induces responses by inhibiting adaptive immune resistance. Nature 2014;515(7528):568–71. [DOI] [PMC free article] [PubMed] [Google Scholar]
- 29. Steele KE, Tan TH, Korn R, Dacosta K, Brown C, Kuziora M, et al. Measuring multiple parameters of CD8+ tumor‐infiltrating lymphocytes in human cancers by image analysis. J Immunother Cancer 2018;6(1):20. [DOI] [PMC free article] [PubMed] [Google Scholar]
Associated Data
This section collects any data citations, data availability statements, or supplementary materials included in this article.
Supplementary Materials
Figure S1 Comparison of the density of tumor‐infiltrating lymphocytes (TILs) in GGO tumors and pure‐solid tumors. Diamond plots of the density of (a) CD4+ TILs, (b) CD8+ TILs, and (c) FoxP3+ TILs. Data are presented as the mean of TILs in GGO (n = 147) and pure‐solid (n = 111) tumors, with individual samples shown as solid circles. p = 0.022, p = 0.618, and p = 0.116 for (a), (b), and (c), respectively
Figure S2. Correlation between consolidation tumor ratio (CTR) and rate of programmed death ligand 1 (PD‐L1) (a) and indoleamine 2,3‐dioxygenase 1 (IDO1) (b) expression. Data are presented as the rate of PD‐L1‐ or IDO1‐positive expression in CTR = 0 (n = 31), <CTR < 0.5 (n = 57), and 0.5 ≤ CTR <1 (n = 59) tumor groups. No significant trend was detected for either PD‐L1 (p = 0.628) or IDO1 (p = 0.188)
Figure S3 Comparison of consideration tumor ratio (CTR) (a), the density of tumor‐infiltrating lymphocytes (TILs) (b, c, d) and rate of programmed death ligand 1 (PD‐L1) (e) and indoleamine 2,3‐dioxygenase 1 (IDO1) (f) expression according driver oncogene. There was no significant difference in CD4+, CD8+ and FoxP3+ TILs, PD‐L1 and IDO1 (p = 0.187, p = 0.737, p = 0.125, p = 0.108, p = 0.438, respectively), while CTR of the tumors with driver oncogene was significantly lower than without (p = 0.004)
Table S1 Clinicopathological features based on the presence of ground glass opacity (GGO) components