

Abstract
The biosynthesis of catechins, a major type of flavonoids accumulated in tea, is mediated by developmental cues and environmental stimuli. Light enhances but shading treatment reduces catechin accumulation in tea leaves. However, the transcription factors involved in light-mediated catechin biosynthesis remain to be identified. Two GOLDEN2 LIKE genes from tea plant (CsGLK1 and CsGLK2) were isolated and characterized in both tomato and tea plants. Transcripts of both CsGLK1 and CsGLK2 were affected by light intensity in tea plants. Overexpression of CsGLK1 and CsGLK2 promoted chloroplast development and carotenoid accumulation in tomato fruits. An integrated metabolomic and transcriptomic approach revealed that both catechin content and related biosynthetic genes were upregulated in CsGLK-overexpressing tomato leaves. Our further studies in tea plants indicated that CsGLKs directly regulate the transcription of CsMYB5b, a transcription factor involved in catechin biosynthesis. Suppression of CsGLKs in tea leaves led to the reduction of both CsMYB5b expression and catechin accumulation. Taken together, the results show that CsGLKs are involved in light-regulated catechin accumulation in tea plants by regulating expression of CsMYB5b and have great potential for enhancing the accumulation of both carotenoids and flavonoids in fruits of horticultural crops.
Introduction
Tea, made from tea plant (Camellia sinensis) leaves, is a popular non-alcoholic beverage worldwide and provides numerous benefits for human health [1–3], including its anti-cancer properties, which are mainly attributed to catechins [4–6]. Catechins are polyphenols of the flavan-3-ol type and are majorly accumulated in tea, usually accounting for >25% of tea leaf biomass [7]. Catechins are synthesized by the flavonoid pathway and some key synthetic enzymes, such as anthocyanidin reductase (ANR) and leucoanthocyanidin reductase (LAR), have been cloned and characterized in tea plants [8–15].
The MYB transcription factors, including AtPAP1, AtTT2, MtMYB14, and VvMYBPA1, play a predominant role in the accumulation of flavan-3-ols and proanthocyanidins (PAs), their polymers, in many plant species [16–18]. Their homologous MYB genes in tea plant include CsMYB5b and CsMYB75. CsMYB5b enhances the synthesis of both catechins and PAs in tobacco leaves by upregulating tobacco LAR and ANR [12, 14]. CsMYB75 is responsible for anthocyanin hyperaccumulation in purple tea [19]. In addition, catechins and PAs were accumulated by co-expressing an Arabidopsis PAP1 MYB transcription factor (AtPAP1) and a Medicago ANR (MtANR) in tobacco and Medicago [20]. Light plays an indispensable role in the biosynthesis of catechins and PAs [21–23]. However, the transcription factors involved in light-mediated catechin biosynthesis remain to be identified.
The Golden2-like (GLK) transcription factors are key regulators of chloroplast development in many plant species, including maize [24], Arabidopsis [25, 26], rice [27], moss [28], pepper [29], tomato [30, 31], and kiwifruit [32]. The flowering plants usually contain two GLK genes (GLK1 and GLK2), due to a recent genome duplication [33]. Both GLK1 and GLK2 are expressed in photosynthetic tissue and exhibit functional redundancy [25, 31]. Knockout of both GLK genes in Arabidopsis resulted in reduced chlorophyll levels and chloroplast size and number, because of the impaired expression of genes involved in photosystems and chlorophyll biosynthesis [25, 26]. Overexpression of tomato GLK2 (SlGLK2), whose mutation is responsible for the uniform ripening phenotype in fruits, increased the chloroplast levels and thereby enhanced the nutritional quality of fruits [30, 31] since the carotenoids are synthesized and stored in chromoplasts, which are converted from chloroplasts. More chromoplasts lead to greater accumulation of carotenoids [34, 35].
Light induces GLK expression, suggesting that GLKs are important for light-induced chloroplast development [25]. A recent study indicated that dark induces GLK1 degradation while light can stabilize and activate GLK1 by BIN2-mediated phosphorylation in Arabidopsis [36]. In tomato, SlGLK2 was degraded by the CUL4-DDB1-DET1 ubiquitin E3 ligase complex [37], which is a crucial component of light signaling and is required for plant photomorphogenesis [38]. Loss-of-function mutants of the E3 ligase complex displayed higher chloroplast levels and increased carotenoid accumulation in tomato fruits [34, 35, 39], possibly because SlGLK2 is stabilized in these mutants [37]. UV-B light increases SlGLK2 expression and overexpression of the tomato UV-B receptor UVR8 (SlUVR8) also enhances chloroplast development and carotenoid accumulation by increasing SlGLK2 accumulation [40].
The functions of GLK genes in chloroplast development and carotenoid accumulation were characterized previously. However, it remains to be determined whether GLK genes regulate flavonoid biosynthesis. In this study, we demonstrated that tea GLK genes (CsGLK1 and CsGLK2) not only promote chloroplast development and carotenoid accumulation but also participate in the light-mediated biosynthesis of catechins and PAs.
Results
Protein alignment and subcellular localization
The tomato GLK2 protein sequence was used for BLAST in the tea genome sequence database (http://tpia.teaplant.org/index.html) [41]. Six loci were obtained and highlighted in the green frame in Supplementary Data Fig. S1. Only two loci (TEA015144 and TEA009544) contain the complete nuclear localization signal (NLS, as indicated in the yellow frame in Supplementary Data Fig. S1), GARP DNA-binding domain (DBD, as indicated in the blue frame in Supplementary Data Fig. S1), and AREAEAA/AREVEAA hexapeptide (highlighted in the red frame in Supplementary Data Fig. S1). All these domains are conserved and essential for GLK functions [24]. For further functional characterization, these two genes were isolated and named CsGLK2 and CsGLK1, respectively, based on protein sequence alignment (Supplementary Data Fig. S2A) and phylogenetic tree analysis (Supplementary Data Fig. S2B).
The protein sequence alignments (Supplementary Data Fig. S2A) showed that the CsGLKs have an N-terminal DBD domain (marked by a black line), and a conserved GOLDEN2 C-terminal (GCT) box [24]. In addition, the hexapeptide sequence (AREAEAA/AREVEAA, marked with a black asterisk) is also highly conserved in the GLK proteins [25]. The alignment analysis showed that CsGLKs contain typical domains that determine the GLK protein family. The phylogenetic tree analysis (Supplementary Data Fig. S2B) showed that CsGLK1 and CsGLK2 homologs were more closely related to kiwifruit AchGLK [32].
To examine the subcellular localization, GFP was fused to the C terminuses of CsGLK1 and CsGLK2. Transient expression in tobacco protoplasts showed that CsGLK1/CsGLK2-GFP were localized in the nucleus, while the GFP (green fluorescent protein) signal was detected in the cytoplasm (Supplementary Data Fig. S3). These results confirmed the nuclear localization of both CsGLK1 and CsGLK2.
Expression pattern of CsGLK1 and CsGLK2
To study the tissue-specific expressions of CsGLK1 and CsGLK2, total RNAs were extracted from different tissues of tea plants. qRT–PCR assays showed that CsGLKs were expressed in the leaves and stems tested, but at a very low level in roots and flowers (Fig. 1A). CsGLK2 showed much higher expression in tea fruits than CsGLK1 (Fig. 1A), similar to the patterns of SlGLKs in tomato [30]. Besides, both genes were downregulated by treatment with decreased light intensity (Fig. 1B). Only 34% of CsGLK1 transcripts and 18% of CsGLK2 transcripts were detected in the dark, compared with control light (216 μmol m−2 s−1) (Fig. 1B). These results indicated that light regulates the expression of CsGLKs in tea plants.
Figure 1.

Expression patterns of CsGLK1 and CsGLK2 in tea plants. (A) Expression of CsGLK1 and CsGLK2 in root, stem, leaf, flower, and fruit of local cultivar ‘Shuchazao’ determined by qRT–PCR analysis. (B) Expression levels of CsGLK1 and CsGLK2 in plants cultured in control light (light intensity 216 μmol m−2 s−1), shading (108 μmol m−2 s−1), and dark (0 μmol m−2 s−1) conditions for 24 hours. Error bars represent standard deviations of three biological replicates. Different letters above the columns indicate statistically significant differences (Duncan test, P < .05).
CsGLK overexpression enhanced chloroplast development and carotenoid accumulation in tomato
The ‘Micro-Tom’ tomato is suitable for functional verification of GLKs because it contains an insertion mutant in the SlGLK2 gene, which causes the uniform ripening phenotype in fruits [30]. Therefore, we used the CaMV35S promoter and ectopically overexpressed CsGLK1 and CsGLK2 in ‘Micro-Tom’ tomato plants to investigate their function in the regulation of chloroplast development. More than 10 transgenic tomato lines were obtained. For each construct, three independent transgenic lines (CsGLK1-OE-1, -2, and -3; CsGLK2-OE-1, -2, and -3) with the highest expression were chosen for further analysis and their transcription levels were verified by qRT–PCR (Fig. 2A). As expected, all transgenic plants overexpressing CsGLK1 or CsGLK2 displayed darker green leaves (Fig. 2B) and immature fruits (Fig. 2D) than wild-type (WT) plants. Consistently, increased chlorophyll contents in leaves (Fig. 2C) and fruits (Fig. 2E) were detected in the CsGLK-overexpressing lines. Transmission electron microscopy (TEM) observation showed a significant increase in chloroplast number per square millimeter in sections of fruits (Supplementary Data Fig. S4A and B) and leaves (Supplementary Data Fig. S4C and D) from CsGLK-overexpressing lines compared with WT. CsGLK1 or CsGLK2 overexpression also resulted in significantly increased chloroplast size, as indicated by the increased chloroplast areas in the transgenic fruits (Supplementary Data Fig. S4A and B) and leaves (Supplementary Data Fig. S4C and D). Similar phenotypes were observed in tomato fruits overexpressing SlGLK2 [30, 31] or AchGLK [32], suggesting that CsGLKs share the conserved function in promoting chloroplast development and chlorophyll synthesis.
Figure 2.
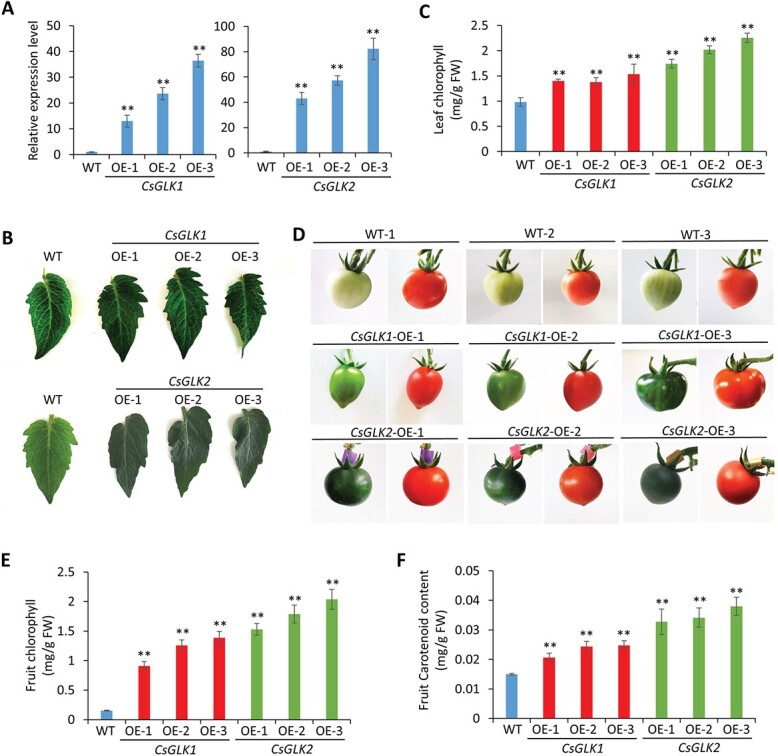
Characterization of tomato plants overexpressing CsGLK1 and CsGLK2. (A) qRT–PCR analysis of CsGLK1 and CsGLK2 expression in three independent transgenic ‘Micro-Tom’ lines overexpressing CsGLK1 (CsGLK1 OE-1, -2, and -3) and CsGLK2 (CsGLK2 OE-1, -2, and -3). Error bars indicate standard deviation of three biological replicates. (B) Leaf morphology of 40-day-old WT and transgenic CsGLK1 OE and CsGLK2 OE plants. (C) Total chlorophyll contents in leaves from 40-day-old WT and transgenic plants shown in (B). FW, fresh weight. (D) Fruits in mature green and red ripe stage of WT and three transgenic lines of CsGLK1 OE and CsGLK2 OE. (E, F) Total chlorophyll contents in mature green fruits (E) and carotenoid contents in red ripe fruits (F) of WT and transgenic plants. Mean ± standard deviation values were obtained from at least 15 measurements. **P < .001 (Student’s t-test).
Previous studies showed that the carotenoid content of fruit is positively correlated with chloroplast development [31, 34]. Therefore, we also analyzed carotenoid accumulation in the fully ripened fruits of CsGLK1/CsGLK2-overexpressing lines, and the results indicated that total carotenoid contents were obviously increased in the transgenic lines (Fig. 2F).
Metabolomic and transcriptomic analysis of CsGLK-overexpressing leaves
Since tea is made from the leaves of tea plants and it remains largely unknown how GLK influences leaf metabolism, we used metabolomic assay to investigate the alterations of leaf metabolism in CsGLK-overexpressing tomato plants. Six biological replicates were analyzed for WT and CsGLK1- and CsGLK2-overexpressing plants. Each replicate was actually a pooled sample collected from three independent transgenic lines or WT individuals. A total of 297 annotated metabolites were identified in at least one of the samples (Supplementary Data Table S1), including ~30% amino acids, 28% lipids, 18% carbohydrates, 10% nucleotides, 8% cofactors and vitamins, 4% xenobiotics, and 2% other groups (Fig. 3A). All identified metabolites were analyzed by agglomerate hierarchical clustering and are presented in a heat map (Supplementary Data Fig. S5). Principal component analysis (PCA) showed that these samples could be divided into three groups for WT, CsGLK1-, and CsGLK2-overexpressing plants, respectively, indicating the reliable repeatability of these samples derived from three different genotypes (Fig. 3B).
Figure 3.

Metabolomic analysis of tomato leaves overexpressing CsGLK1 and CsGLK2. (A) Identified metabolites were classified into several categories, including amino acids, lipids, carbohydrates, nucleotides, cofactors and vitamins, xenobiotics, energy, and peptides. According to their percentages with respect to total metabolites, the top 10 categories were selected to draw the pie chart. (B) PCA of all samples from three different genotypes. Red triangles indicate CsGLK2-OE plants. Green squares indicate CsGLK1-OE plants. Blue circles indicate WT plants. (C) KEGG analysis of DAMs among three genotypes (CsGLK2-OE versus CsGLK1-OE versus WT). The red frames highlight the pathways related to flavonoid biosynthesis.
Next, more than 160 differently accumulated metabolites (DAMs) were identified among three genotypes (Supplementary Data Table S1). KEGG (Kyoto Encyclopedia of Genes and Genomes) pathway analysis indicated that these DAMs were obviously enriched in the processes of primary metabolism, such as the metabolisms of amino acids, ABC transporters, and energy, as well as in some secondary metabolisms, such as α-linolenic acid metabolism and isoquinoline alkaloid biosynthesis (Fig. 3C). Among them, phenylpropanoid, flavonoid, flavone, and flavonol biosyntheses were highly related (highlighted by red frames in Fig. 3C). These results indicated that CsGLKs are involved not only in primary metabolisms but also in some secondary ones, especially flavonoid biosynthesis, which is pivotal for the nutrient qualities of tea.
To further investigate how CsGLKs affect flavonoid biosynthesis (Fig. 4A), we presented the flavonoid-related metabolites detected in the metabolomic assays as the heat map shown in Fig. 4B. Among these metabolites, cinnamic acid, coumaric acid, epicatechin, and catechin were significantly increased in both the CsGLK1- and CsGLK2-overexpressing lines compared with WT plants (Fig. 4B). Catechin was increased by 4.49 and 4.05 times in the CsGLK1- and CsGLK2-overexpressing lines, respectively (Supplementary Data Table S1). To further confirm these results, we used two commercial assay kits to quantitatively measure the total flavonoids (Fig. 4C) and oligomeric proanthocyanidin (OPC) contents (Fig. 4D), in both transgenic leaves and fruits. HPLC analysis of catechin monomers (Supplementary Data Fig. S6) also confirmed that catechin (C) and epicatechin gallate (GCG) are substantially accumulated in the transgenic tomato leaves. The results showed that CsGLK overexpression enhanced flavonoid and OPC accumulation in both fruits and leaves.
Figure 4.

CsGLK overexpression enhanced flavonoid biosynthesis. (A) Schematic diagram of the flavonoid biosynthesis pathway with the catalytic enzymes. (B) The heat map shows the contents of detected flavonoid metabolites in WT and transgenic plants (CsGLK1-OE and CsGLK2-OE). Data represent average values from six biological replicates. (C, D) Total flavonoid (C) and OPC (D) contents in leaves and red ripe fruit of WT and transgenic lines. FW, fresh weight. Mean ± standard deviation values were obtained from at least 15 measurements. **P < .001 (Student’s t-test). (E) Heat map of relative expression levels of flavonoid biosynthetic genes identified in the transcriptome analysis of three genotypes (WT, CsGLK1-OE, and CsGLK2-OE). Data represent average values of three biological replicates. (F) qRT–PCR analysis of SlANR (Solyc04g015590) and SlLAR (Solyc05g009860) in WT and transgenic lines. Error bars indicate standard deviation of three biological replicates.
Next, we performed transcriptome analysis for the same samples as those used in the metabolomic analysis and all the differentially expressed genes (DEGs) are listed in Supplementary Data Table S2. Most of the flavonoid biosynthetic genes (Fig. 4A) were detected in our transcriptome and the average levels of their transcripts in three replicates are shown in a heat map in Fig. 4E. The PAL, C4H, F3′H, DFR, and ANR genes were increased in both CsGLK1- and CsGLK2-overexpressing lines (Fig. 4E). Most of their expression patterns were validated by qRT–PCR (Supplementary Data Fig. S7). The enhanced expression of PALs and C4H might be responsible for the increased accumulation of cinnamic and coumaric acids. Upregulation of F3′H, DFRs, and ANR genes (Fig. 4E) should contribute to the increased accumulation of epicatechin and catechin (Fig. 4B). Consistent with the transcriptome analysis, an increase in ANR expression was detected in the CsGLK1- and CsGLK2-overexpressing lines by qRT–PCR assays (Fig. 4F). Although the LAR gene was not identified in our transcriptomic analysis, our qRT–PCR showed that it was also upregulated in both transgenic lines (Fig. 4F). These results indicated that the enhanced catechin and epicatechin accumulation possibly resulted from upregulation of some flavonoid biosynthetic genes, including SlLAR and SlANR, which play important roles in catechin and epicatechin biosynthesis.
CsGLKs are involved in flavonoid metabolism by directly activating transcription of CsMYB5b in tea plant
To check whether CsGLKs directly activate LAR and ANR in tea plants, the native promoters of CsLAR (CsLAR-Pro) and CsANR (CsANR-Pro) were cloned from the genome of ‘Shuchazao’ and fused with the reporter gene GUS to construct CsLAR-Pro::GUS and CsANR-Pro::GUS, respectively. The transient expression of CsANR-Pro::GUS produced very low GUS activity compared with that of 35S::GUS and the co-expressions of CsANR-Pro::GUS with 35S::CsGLK1 (or 35S::CsGLK2) had no obvious effect on GUS activity (Fig. 5A). Similarly, the combined expression of CsLAR-Pro::GUS with 35S::CsGLK1 (or 35S::CsGLK2) did not produce higher GUS activity than the individual expression of CsLAR-Pro::GUS (Fig. 5A). These results indicated that CsGLKs cannot activate the promoters of the CsLAR or CsANR genes.
Figure 5.

CsGLKs activate the promoter of CsMYB5b but not that of structural genes in catechin biosynthesis. (A) GUS staining and activities detected in N. tabacum leaves transiently expressing CsANR-Pro::GUS, CsLAR-Pro::GUS, CsMYB5b-Pro::GUS, CsMYB5a-Pro::GUS, or 35S::CsGLK1/CsGLK2 combined (shown by ‘+’) with these reporter constructs. 35S::GUS was used here as a positive control. Circle leaves with blue or yellow color represent GUS staining. GUS activities were measured quantitatively and are shown as means ± standard deviation of six independent assays. **P < .001 (Student’s t-test). (B) EMSA between CsGLK1/2 and the promoters of CsMYB5b. Purified His-tagged CsGLK1 and CsGLK2 proteins were incubated with unlabeled probe (cold) or biotin-labeled probe, and DNA–protein complexes were separated on native polyacrylamide gels, then photographed. The presence or absence of specific probes is marked by the symbol ‘+’ or ‘−’. Specific binding of CsGLKs to promoters of CsMYB5b probe 1 (left) and CsMYB5b probe 2 (right).
Among the DEGs from our transcriptomic analysis, several MYB transcription factors were identified (Supplementary Data Table S2 and Supplementary Data Fig. S8), including SlMYB54, the highly homozygous gene of CsMYB5b that was demonstrated to positively regulate catechin biosynthesis by activating LARs and ANRs in tea plants [12, 14]. The qRT–PCR analysis confirmed that SlMYB54 and other identified MYB genes were indeed upregulated in the CsGLK1- and CsGLK2-overexpressing transgenic tomato lines (Supplementary Data Fig. S8), suggesting that CsGLKs might enhance catechin synthesis by directly activating the transcription of CsMYB5b in tea plants. To support this notion, we expressed CsMYB5b-Pro::GUS alone or co-expressed with 35S::CsGLK1 (or 35S::CsGLK2) in tobacco leaves. We observed significantly higher GUS activities in the co-expressed combinations than with the expression of CsMYB5b-Pro::GUS alone (Fig. 5A). In addition, the native promoter of another MYB gene (CsMYB5a), which promotes the accumulation of PAs [42], was also cloned and fused with GUS. The combined expression of CsMYB5a-Pro::GUS and 35S::CsGLK1 (or 35S::CsGLK2) did not alter the GUS activities compared with expression of CsMYB5a-Pro::GUS alone (Fig. 5A). These results suggest that CsGLKs involve transcriptional activation of CsMYB5b but not CsMYB5a. Next, the electrophoretic mobility shift assay (EMSA) was used to study whether CsGLKs can physically bind the promoter of CsMYB5b. Based on the identified cis-elements that GLK binds in Arabidopsis [26, 36], we found three similar element motifs in the promoter of CsMYB5b and designed three corresponding probes (probes 1, 2, and 3) (Supplementary Data Fig. S9A). EMSA results showed that CsGLKs were capable of binding probes 1 and 2 in vitro (Fig. 5B), but not probe 3 (Supplementary Data Fig. S9B). These results indicated the direct interaction between CsGLKs and the promoter of CsMYB5b.
To further confirm the involvement of CsGLK-mediated regulation of CsMYB5b expression and catechin biosynthesis, a gene-specific antisense oligonucleotide (AsODN) method was employed to suppress the expression of CsGLK1 and CsGLK2 in C. sinensis leaves [43]. Consequently, the expression of CsGLK1 in tea leaves treated with AsODN_CsGLK1 was obviously decreased in three independent tests, compared with leaves treated with sense oligonucleotides of CsGLK1 (sODN_CsGLK1) (Fig. 6A). The mRNA levels of CsMYB5b (Fig. 6B), CsANR (Fig. 6D), and CsLAR (Fig. 6E) and OPC contents (Fig. 6F) of the tea leaves were all significantly reduced in the AsODN_CsGLK1 plants compared with those in control (sODN_CsGLK1) plants. Similarly, CsGLK2 silencing (Fig. 6A) also impaired the expressions of these genes (Fig. 6B, D, and E) and OPC contents (Fig. 6F). HPLC analysis of catechin monomers also confirmed that all the detectable monomers were significantly less in AsOND leaves than in sODN leaves (Supplementary Data Fig. S10). Consistent with the results of the above-mentioned GUS assays, suppression of CsGLKs had no obvious effect on CsMYB5a expression (Fig. 6C). These results confirmed that CsGLKs mediate catechin biosynthesis in tea leaves by transcriptionally regulating CsMYB5b but not CsMYB5a. Besides, light intensity also affects expression levels of CsMYB5b, CsANR, and CsLAR in the tea plant (Supplementary Data Fig. S11), which is consistent with the expression pattern of CsGLKs (Fig. 1B).
Figure 6.
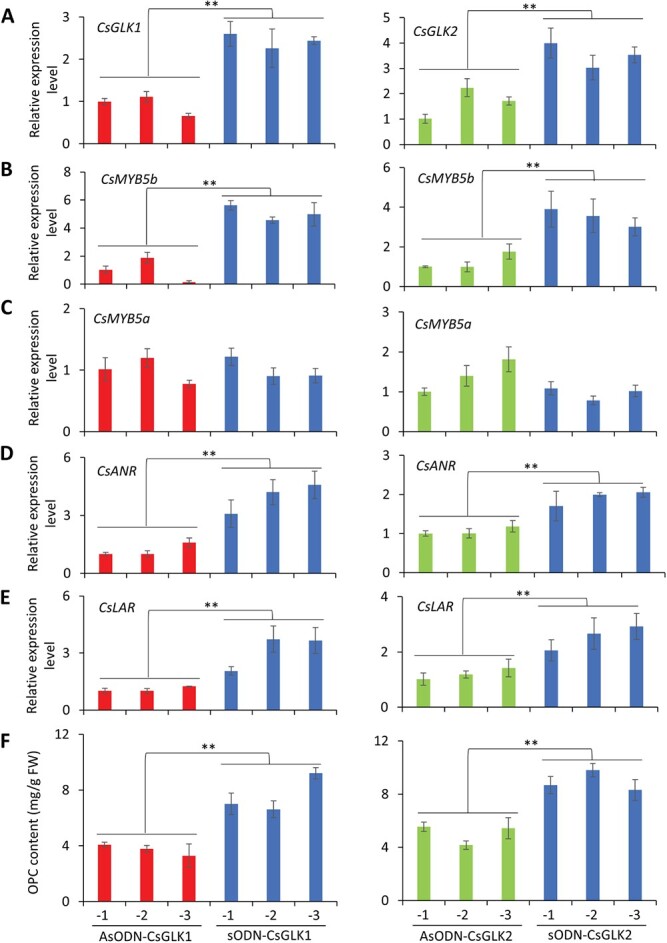
CsGLK silencing impaired CsMYB5b expression and catechin biosynthesis in tea plants. (A–E) qRT–PCR analysis of mRNA levels of CsGLK1 and CsGLK2 (A), CsMYB5b (B), CsMYB5a (C), CsANR (D), and CsLAR (E) in tea plants that were treated with antisense oligonucleotides (AsODNs) and sense oligonucleotides (sODNs) against CsGLK1 and CsGLK2. Mean ± standard deviation values were obtained from six independent assays. (F) OPC contents of tea leaves treated with AsODN or sODN against CsGLK1 and CsGLK2. FW, fresh weight. Mean ± standard deviation values were obtained from six independent assays. **P < .001 (Student’s t-test).
Discussion
GLKs have been demonstrated to play a key role in chloroplast development in many plant species [25, 26, 30, 31]. Our results indicate that CsGLK1 and CsGLK2 from the tea plant also possess the conserved function in enhancing chloroplast development, as indicated by the increased chloroplast number and size in fruits and leaves of CsGLK-overexpressing tomato plants (Supplementary Data Fig. S4). The carotenoids, including lycopene, are very important nutrients of tomato fruits and are synthesized and accumulated in chromoplasts. CsGLK-overexpressing tomato fruits exhibit higher contents of carotenoids (Fig. 2) since they contain more chromoplasts than WT plants.
In most tomato cultivars, flavonoids are hardly produced in the fruits because of low expression of flavonoid biosynthetic genes in fruits [44, 45]. Flavonoids, a large family of polyphenolic compounds, include anthocyanins, flavan-3-ols, flavonols, flavones, flavanones, and isoflavones [46]. Overexpression of the petunia CHI gene increased flavonol levels in tomato fruits [44]. Mutation [47] or fruit-specific silencing [48] of the tomato DET1 gene led to higher contents of flavonol (quercetin) and flavanone (naringenin) in fruits. Fruit-specific co-expression of a bHLH transcription factor, Del, and an MYB-related transcription factor, Ros1, resulted in purple tomato fruits with enhanced accumulation of anthocyanins [45]. Recent studies indicated that SlAN2-like (an MYB transcription factor) also regulates anthocyanin accumulation in both peel and flesh of tomato fruits [49, 50]. To our best knowledge, enhanced flavan-3-ol biosynthesis in tomato fruits has not been accomplished yet. Our work indicated that overexpression of CsGLKs enhanced the accumulation of flavan-3-ols, including catechin, epicatechins, and their polymers (PAs) in both leaves and fruits (Fig. 4).
The biosynthesis of catechin, a major type of flavonoid accumulated in tea, is mediated by both developmental cues and environmental stimuli [23, 51]. In most cases, light promotes catechin biosynthesis [21, 52, 53] and shading treatment reduces catechin accumulation in tea leaves [22, 23, 51, 54]. However, it remains largely unknown how light regulates catechin biosynthesis. Our results indicated that the transcription of both GLK genes was affected by various light intensities (Fig. 1B) and overexpression of CsGLKs significantly increased the contents of catechin and epicatechin (Fig. 4; Supplementary Data Fig. S6). Suppression of CsGLK1 or CsGLK2 expression in tea leaves resulted in reduced accumulation of catechin monomers (Supplementary Data Fig. S10) and OPC contents (Fig. 6). Interestingly, CsGLK-overexpressing tomato leaves substantially accumulated catechin and epicatechin gallate (Supplementary Data Fig. S10), indicating that tomato might have all the structural genes required for catechin biosynthesis and have great potentials for studying catechin accumulation. Besides, these results suggested that CsGLKs are involved in light-mediated catechin accumulation in tea plants and shading treatment decreases catechin contents, possibly through suppressing expression levels of GsGLKs (Supplementary Data Fig. S12). In Arabidopsis, GLK genes were also induced by light [25] and GLK proteins were degraded in the dark [36]. It appears that light-mediated GLK expression is also conserved in tea plants.
PAL catalyzes the rate-determining step in phenylpropanoid synthesis [55]. Previous studies indicated that both gene expression and enzyme activity of PAL are affected by shading treatment and PAL is involved in light-mediated catechin biosynthesis [21–23]. In CsGLK-overexpressing plants, transcripts of PALs and the catalytic product cinnamic acid were significantly increased (Fig. 4). Besides, transcripts of C4H, F3′H, ANR, and LAR were decreased by shading treatment [23] and all were increased in CsGLK-overexpressing plants in our study (Fig. 4). These results indicate that CsGLKs participate in light-mediated activation of flavonoid biosynthetic genes.
LARs catalyze the leucoanthocyanidins to catechins [56] and ANRs convert anthocyanins into epicatechins [57]. Co-expression of LAR and ANR enhances the accumulation of flavan-3-ols and their polymeric PAs [12]. Although upregulation of LAR and ANR was observed in the CsGLK-overexpressing tomato lines, CsGLKs did not directly activate the promoters of CsLAR and CsANR (Fig. 5). Previous studies in many plant species indicated that MYBs, such as AtTT2, VvMYBPA1, and MtMYB14, mediate the biosynthesis of flavan-3-ols and PAs [16–18]. Their homologous MYB gene in the tea plant (CsMYB5b) was also proved to promote accumulation of flavan-3-ols and PAs by upregulating LAR and ANR [12, 14]. Our transcriptomic results revealed that several MYB genes, including SlMYB54, the homologous gene of CsMYB5b in tomato, were upregulated in the CsGLK-overexpressing plants (Supplementary Data Fig. S7). Therefore, we speculate that CsGLKs increased the transcripts of LAR and ANR genes, possibly through directly activating transcription of CsMYB5b in tea plants. Our further analysis confirmed that both CsGLKs recognized the promoter of CsMYB5b (Fig. 5). The AsODN-mediated suppression of CsGLKs in tea plant leaves also led to decreased expression of CsMYB5b and reduced accumulation of PAs (Fig. 6B and F). These results indicated that CsGLKs enhance catechin biosynthesis by directly regulating CsMYB5b transcription in tea leaves (Supplementary Data Fig. S12).
Metabolic activities in chloroplasts are highly oxidizing and the rapid electron flow frequently results in the production of chloroplastic reactive oxygen species (ROS) [58, 59]. The presence of ROS-generating centers makes the chloroplast a major organelle of ROS production, especially under fluctuating light intensity [60, 61]. Flavonoids, including catechin, are natural antioxidants and act as scavengers of ROS [62, 63]. On one hand, CsGLKs promote chloroplast development. On the other hand, they also enhance the biosynthesis of flavonoids, possibly to alleviate the oxidative stress caused by more chloroplasts under fluctuating irradiation. This speculation is consistent with a previous observation indicating that light-sensitive tea leaves produced large amounts of flavonoids, including catechin and epicatechin, which function in photoprotection and facilitate the acclimatization of tea plants by scavenging ROS [51]. Of course, this requires further investigations to demonstrate the coordination between CsGLK-enhanced chloroplast development and flavonoid biosynthesis.
Our characterization of tea GLK genes (CsGLK1 and CsGLK2) has indicated that CsGLKs are involved in both chloroplast development and catechin accumulation in tea plants. These two genes are also promising candidates for genetic manipulation to enhance accumulation of both carotenoids and flavan-3-ols in fruits of horticultural crops.
Materials and methods
Plant material and growth conditions
Tea plants (C. sinensis ‘Shuchazao’) were grown in a tea plantation at Anhui Agricultural University, Hefei, China (117.27E, 31.86N). Roots, stems, mature leaves, flowers, and fruits of tea were collected and immediately frozen in liquid nitrogen. Shade treatment was performed using shading nets with a transmittance rate of 50% and the whole tea plants were covered by the shading nets for 24 hours. Control and shaded plants were grown in an incubator at 24°C with continuous light (light intensity 216 μmol m−2 s−1) for 24 hours. Dark treatment was performed in the same incubator without light.
WT tomatoes (Solanum lycopersicum ‘Micro-Tom’) were used in our laboratory. They were grown in a constant-temperature cultivation chamber at 24°C with a photoperiod of 16 hours light/8 hours dark.
Tobacco (Nicotiana tabacum and N. benthamiana) plants, which were used for GUS activation and subcellular localization, respectively, were cultivated in a constant temperature of 24°C and a photoperiod of 16 hours light/8 hours dark.
Bacterial strains
Escherichia coli Trans-T1 was purchased from TransGen Biotech, Beijing, China. Agrobacterium tumefaciens EHA105 and GV3101 (Tolobio, Shanghai, China) were used for stable and transient expression, respectively.
Cloning of CsGLK1 and CsGLK2
Total RNA was extracted from the tea plants using an RNA Extraction Kit (Biofit, Beijing, China) according to the manufacturer’s instructions. Reverse transcription reactions were performed using the HiScript II 1st Strand cDNA Synthesis Kit (Vazyme, Nanjing, China). The gene was amplified with PrimeSTAR® Max DNA Polymerase (Takara, Dalian, China) using cDNA. The PCR products were purified with a Gel Extraction Kit (Vazyme, Nanjing, China), ligated into a pEasy-Blunt Simple vector (TransGen Biotech, Beijing, China), and subsequently transformed into Trans-T1-competent cells for sequencing. The primers of CsGLK1 (accession number MZ093621) and CsGLK2 (MZ093620) are listed in Supplementary Data Table S3.
Phylogenetic analysis of GLKs
The protein sequences of GLKs from kiwifruit, rice, tomato, and Arabidopsis were used. The tree was constructed according to the alignments, using MEGA 7.0 with the neighbor-joining method under the standard parameters. Alignment of amino acid sequences was conducted using DNAMAN 8.0.
Quantitative real-time PCR
ChamQ™ Universal SYBR® qPCR Master Mix was used based on the manufacturer’s instructions (Vazyme, Nanjing, China). The PCR reactions were performed in a CFX Connect™ Real-Time System (Bio-Rad, USA). Relative expression values were determined using the 2−ΔΔCT method [64]. In the qRT–PCR analysis, error bars represent variation from three replicates for each sample; each sample was quantified in triplicate. Statistical significance was determined by Student’s t-test. All data were analyzed busing SPSS statistical software. The qRT–PCR primers are listed in Supplementary Data Table S3.
Subcellular localization
The coding sequences of CsGLK1 and CsGLK2 were amplified by PCR with gene-specific primers (Supplementary Data Table S3). The product was inserted into vector pART27 containing the CaMV35S promoter and a GFP. The recombinant vectors 35S::CsGLK1/CsGLK2-GFP were transformed into A. tumefaciens strain GV3101, which was infiltrated into tobacco (N. benthamiana) leaves. The infiltrated plants were cultured for 2 days. Protoplasts from the injection site were isolated by enzymolysis (Cellulase R-10 and Macerozyme R-10, Yakult, Japan) and subsequently treated with 10 μg/mL DAPI for 30 min. The GFP signal was detected with a confocal microscope (FV1000; Olympus, Tokyo, Japan).
Tomato transformation
Whole coding sequences for CsGLK1 and CsGLK2 were amplified and ligated into plant expression vector pBI121 containing the 35S promoter. The recombinant vectors 35S::CsGLK1/CsGLK2OE were transformed into A. tumefaciens strain EHA105. A. tumefaciens-mediated transformation was used to obtain transgenic plants according to the described procedure [34].
Transmission electron microscopy analyses of chloroplast cells
For analysis by TEM, the pericarps of mature green fruits (20 days after anthesis) and leaves from transgenic and WT tomato plants were cut and fixed in electron microscope fixative (Servicebio, Wuhan, China). The sections were analyzed using a transmission electron microscope (Hitachi, HT7700). The chloroplast area was measured using Image J software.
Determination of chlorophyll, carotenoid, total flavonoid, and OPC contents
Mature leaves from 40-day-old WT and transgenic plants and mature green fruits were harvested for total chlorophyll measurements, which were performed using the commercial Chlorophyll Assay Kit (Solabio, Beijing, China). Mature leaves and red ripe fruits were harvested for quantitative measurements of flavonoids, OPC contents, and carotenoids. These measurements were performed using the commercial Plant Flavonoids Assay Kit (Solabio, Beijing, China), the OPC Content Assay Kit (Boxbio, Nanjing, China), and the Plant Carotenoid Assay Kit (Solabio, Beijing, China), respectively.
Metabolomic and transcriptomic analysis
Leaf tissues (six biological replicates, each of which was a pooled sample from three independent transgenic lines) of 40-day-old transgenic lines (CsGLK1OE and CsGLK2OE) and WT plants were harvested and examined by ultra-high-performance liquid chromatography–tandem mass spectrometry (UPLC–MS/MS). All metabolites were analyzed by comparison of the ion features in the samples according to a library of chemical standard entries, including molecular weight, preferred adducts, retention time, and in-source fragments as well as associated MS spectra and the results were checked for accuracy by visual inspection for quality control [65].
RNA-Seq cDNA libraries were obtained from RNA isolated from the above-mentioned tomato leaves (three biological replicates for each genotype) using the NEBNext mRNA Library for Illumina, and subsequently PCR-amplified using NEBNext Multiplex Oligos for Illumina (New England Biolabs, USA). A High Sensitivity DNA chip on a 2100 Bioanalyzer (Agilent Technologies, USA) was used to determine the quality and average length of cDNAs in the library. RNA-Seq libraries were sequenced on a HiSeq 2500 (Illumina) system according to the manufacturer’s instructions. DEG data were analyzed using methods similar to those described previously [66]. Genes with a fold change ≥2 and P-value < .01 were determined to be differentially expressed.
Determination of catechin composition by reverse-phase HPLC
The HPLC assay was employed to determine the catechin monomers in tea and tomato leaves. One gram of powder was dissolved with 10 ml of 95% ethanol, purified and extracted with chloroform and ethyl acetate. After drying, the preparation was dissolved and the volume was fixed with 1 mL of methanol. The contents of filtered extracts were separated and detected by the HPLC assay using a C18 Aqua column (4.6 mm × 150 mm, i.d. 5 μm), a 1525 Binary Pump, and a 2489 UV/Visible Detector (Waters, USA). The injection volume was 10 μL. The mobile phase was 10% aqueous acetic acid (v/v) and 100% acetonitrile. Catechins were monitored at 280 nm. Chromatographic peaks were identified and quantified by comparison with six standards (Epigallocatechin/EGC, 970-74-1; Catechin/C, 154-23-4; Epicatechin/EC, 490-46-0; Epigallocatechin gallate/EGCG, 989-51-5; Gallocatechin gallate/GCG,4233-96-9; Epicatechin gallate/ECG, 1257-08-5, Yuanye, http://www.shyuanye.com/).
Transient expression and GUS assays
The native promoter (2023 bp upstream sequence of the coding region) of CsMYB5b (KY827397) was isolated from ‘Shuchazao’ and inserted into pBI121 to replace the CaMV35S promoter followed by the GUS reporter. Similarly, the CsMYB5a (KY827396) promoter (2216 bp), the CsANR (GU992402) promoter (2179 bp), and the CsLAR (GU992401.1) promoter (2598 bp) were isolated and cloned to construct CsMYB5a-Pro::GUS, CsANR-Pro::GUS, and CsLAR-Pro::GUS, respectively. Six-week-old N. tabacum leaves were injected with either a reporter construct alone or combined with 35S::CsGLK1 or 35S::CsGLK2. The constitutive expression vector (35S::GUS) was used as the positive control by A. tumefaciens-mediated transient expression. The methods of GUS staining and enzyme activity determination were as described previously [66].
Electrophoretic mobility shift assay
The full-length coding sequences of CsGLK1 and CsGLK2 were amplified and inserted into the pET32a vector to generate the recombinant His-CsGLK1/CsGLK2 plasmid. The recombinant plasmid was introduced into Rosetta cells, and His-GLK1 and His-GLK2 proteins were expressed and purified using His Sepharose beads. Two conserved cis-element motifs of CsMYB5b promoters were found. The oligonucleotide probes containing GLK-binding sites CCAAAC and G-box TACGTT were labeled with biotin at the 3′ end of the sense strand according to the EMSA probe biotin labeling kit (Beyotime GS008). The EMSA was performed according to a previous study [67]. To confirm the specificity of the shifted band, a 100- to 200-fold amount of non-labeled cold probe was used. A Chemiluminescent EMSA Kit (Beyotime GS009) was used to detect the binding of protein–DNA.
Gene suppression of CsGLK1 and CsGLK2 in tea plants
SOLIGO software (https://sfold.wadsworth.org/cgi-bin/soligo.pl) was used to select candidate AsODNs against CsGLK1 and CsGLK2 (Supplementary Data Table S3). AsODNs were synthesized by General Biosystems Company. Tea seedlings at the stage of one bud and two leaves were injected with 20 μM AsODN solution and treated for 24 hours (16 h light/8 h dark). Sense oligonucleotides (sODNs) were used as control. The experiments were performed according to the methods described in the previous study [43].
Acknowledgements
This work was supported by grants from the National Natural Science Foundation of China (31900257 and 31972474) and Leading Talent Group Funding of Anhui Province (WRMR-2020-75).
Author contributions
L.W., Y.L., and S.W. conceived and designed the experiments. L.W., X.T., S.Z., X.X., and M.L. performed all experiments and analyzed the data. S.W. and Y.L. wrote the manuscript. All authors approved the manuscript.
Data availability
All data generated from the study appear in the submitted article.
Conflict of interest
The authors declare no conflicts of interest.
Supplementary data
Supplementary data is available at Horticulture Research online.
Supplementary Material
Contributor Information
Lihuan Wang, School of Horticulture, State Key Laboratory of Tea Plant Biology and Utilization, Anhui Agricultural University, Hefei 230036, China.
Xiaofeng Tang, School of Food and Biological Engineering, Hefei University of Technology, Hefei, 230009 China.
Shiqiang Zhang, School of Food and Biological Engineering, Hefei University of Technology, Hefei, 230009 China.
Xiang Xie, School of Food and Biological Engineering, Hefei University of Technology, Hefei, 230009 China.
Mengfei Li, School of Horticulture, State Key Laboratory of Tea Plant Biology and Utilization, Anhui Agricultural University, Hefei 230036, China.
Yongsheng Liu, School of Horticulture, State Key Laboratory of Tea Plant Biology and Utilization, Anhui Agricultural University, Hefei 230036, China; Ministry of Education Key Laboratory for Bio-resource and Eco-environment, College of Life Science, State Key Laboratory of Hydraulics and Mountain River Engineering, Sichuan University, Chengdu, Sichuan 610064, China.
Songhu Wang, School of Horticulture, State Key Laboratory of Tea Plant Biology and Utilization, Anhui Agricultural University, Hefei 230036, China.
References
- 1. Middleton E Jr, Kandaswami C. Effects of flavonoids on immune and inflammatory cell functions. Biochem Pharmacol. 1992;43:1167–79. [DOI] [PubMed] [Google Scholar]
- 2. Khan N, Mukhtar H. Tea polyphenols in promotion of human health. Nutrients. 2018;11:39. [DOI] [PMC free article] [PubMed] [Google Scholar]
- 3. Xing L, Zhang H, Qi R. et al. Recent advances in the understanding of the health benefits and molecular mechanisms associated with green tea polyphenols. J Agric Food Chem. 2019;67:1029–43. [DOI] [PubMed] [Google Scholar]
- 4. Yang CS, Wang X, Lu G. et al. Cancer prevention by tea: animal studies, molecular mechanisms and human relevance. Nat Rev Cancer. 2009;9:429–39. [DOI] [PMC free article] [PubMed] [Google Scholar]
- 5. Baliga MS, Meleth S, Katiyar SK. Growth inhibitory and antimetastatic effect of green tea polyphenols on metastasis-specific mouse mammary carcinoma 4T1 cells in vitro and in vivo systems. Clin Cancer Res. 2005;11:1918–27. [DOI] [PubMed] [Google Scholar]
- 6. Gupta S, Hastak K, Ahmad N. et al. Inhibition of prostate carcinogenesis in TRAMP mice by oral infusion of green tea polyphenols. Proc Natl Acad Sci USA. 2001;98:10350–5. [DOI] [PMC free article] [PubMed] [Google Scholar]
- 7. Singh HP, Ravindranath SD, Singh C. Analysis of tea shoot catechins: spectrophotometric quantitation and selective visualization on two-dimensional paper chromatograms using diazotized sulfanilamide. J Agric Food Chem. 1999;47:1041–5. [DOI] [PubMed] [Google Scholar]
- 8. Punyasiri PA, Abeysinghe ISB, Kumar V. et al. Flavonoid biosynthesis in the tea plant Camellia sinensis: properties of enzymes of the prominent epicatechin and catechin pathways. Arch Biochem Biophys. 2004;431:22–30. [DOI] [PubMed] [Google Scholar]
- 9. Wu LY, Fang ZT, Lin JK. et al. Complementary iTRAQ proteomic and transcriptomic analyses of leaves in tea plant (Camellia sinensis L.) with different maturity and regulatory network of flavonoid biosynthesis. J Proteome Res. 2019;18:252–64. [DOI] [PubMed] [Google Scholar]
- 10. Rani A, Singh K, Ahuja PS. et al. Molecular regulation of catechins biosynthesis in tea [Camellia sinensis (L.) O. Kuntze]. Gene. 2012;495:205–10. [DOI] [PubMed] [Google Scholar]
- 11. Wu ZJ, Li XH, Liu ZW. et al. De novo assembly and transcriptome characterization: novel insights into catechins biosynthesis in Camellia sinensis. BMC Plant Biol. 2014;14:277. [DOI] [PMC free article] [PubMed] [Google Scholar]
- 12. Wang P, Zhang L, Jiang X. et al. Evolutionary and functional characterization of leucoanthocyanidin reductases from Camellia sinensis. Planta. 2018;247:139–54. [DOI] [PMC free article] [PubMed] [Google Scholar]
- 13. Zhang LQ, Wei K, Cheng H. et al. Accumulation of catechins and expression of catechin synthetic genes in Camellia sinensis at different developmental stages. Bot Stud. 2016;57:31. [DOI] [PMC free article] [PubMed] [Google Scholar]
- 14. Wang P, Liu Y, Zhang L. et al. Functional demonstration of plant flavonoid carbocations proposed to be involved in the biosynthesis of proanthocyanidins. Plant J. 2020;101:18–36. [DOI] [PubMed] [Google Scholar]
- 15. Wang W, Zhou Y, Wu Y. et al. Insight into catechins metabolic pathways of Camellia sinensis based on genome and transcriptome analysis. J Agric Food Chem. 2018;66:4281–93. [DOI] [PubMed] [Google Scholar]
- 16. Nesi N, Jond C, Debeaujon I. et al. The Arabidopsis TT2 gene encodes an R2R3 MYB domain protein that acts as a key determinant for proanthocyanidin accumulation in developing seed. Plant Cell. 2001;13:2099–114. [DOI] [PMC free article] [PubMed] [Google Scholar]
- 17. Bogs J, Jaffe FW, Takos AM. et al. The grapevine transcription factor VvMYBPA1 regulates proanthocyanidin synthesis during fruit development. Plant Physiol. 2007;143:1347–61. [DOI] [PMC free article] [PubMed] [Google Scholar]
- 18. Liu C, Jun JH, Dixon RA. MYB5 and MYB14 play pivotal roles in seed coat polymer biosynthesis in Medicago truncatula. Plant Physiol. 2014;165:1424–39. [DOI] [PMC free article] [PubMed] [Google Scholar]
- 19. Wei K, Wang L, Zhang Y. et al. A coupled role for CsMYB75 and CsGSTF1 in anthocyanin hyperaccumulation in purple tea. Plant J. 2019;97:825–40. [DOI] [PubMed] [Google Scholar]
- 20. Xie DY, Sharma SB, Wright E. et al. Metabolic engineering of proanthocyanidins through co-expression of anthocyanidin reductase and the PAP1 MYB transcription factor. Plant J. 2006;45:895–907. [DOI] [PubMed] [Google Scholar]
- 21. Iwasa K. Physiological aspects of catechin biosynthesis in tea plants. Jpn Agric Res Q. 1976;10:89–93. [Google Scholar]
- 22. Saijo R. Effect of shade treatment on biosynthesis of catechins in tea plants. Plant Cell Physiol. 1980;21:989–98. [Google Scholar]
- 23. Liu L, Li Y, She G. et al. Metabolite profiling and transcriptomic analyses reveal an essential role of UVR8-mediated signal transduction pathway in regulating flavonoid biosynthesis in tea plants (Camellia sinensis) in response to shading. BMC Plant Biol. 2018;18:233. [DOI] [PMC free article] [PubMed] [Google Scholar]
- 24. Rossini L, Cribb L, Martin DJ. et al. The maize Golden2 gene defines a novel class of transcriptional regulators in plants. Plant Cell. 2001;13:1231–44. [DOI] [PMC free article] [PubMed] [Google Scholar]
- 25. Fitter DW, Martin DJ, Copley MJ. et al. GLK gene pairs regulate chloroplast development in diverse plant species. Plant J. 2002;31:713–27. [DOI] [PubMed] [Google Scholar]
- 26. Waters MT, Wang P, Korkaric M. et al. GLK transcription factors coordinate expression of the photosynthetic apparatus in Arabidopsis. Plant Cell. 2009;21:1109–28. [DOI] [PMC free article] [PubMed] [Google Scholar]
- 27. Nakamura H, Muramatsu M, Hakata M. et al. Ectopic overexpression of the transcription factor OsGLK1 induces chloroplast development in non-green rice cells. Plant Cell Physiol. 2009;50:1933–49. [DOI] [PMC free article] [PubMed] [Google Scholar]
- 28. Bravo-Garcia A, Yasumura Y, Langdale JA. Specialization of the Golden2-like regulatory pathway during land plant evolution. New Phytol. 2009;183:133–41. [DOI] [PubMed] [Google Scholar]
- 29. Brand A, Borovsky Y, Hill T. et al. CaGLK2 regulates natural variation of chlorophyll content and fruit color in pepper fruit. Theor Appl Genet. 2014;127:2139–48. [DOI] [PubMed] [Google Scholar]
- 30. Powell AL, Nguyen CV, Hill T. et al. Uniform ripening encodes a Golden 2-like transcription factor regulating tomato fruit chloroplast development. Science. 2012;336:1711–5. [DOI] [PubMed] [Google Scholar]
- 31. Nguyen CV, Vrebalov JT, Gapper NE. et al. Tomato GOLDEN2-LIKE transcription factors reveal molecular gradients that function during fruit development and ripening. Plant Cell. 2014;26:585–601. [DOI] [PMC free article] [PubMed] [Google Scholar]
- 32. Li G, Chen D, Tang X. et al. Heterologous expression of kiwifruit (Actinidia chinensis) GOLDEN2-LIKE homolog elevates chloroplast level and nutritional quality in tomato (Solanum lycopersicum). Planta. 2018;247:1351–62. [DOI] [PubMed] [Google Scholar]
- 33. Yasumura Y, Moylan EC, Langdale JA. A conserved transcription factor mediates nuclear control of organelle biogenesis in anciently diverged land plants. Plant Cell. 2005;17:1894–907. [DOI] [PMC free article] [PubMed] [Google Scholar]
- 34. Liu Y, Roof S, Ye Z. et al. Manipulation of light signal transduction as a means of modifying fruit nutritional quality in tomato. Proc Natl Acad Sci USA. 2004;101:9897–902. [DOI] [PMC free article] [PubMed] [Google Scholar]
- 35. Mustilli AC, Fenzi F, Ciliento R. et al. Phenotype of the tomato high pigment-2 mutant is caused by a mutation in the tomato homolog of DEETIOLATED1. Plant Cell. 1999;11:145–57. [DOI] [PMC free article] [PubMed] [Google Scholar]
- 36. Zhang D, Tan W, Yang F. et al. A BIN2-GLK1 signaling module integrates brassinosteroid and light signaling to repress chloroplast development in the dark. Dev Cell. 2021;56:310–324.e7. [DOI] [PubMed] [Google Scholar]
- 37. Tang X, Miao M, Niu X. et al. Ubiquitin-conjugated degradation of golden 2-like transcription factor is mediated by CUL4-DDB1-based E3 ligase complex in tomato. New Phytol. 2016;209:1028–39. [DOI] [PubMed] [Google Scholar]
- 38. Schroeder DF, Gahrtz M, Maxwell BB. et al. De-etiolated 1 and damaged DNA binding protein 1 interact to regulate Arabidopsis photomorphogenesis. Curr Biol. 2002;12:1462–72. [DOI] [PubMed] [Google Scholar]
- 39. Wang S, Liu J, Feng Y. et al. Altered plastid levels and potential for improved fruit nutrient content by downregulation of the tomato DDB1-interacting protein CUL4. Plant J. 2008;55:89–103. [DOI] [PubMed] [Google Scholar]
- 40. Li H, Li Y, Deng H. et al. Tomato UV-B receptor SlUVR8 mediates plant acclimation to UV-B radiation and enhances fruit chloroplast development via regulating SlGLK2. Sci Rep. 2018;8:6097. [DOI] [PMC free article] [PubMed] [Google Scholar]
- 41. Wei C, Yang H, Wang S. et al. Draft genome sequence of Camellia sinensis var. sinensis provides insights into the evolution of the tea genome and tea quality. Proc Natl Acad Sci USA. 2018;115:E4151–8. [DOI] [PMC free article] [PubMed] [Google Scholar]
- 42. Jiang X, Huang K, Zheng G. et al. CsMYB5a and CsMYB5e from Camellia sinensis differentially regulate anthocyanin and proanthocyanidin biosynthesis. Plant Sci. 2018;270:209–20. [DOI] [PubMed] [Google Scholar]
- 43. Zhao M, Zhang N, Gao T. et al. Sesquiterpene glucosylation mediated by glucosyltransferase UGT91Q2 is involved in the modulation of cold stress tolerance in tea plants. New Phytol. 2020;226:362–72. [DOI] [PubMed] [Google Scholar]
- 44. Muir SR, Collins GJ, Robinson S. et al. Overexpression of petunia chalcone isomerase in tomato results in fruit containing increased levels of flavonols. Nat Biotechnol. 2001;19:470–4. [DOI] [PubMed] [Google Scholar]
- 45. Butelli E, Titta L, Giorgio M. et al. Enrichment of tomato fruit with health-promoting anthocyanins by expression of select transcription factors. Nat Biotechnol. 2008;26:1301–8. [DOI] [PubMed] [Google Scholar]
- 46. Kumar S, Pandey AK. Chemistry and biological activities of flavonoids: an overview. Sci World Journal. 2013;2013:162750. [DOI] [PMC free article] [PubMed] [Google Scholar]
- 47. Bino RJ, Ric de Vos CH, Lieberman M. et al. The light-hyperresponsive high pigment-2dg mutation of tomato: alterations in the fruit metabolome. New Phytol. 2005;166:427–38. [DOI] [PubMed] [Google Scholar]
- 48. Davuluri GR, Tuinen A, Fraser PD. et al. Fruit-specific RNAi-mediated suppression of DET1 enhances carotenoid and flavonoid content in tomatoes. Nat Biotechnol. 2005;23:890–5. [DOI] [PMC free article] [PubMed] [Google Scholar]
- 49. Sun C, Deng L, Du M. et al. A transcriptional network promotes anthocyanin biosynthesis in tomato flesh. Mol Plant. 2020;13:42–58. [DOI] [PubMed] [Google Scholar]
- 50. Yan S, Chen N, Huang Z. et al. Anthocyanin fruit encodes an R2R3-MYB transcription factor, SlAN2-like, activating the transcription of SlMYBATV to fine-tune anthocyanin content in tomato fruit. New Phytol. 2020;225:2048–63. [DOI] [PubMed] [Google Scholar]
- 51. Zhang Q, Liu M, Ruan J. Metabolomics analysis reveals the metabolic and functional roles of flavonoids in light-sensitive tea leaves. BMC Plant Biol. 2017;17:64. [DOI] [PMC free article] [PubMed] [Google Scholar]
- 52. Zheng C, Ma JQ, Ma CL. et al. Regulation of growth and flavonoid formation of tea plants (Camellia sinensis) by blue and green light. J Agric Food Chem. 2019;67:2408–19. [DOI] [PubMed] [Google Scholar]
- 53. Wang P, Chen S, Gu M. et al. Exploration of the effects of different blue LED light intensities on flavonoid and lipid metabolism in tea plants via transcriptomics and metabolomics. Int J Mol Sci 2020;21:4606. [DOI] [PMC free article] [PubMed] [Google Scholar]
- 54. Lu Z, Liu Y, Zhao L. et al. Effect of low-intensity white light mediated de-etiolation on the biosynthesis of polyphenols in tea seedlings. Plant Physiol Biochem. 2014;80:328–36. [DOI] [PubMed] [Google Scholar]
- 55. Howles PA, Sewalt VJH, Paiva NL. et al. Overexpression of L-phenylalanine ammonia-lyase in transgenic tobacco plants reveals control points for flux into phenylpropanoid biosynthesis. Plant Physiol. 1996;112:1617–24. [DOI] [PMC free article] [PubMed] [Google Scholar]
- 56. Tanner GJ, Francki KT, Abrahams S. et al. Proanthocyanidin biosynthesis in plants. J Biol Chem. 2003;278:31647–56. [DOI] [PubMed] [Google Scholar]
- 57. Xie DY, Sharma SB, Paiva NL. et al. Role of anthocyanidin reductase, encoded by BANYULS in plant flavonoid biosynthesis. Science. 2003;299:396–9. [DOI] [PubMed] [Google Scholar]
- 58. Laloi C, Stackhowiack M, Pers-Kamczyc E. Cross-talk between singlet oxygen- and hydrogen peroxide-dependent signaling of stress responses in Arabidopsis thaliana. Proc Natl Acad Sci USA. 2007;104:672–7. [DOI] [PMC free article] [PubMed] [Google Scholar]
- 59. Asada K. The water-water cycle in chloroplasts: scavenging of active oxygens and dissipation of excess photons. Annu Rev Plant Physiol Plant Mol Biol. 1999;50:601–39. [DOI] [PubMed] [Google Scholar]
- 60. Asada K. Production and scavenging of reactive oxygen species in chloroplasts and their functions. Plant Physiol. 2006;141:391–6. [DOI] [PMC free article] [PubMed] [Google Scholar]
- 61. Shapiguzov A, Vainonen JP, Wrzaczek M. et al. ROS-talk – how the apoplast, the chloroplast, and the nucleus get the message through. Front Plant Sci. 2012;3:292. [DOI] [PMC free article] [PubMed] [Google Scholar]
- 62. Winkel-Shirley B. Biosynthesis of flavonoids and effects of stress. Curr Opin Plant Biol. 2002;5:218–23. [DOI] [PubMed] [Google Scholar]
- 63. Bernatoniene J, Kopustinskiene DM. The role of catechins in cellular responses to oxidative stress. Molecules. 2018;23:965. [DOI] [PMC free article] [PubMed] [Google Scholar]
- 64. Livak KJ, Schmittgen TD. Analysis of relative gene expression data using real-time quantitative PCR and the 2(-Delta Delta C(T)) method. Methods. 2001;25:402–8. [DOI] [PubMed] [Google Scholar]
- 65. Want EJ, Wilson ID, Gika H. et al. Global metabolic profiling procedures for urine using UPLC-MS. Nat Protoc. 2010;5:1005–18. [DOI] [PubMed] [Google Scholar]
- 66. Wang L, Tang W, Hu Y. et al. A MYB/bHLH complex regulates tissue-specific anthocyanin biosynthesis in the inner pericarp of red-centered kiwifruit Actinidia chinensis cv. Hongyang. Plant J. 2019;99:359–78. [DOI] [PubMed] [Google Scholar]
- 67. Li Y, Deng H, Miao M. et al. Tomato MBD5, a methyl CpG binding domain protein, physically interacting with UV-damaged DNA binding protein-1, functions in multiple processes. New Phytol2016;210:208–26. [DOI] [PubMed] [Google Scholar]
Associated Data
This section collects any data citations, data availability statements, or supplementary materials included in this article.
Supplementary Materials
Data Availability Statement
All data generated from the study appear in the submitted article.