Abstract
Background
The treatment of lung adenocarcinoma (LUAD) has been stuck in a bottleneck due to a number of factors. There is a pressing need for research into potential genetic markers to help drug development and improve the prognosis of patients. SLC2A1 has been reported in multiple LUAD-related prognosis prediction signatures. However, the role of SLC2A1 in the occurrence and development of LUAD and its impact on prognosis remain elusive.
Methods
The Cancer Genome Atlas (TCGA) and Gene Expression Omnibus (GEO) were used to acquire the samples. We used R to perform statistical analysis, Gene Set Enrichment Analysis (GSEA), immune infiltration and immune cell correlation analysis, drug sensitivity analysis, and visualization. The immune cell score was calculated using the Timer2.0 database. Prognostic analysis was performed using R, Gene Expression Profiling Interactive Analysis (GEPIA), and the Kaplan-Meier Plotter. Overall survival and progression free survival were the main outcome of prognosis analysis. Protein-protein interaction, disease-genetics analysis, and tissue-specific enrichment analyses were performed using Metascape.
Results
SLC2A1 was highly expressed in LUAD tissues. Univariate COX regression [hazard ratio (HR) =1.689, 95% confidence interval (CI): 1.242–2.249, P<0.001] and multivariate COX regression including age, gender, smoking, TNM stage and SLC2A1 expression (HR =1.567, 95% CI: 1.127–2.179, P=0.008) showed that SLC2A1 was an independent prognostic risk factor for LUAD. GSEA and Metascape analysis showed that SLC2A1 was strongly associated with the cell cycle, mitosis, lung tissue, and tumor recurrence. Immune correlation analysis showed that SLC2A1 was associated with two tumor infiltration immune cells: activated CD (cluster of differentiation)4+ memory T cells (r=0.31, P=0.003) and activated mast cells (r=−0.28, P=0.010). Moreover, patients with high SLC2A1 expression had higher immune checkpoint molecules and Tumor Immune Dysfunction and Exclusion (TIDE) scores, indicating poorer immunotherapy efficacy. Patients with high SLC2A1 expression were more sensitive to chemotherapy drugs and less sensitive to targeted drugs compared to those with low SLC2A1 expression.
Conclusions
The high expression of SLC2A1 in LUAD predicted poor prognosis and was closely related to tumor immunity, which could be used as an effective prognostic biomarker to provide a new strategy for clinical prognosis assessment and immunotherapy for LUAD.
Keywords: SLC2A1, lung adenocarcinoma (LUAD), prognosis, tumor-infiltrating immune cells (TIICs), immunotherapy
Introduction
Lung cancer remains the leading cause of cancer-related death worldwide, with an estimated 5-year relative survival rate of 21% in 2021 (1). Lung adenocarcinoma (LUAD) is the most common pathological subtype of lung cancer, accounting for 40% of lung cancer cases (2). In recent years, with the development of targeted therapy and immunotherapy, the treatment of LUAD has gradually entered the era of precision therapy (3,4). However, the treatment of LUAD has been stuck in a bottleneck due to a number of factors, such as the improvement of anti-tumor drug resistance (5,6). In addition to the currently known genetic biomarkers (such as driver genes), there are many undiscovered genetic changes that may play important roles in the occurrence and development of LUAD. Therefore, there is a pressing need for research into potential genetic markers to help drug development and improve the prognosis of patients.
Solute carrier (SLC) transporters are a family of more than 300 membrane-bound proteins that play an important role in the absorption of various nutrients and drugs by cells (7). SLC2A1 is a member of the SLC transporter family, which has been reported in multiple LUAD-related prognosis prediction signatures (8-10). Recent study (11) has shown that SLC2A1 has prognostic significance in patients with LUAD after surgical resection. However, as a single gene, the role of SLC2A1 in the occurrence and development of LUAD and its impact on prognosis remain elusive. As more and more attention has been paid to the role of tumor immune microenvironment and tumor immune infiltrating cells (TIICs), the role of SLC2A1 in lung adenocarcinoma tumor immunity is still unclear.
According to our previous studies, we found that the expression of SLC2A1 was correlated with the prognosis of patients with LUAD. On this basis, we want to further explore the role of SLC2A1 in the occurrence and development of and tumor immunity of LUAD based on bioinformatics methods, so as to provide new targets for molecular targeted therapy and immunotherapy of LUAD. We present the following article in accordance with the REMARK reporting checklist (available at https://atm.amegroups.com/article/view/10.21037/atm-22-1430/rc).
Methods
In this study, we explored the expression of SLC2A1 in LUAD and its prognostic value in LUAD patients based on TCGA (The Cancer Genome Atlas) and GEO (Gene Expression Omnibus) databases. We analyzed the differential expression network of SLC2A1 and the possible mechanism of its impact on the prognosis of LUAD through multi-dimensional analysis. We also analyzed the correlation between SLC2A1 expression and tumor immune infiltration, as well as the role of SLC2A1 in guiding immunotherapy decisions. Furthermore, the relationship between SLC2A1 expression and the drug sensitivity of LUAD was also explored. Our study comprehensively verified the potential role of SLC2A1 in LUAD, which may provide a new biomarker for the treatment and prognostic assessment of LUAD patients, and provide new suggestions for clinical decision-making. The study was conducted in accordance with the Declaration of Helsinki (as revised in 2013).
Data collection and pretreatment
The datasets used in the current research were acquired from TCGA (https://portal.gdc.cancer.gov/) and GEO (https://www.ncbi.nlm.nih.gov/geo/). The RNA (Ribonucleic Acid) sequencing FPKM (Fragments Per Kilobase of exon model per Million mapped fragments) data of 11,093 pan-cancer samples were downloaded from TCGA-ALL. The RNA sequencing counts data and FPKM data of 535 tumor samples of LUAD and the corresponding clinical information were downloaded from TCGA-LUAD. There were a total 486 tumor samples with complete information on age, gender, smoking, TNM (Tumor Node Metastasis) stage, vital status, and overall survival (OS) time.
Additionally, the microarray data of LUAD of four datasets [GSE118370 (n=12), GSE140797 (n=14), GSE32863 (n=116), GSE40275 (n=84)] were downloaded from the GEO database for validation. The extracted data were normalized and processed by log2 transformation, and the data were normalized using the “preprocessCore” package (12) in R software (version 4.1.0, Copyright (C) 2021 The R Foundation for Statistical Computing). The Remove Batch Effect function in “limma” package (13) in R was used to remove batch effect and combine the four datasets, and the removal of batch effect was evaluated by comparing the visual PCA (Principle Component Analysis) diagram before and after batch removal. There were a total of 79 tumor samples and 114 normal lung tissue samples in the combined GEO datasets. Additionally, the high throughput sequencing data of GSE40419 was acquired from the GEO database for immune-related analysis. There were 87 tumor samples and 77 adjacent normal lung tissue samples in the GSE40419 dataset.
Differential expression analysis of SLC2A1
The differential expression difference analysis and visualization of SLC2A1 between tumor and normal tissues in pan-cancer and LUAD were analyzed using basic R package and “ggplot2” package (14) in R software. Subsequently, the TCGA samples were divided into a “high” and “low” group according to the expression of SLC2A1, and the cutoff value was the median expression value of SLC2A1. Baseline data tables describing the relationship between SLC2A1 expression and various clinical information were drawn using the basic package in R. “Limma” package in R was used to study the differential expression of mRNAs (message RNAs) between the two groups. The adjusted P value was analyzed to correct for false positive results. “Adjusted P<0.05 and Log(Fold Change) >1 or Log(Fold Change) <−1” were defined as the thresholds for screening the differential expression of mRNAs. A Volcano plot and cluster heatmap were constructed using “gglot2” package in R to visualize the differential analysis results.
Prognosis-related analysis
The Gene Expression Profiling Interactive Analysis (GEPIA) (15) and Kaplan-Meier Plotter (16) website tools were applied to construct survival curve and evaluate the prognostic potential of SLC2A1 in LUAD. The “median value“ of SLC2A1 expression was selected as the cutoff value in GEPIA for grouping, and the survival curves of all samples in both two groups were drawn with OS (overall survival) and PFS (progression free survival) as the end points, respectively. The same grouping was constructed using the Kaplan-Meier Plotter, and the survival curves of all samples and each clinical subgroup of the two groups were drawn with OS and PFS as the end points, respectively. In addition, univariate and multivariate Cox analyses were performed on SLC2A1 and the clinical characteristics to assess the potential independent prognostic value of SLC2A1 in LUAD using “glmnet” and “survival” packages (17,18) in R. The clinical characteristics of age, sex, smoking history and TNM stage were included in consideration of common clinical use and complete acquired data.
Gene Set Enrichment Analysis (GSEA) and Metascape annotation Analysis
GSEA was performed to further confirm the underlying function and obtain the relevant signaling pathways of SLC2A1-related differential expression genes in LUAD using “clusterProfiler” package (19) in R. The hallmark gene sets from GSEA-MSigDb (http://www.gsea-msigdb.org) were selected to conduct the GSEA. Gene Ontology (GO) and Kyoto Encyclopedia of Genes and Genomes (KEGG) enrichment analyses were also included. Metascape (https://metascape.org) (20) was used to perform the protein-protein interaction (PPI) enrichment analysis and disease-genetics analysis enrichment and tissue-specific enrichment analysis.
Tumor immune-related analysis
To investigate the role of SLC2A1 in LUAD tumor immunity and its relationship with infiltrating immune cells, the “CIBERSORT” algorithm from the “immunedeconv” package (21) in R was used to calculate the immune-infiltrating score of TCGA samples. A heatmap was drawn to visualize the immune scores of the high and low SLC2A1 expression groups, and the basic R package was then used to calculate whether there were significant differences in the immune-infiltration scores of 22 immune cells included in CIBERSORT between the two groups. Additionally, TIMER2.0 (http://timer.comp-genomics.org) (22) was used to calculate the immune-infiltrating score of GSE40419 tumor samples (n=87), and the “ggstatsplot” package (23) in R was applied to conduct the correlation analysis between SLC2A1 and immune cells, in order to validate the “CIBERSORT” analysis results. SIGLEC15, TIGIT, CD274, HAVCR2, PDCD1, CTLA4, LAG3, and PDCD1LG2 are immune checkpoint-related transcripts (24-27). The expression values of these eight genes were extracted to observe the expression of immune checkpoint-related genes in the high and low SLC2A1 expression groups based on the TCGA samples. Also, the Tumor Immune Dysfunction and Exclusion (TIDE) algorithm (28) was used to predict the response of the high and low SLC2A1 expression groups to Immune-checkpoint-blocking (ICB) based on the TCGA samples.
Drug sensitivity analysis
The “pRRophetic” package (29) in R was used to assess the sensitivity of the high and low SLC2A1 expression groups to eight LUAD drugs included in the Cancer Genome Project (CGP) database (version cgp2016), including six chemotherapeutic drugs and two targeted drugs. The “ggplot2” package in R was applied to visualize the results, and TCGA samples were used to perform this analysis. In order to determine whether the relationship between SLC2A1 expression and sensitivity to targeted drugs is affected by differences in driver gene mutations, we used the “mafftools“ package (30) in R to analyze the somatic mutations of patients. Using SPSS (version 26.0.0.0©, Copyright IBM Corporation 2021), we compared the high and low SLC2A1 expression groups to assess whether there were differences in the LUAD driver gene mutation frequency between both groups of patients.
Statistical analysis
The driver gene mutation frequency differences between the high and low SLC2A1 expression groups were assessed using SPSS (version 26.0.0.0), and the other statistical analyses were performed in R software (version 4.1.0) (except for the online website tools mentioned above). The correlation analysis between SLC2A1 expression and immune-infiltrating cells was assessed using the Pearson correlation coefficient. For all analyses, the low and high SLC2A1 expression groups were established according to the median SLC2A1 mRNA expression value in the selected dataset.
In the univariate and multivariate Cox regression analyses, SLC2A1 was also divided into two grade variables “high” and “low” according to the median value. The paired t-test was used to compare the SLC2A1 expression levels in TCGA tumor and pan-cancer paired samples. Pearson’s chi-squared test was applied to analyze the differences in driver gene mutation frequency between the high and low SLC2A1 expression groups (*P<0.05, **P<0.01, and ***P<0.001). All differences between groups (except those mentioned above) were analyzed using the unpaired t-test. P<0.05 (two-sided) was considered significant in all tests.
Results
SLC2A1 was highly expressed in LUAD tissues
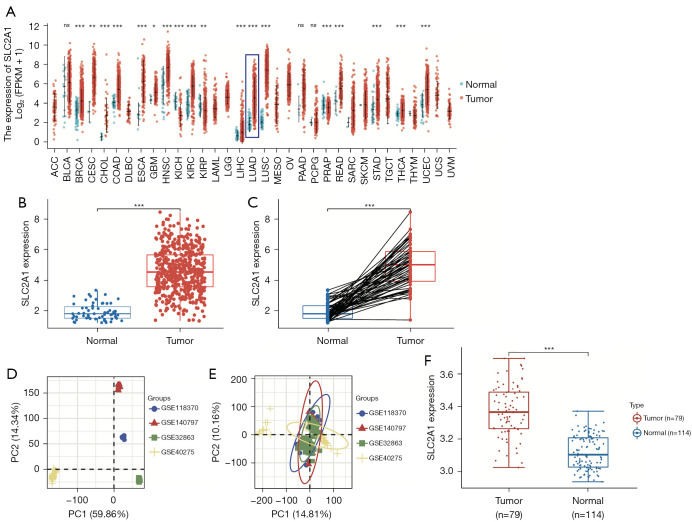
By analyzing the expression of SLC2A1 in the pan-cancer dataset included in TCGA database, we obtained the expression differences of SLC2A1 in 33 cancers and the corresponding normal tissues (Figure 1A). The results showed that SLC2A1 was significantly highly expressed in LUAD. The expression differential analysis results in the TCGA-LUAD dataset showed that the expression level of SLC2A1 in LUAD tissues was higher than that in their adjacent tissues using both unpaired and paired sample t-tests (Figure 1B,1C).
Figure 1.
SLC2A1 was highly expressed in LUAD tissues. (A) The expression differences of SLC2A1 in 33 cancers and the corresponding normal tissues; (B) the expression level of SLC2A1 in LUAD tissues was higher than that in their adjacent tissues using unpaired sample t-test in TCGA data; (C) the expression level of SLC2A1 in LUAD tissues was higher than that in their adjacent tissues using paired sample t-test in TCGA data; (D) the PCA diagram of the four GEO datasets before batch removal; (E) the PCA diagram of the four GEO datasets after batch removal; (F) SLC2A1 was more highly expressed in transcriptional levels in LUAD tissues than in normal lung tissues in the GEO data. *, P<0.05; **, P<0.01; ***, P<0.001; ns, P>0.05. LUAD, lung adenocarcinoma; LUSC, lung squamous cell carcinoma; TCGA, The Cancer Genome Atlas; GEO, Gene Expression Omnibus; PCA, principal components analysis.
The combined GEO data obtained was then used for the same analysis for a validation, and the results were consistent with those in TCGA data (Figure 1D-1F). This indicated that SLC2A1 was more highly expressed in transcriptional levels in LUAD tissues than in normal lung tissues.
Overexpression of SLC2A1 indicated poor prognosis in LUAD
To explore the correlation between SLC2A1 and the clinical phenotype of LUAD, we analyzed the expression of SLC2A1 in each clinical subgroup of the TCGA-LUAD dataset (Table 1). The results showed that SLC2A1 expression was significantly associated with T stage classification (P<0.001), N stage classification (P=0.015), TNM stage classification (P=0.002), gender (P=0.004), OS (P<0.001), and DSS (Disease Specific Survival) (P<0.001).
Table 1. The expression of SLC2A1 in each clinical subgroup of the TCGA-LUAD dataset.
| Characteristic | Low SLC2A1 expression (n=267) | High SLC2A1 expression (n=268) | P value |
|---|---|---|---|
| T stage, n (%) | <0.001 | ||
| T1 | 108 (20.3) | 67 (12.6) | |
| T2 | 133 (25.0) | 156 (29.3) | |
| T3 | 14 (2.6) | 35 (6.6) | |
| T4 | 10 (1.9) | 9 (1.7) | |
| N stage, n (%) | 0.015 | ||
| N0 | 186 (35.8) | 162 (31.2) | |
| N1 | 38 (7.3) | 57 (11.0) | |
| N2 | 30 (5.8) | 44 (8.5) | |
| N3 | 0 (0) | 2 (0.4) | |
| M stage, n (%) | 0.225 | ||
| M0 | 183 (47.4) | 178 (46.1) | |
| M1 | 9 (2.3) | 16 (4.1) | |
| Pathologic stage, n (%) | 0.002 | ||
| Stage I | 168 (31.9) | 126 (23.9) | |
| Stage II | 51 (9.7) | 72 (13.7) | |
| Stage III | 33 (6.3) | 51 (9.7) | |
| Stage IV | 10 (1.9) | 16 (3.0) | |
| Gender, n (%) | 0.004 | ||
| Female | 160 (29.9) | 126 (23.6) | |
| Male | 107 (20.0) | 142 (26.5) | |
| OS event, n (%) | <0.001 | ||
| Alive | 193 (36.1) | 150 (28.0) | |
| Dead | 74 (13.8) | 118 (22.1) | |
| DSS event, n (%) | <0.001 | ||
| Alive | 208 (41.7) | 171 (34.3) | |
| Dead | 43 (8.6) | 77 (15.4) | |
| PFS event, n (%) | 0.007 | ||
| Alive | 170 (31.8) | 139 (26.0) | |
| Dead | 97 (18.1) | 129 (24.1) | |
| Age, median [IQR] | 67 [60, 73] | 65 [58, 72] | 0.135 |
T, tumor; N, node; M, metastasis; TCGA, The Cancer Genome Atlas; LUAD, lung adenocarcinoma; OS, overall survival; DSS, disease specific survival; PFS, progression free survival; IQR, interquartile range.
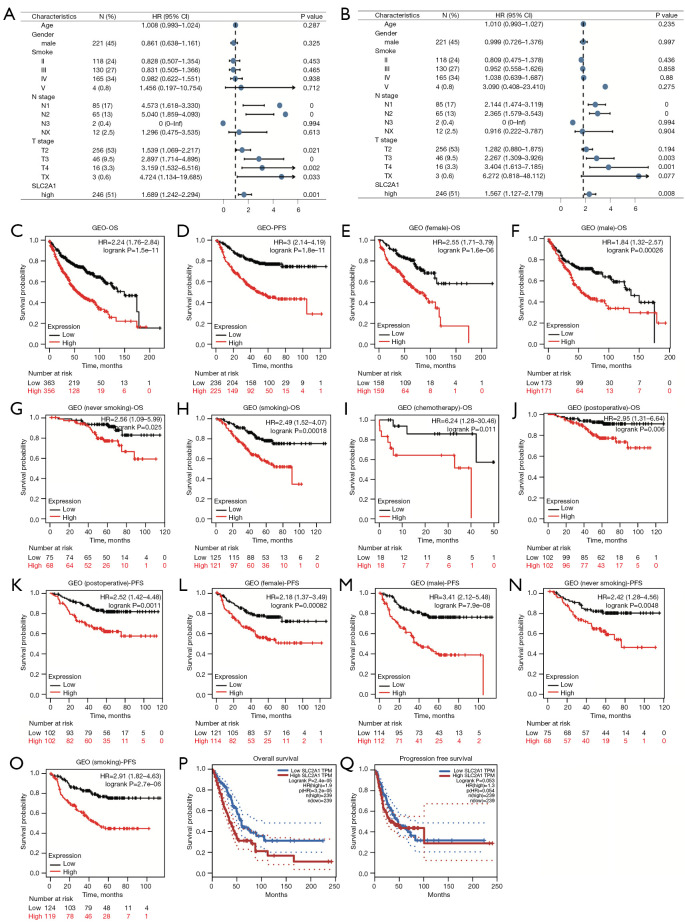
To further confirm the role of SLC2A1 in the prognosis of LUAD, univariate and multivariate Cox regression analyses were performed. The results showed that high SLC2A1 expression was associated with poorer prognosis in both univariate [HR (hazard ratio) (high vs. low) =1.689, 95% confidence interval (CI): 1.242–2.249, P<0.001] and multivariate [HR (high vs. low) =1.567, 95% CI: 1.127–2.179, P=0.008] regression in LUAD (Figure 2A,2B).
Figure 2.
Overexpression of SLC2A1 indicated poor prognosis in LUAD. (A) Forest plots with univariate Cox regression for SLC2A1 and clinical factors; (B) Forest plots with multivariate Cox regression incorporating SLC2A1 and clinical factors; (C-O) high expression of SLC2A1 predicted poor OS and PFS in both the overall samples and each subgroup samples in the Kaplan-Meier Plotter; (P) the high SLC2A1 expression group had significantly worse OS than the low SLC2A1 expression group in GEPIA; (Q) the PFS of the two groups did not exhibit significant differences in the logrank test by GEPIA. LUAD, lung adenocarcinoma; OS, overall survival; PFS, progression free survival; GEPIA, Gene Expression Profiling Interactive Analysis.
In order to more intuitively understand the relationship between SLC2A1 and the survival of LUAD patients, GEPIA and the Kaplan-Meier Plotter were used to draw the survival curves of the high and low SLC2A1 expression groups. GEPIA used TCGA-LUAD dataset, while the Kaplan-Meier Plotter used data from the site’s own pre-processed GEO database. In the Kaplan-Meier Plotter, patients in the high and low SLC2A1 expression groups exhibited significant differences in OS and PFS (Figure 2C,2D). In addition, we also compared the OS and PFS of the two groups in various clinical subgroups, such as male, female, smoking, non-smoking, postoperative, and post-chemotherapy, and the results showed that high SLC2A1 expression predicted poor prognosis in both the overall samples as well as the samples of each subgroup (Figure 2C-2O). GEPIA survival analysis showed that the high SLC2A1 expression group had significantly worse OS than the low expression group (HR =1.9, logrank P=2.4e-05) (Figure 2P). However, through GEPIA, we found that the PFS of the two groups were not significantly different in the logrank test (logrank P=0.053) (Figure 2Q). Based on these results, we concluded that SLC2A1 expression is significantly related to the progression and survival of LUAD.
Functional enrichment analysis and PPI network of SLC2A1-related differential genes
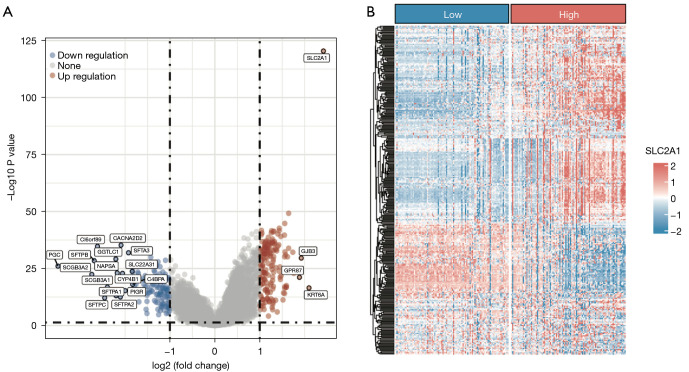
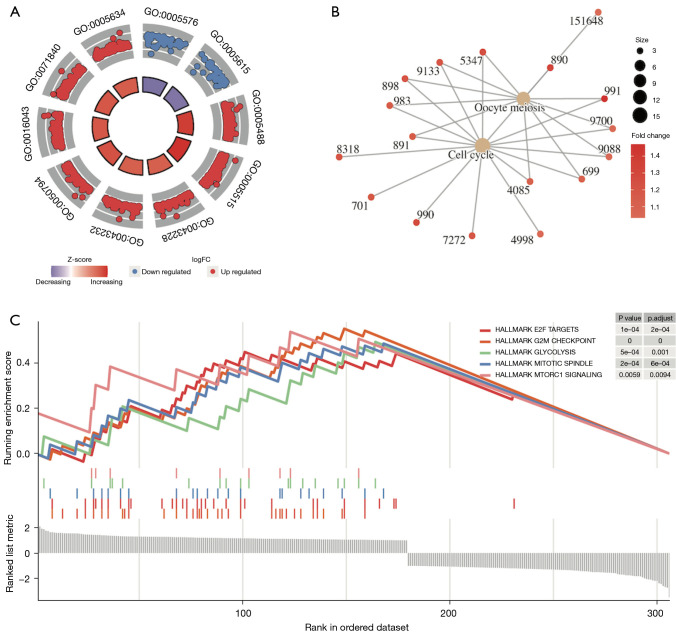
Analysis of the gene expression differences between the high and low SLC2A1 expression groups in TCGA-LUAD showed that 306 genes exhibited significant expression differences [adj. P<0.05, abs (log2FC(Fold Change)) >1], among which 179 genes were highly expressed and 127 genes were lowly expressed in the high SLC2A1 group (Figure 3A, Figure S1). The difference analysis results are reported in detail in Table S1. We drew the expression heatmap of these 306 genes from the GEO data, and the results showed that there were significant differences in the expression of these genes in the high and low SLC2A1 expression groups, which verified the results of TCGA data analysis (Figure 3B). Furthermore, GSEA showed that these 306 SLC2A1-related genes were closely related to the basic cellular activities (Figure 4A-4C, Table 2, Tables S2-S4). In terms of cellular components (CC), we found that these SLC2A1-related differential genes were primarily enriched in the extracellular region, intracellular anatomical structure, organelles, and nucleus. As for biological processes (BP), these genes were enriched in the cellular component organization, or more specifically, the cell cycle (according to the KEGG pathway analysis results). With regards to molecular function (MF), SLC2A1 was found to be closely correlated with protein binding.
Figure 3.
SLC2A1-related differential gene analysis in volcano map and heatmap. (A) Volcano map of SLC2A1-related differential gene analysis using TCGA data; (B) an expression heatmap of 306 differentially-expressed genes were drawn using the GEO data. TCGA, The Cancer Genome Atlas; GEO, Gene Expression Omnibus.
Figure 4.
Functional enrichment analysis of SLC2A1-related differential genes by GSEA. (A) The results of GO analysis containing logFC for SLC2A1-related differential genes; (B) the results of KEGG analysis containing logFC for SLC2A1-related differential genes showed these SLC2A1-related genes were mainly enriched in the cell cycle; (C) Gene Set Enrichment Analysis based on the HALLMARK gene set in MSigDb showed that these SLC2A1-related genes were mainly enriched in the G2M CHECKPOINT, E2F TARGETS, MITOTIC SPINDLE, GLYCOLYSIS, and MTORC1 SIGNALING pathways. GSEA, Gene Set Enrichment Analysis; logFC, log (Fold Change); GO, Gene Ontology; KEGG, Kyoto Encyclopedia of Genes and Genomes; MSigDb, The Molecular Signatures Database.
Table 2. Gene Set Enrichment Analysis results [including GO (top 10) and KEGG enrichment analysis] for SLC2A1-related differential genes.
| ID | Description | Enrichment score | P.adjust |
|---|---|---|---|
| GO:0005576 | Extracellular region | −0.292583838 | 0.016661795 |
| GO:0005615 | Extracellular space | −0.338404417 | 0.016661795 |
| GO:0005488 | Binding | 0.358355609 | 0.016661795 |
| GO:0005622 | Intracellular anatomical structure | 0.249840001 | 0.016661795 |
| GO:0043228 | Non-membrane-bounded organelle | 0.351254306 | 0.016661795 |
| GO:0043232 | Intracellular non-membrane-bounded organelle | 0.351254306 | 0.016661795 |
| GO:0050794 | Regulation of cellular process | 0.2390881 | 0.016661795 |
| GO:0005515 | Protein binding | 0.341020358 | 0.016661795 |
| GO:0005634 | Nucleus | 0.29956241 | 0.016661795 |
| GO:0016043 | Cellular component organization | 0.349091002 | 0.016661795 |
| hsa04110 | Cell cycle | 0.506896552 | 0.005719886 |
| hsa04114 | Oocyte meiosis | 0.484745763 | 0.018079801 |
| HALLMARK_G2M_CHECKPOINT | HALLMARK_G2M_CHECKPOINT | 0.551469393 | 3.20E-07 |
| HALLMARK_E2F_TARGETS | HALLMARK_E2F_TARGETS | 0.448623465 | 2.87E-04 |
| HALLMARK_MITOTIC_SPINDLE | HALLMARK_MITOTIC_SPINDLE | 0.485915493 | 4.95E-04 |
| HALLMARK_GLYCOLYSIS | HALLMARK_GLYCOLYSIS | 0.493055556 | 0.001923517 |
| HALLMARK_MTORC1_SIGNALING | HALLMARK_MTORC1_SIGNALING | 0.537546645 | 0.015472396 |
GO, Gene Ontology; KEGG, Kyoto Encyclopedia of Genes and Genomes.
GSEA based on the HALLMARK gene set in MSigDb showed that these SLC2A1-related genes were mainly enriched in the G2M CHECKPOINT, E2F TARGETS, MITOTIC SPINDLE, GLYCOLYSIS, and MTORC1 SIGNALING pathways. By searching the annotation of GSEA of these five pathways, we found that the first three pathways were all related to the occurrence or development of mitosis. Thus, we hypothesized that these genes might have a lot to do with tumor progression, and subsequent functional enrichment analyses using Metascape confirmed our hypothesis.
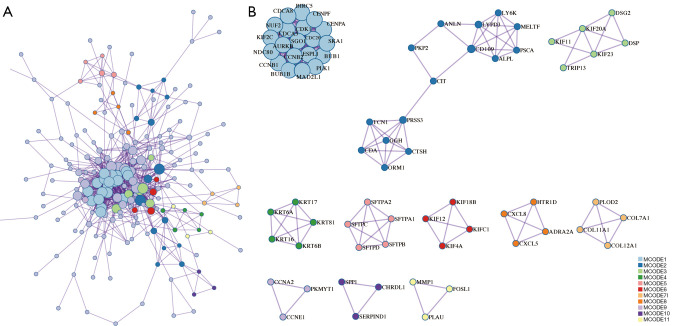
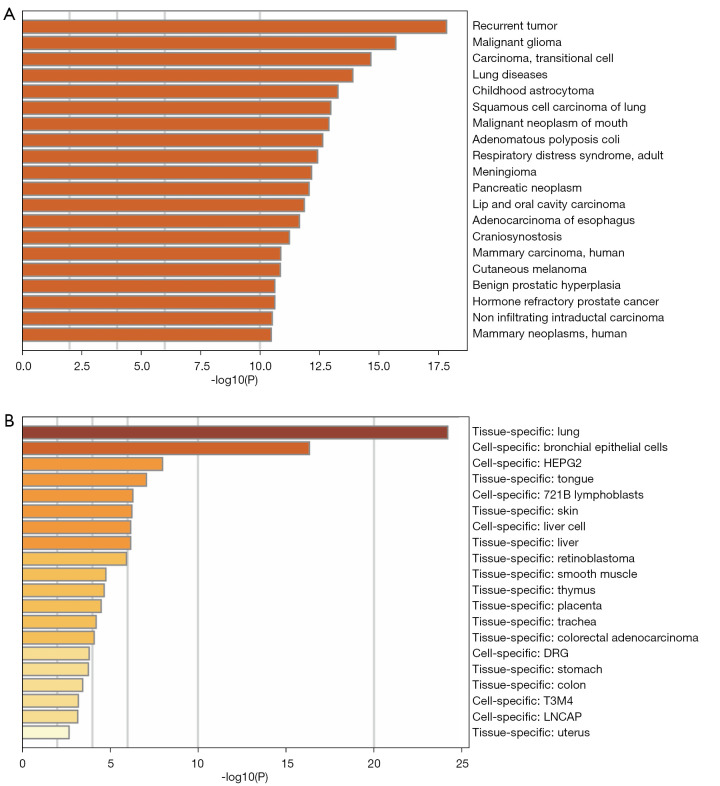
The PPI network analysis results showed that these SLC2A1-related genes were mainly enriched in the resolution of sister chromatid cohesion, mitotic anaphase, and metaphase (Table 3, Figure 5A,5B). Moreover, the disease-genetics analysis result showed these genes were most concentrated in recurrent tumor (Figure 6A). More importantly, the tissue-specific enrichment analysis results showed that the SLC2A1-related genes were mainly enriched in lung tissue and bronchial epithelial cells (Figure 6B).
Table 3. PPI network analysis results for SLC2A1-related differential genes.
| MCODE | ID | Description | Log10 (P) |
|---|---|---|---|
| MCODE_1 | R-HSA-2500257 | Resolution of Sister Chromatid Cohesion | −44 |
| MCODE_1 | R-HSA-68882 | Mitotic Anaphase | −41.9 |
| MCODE_1 | R-HSA-2555396 | Mitotic Metaphase and Anaphase | −41.9 |
| MCODE_2 | R-HSA-163125 | Post-translational modification: synthesis of glycosylphosphatidylinositol (GPI)-anchored proteins | −11.3 |
| MCODE_2 | R-HSA-6798695 | Neutrophil degranulation | −7 |
| MCODE_2 | GO:0031638 | zymogen activation | −5.4 |
| MCODE_3 | R-HSA-983189 | Kinesins | −6.8 |
| MCODE_3 | R-HSA-6811434 | Coat protein complex I (COPI)-dependent Golgi-to-endoplasmic reticulum (ER) retrograde traffic | −6.1 |
| MCODE_3 | R-HSA-2132295 | Major histocompatibility complex (MHC) class II antigen presentation | −5.8 |
| MCODE_4 | R-HSA-6809371 | Formation of the cornified envelope | −11.7 |
| MCODE_4 | R-HSA-6805567 | Keratinization | −10.6 |
| MCODE_4 | GO:0002009 | morphogenesis of an epithelium | −4.2 |
| MCODE_5 | R-HSA-5688890 | Defective CSF2RA causes SMDP4 | −18.8 |
| MCODE_5 | R-HSA-5688849 | Defective CSF2RB causes SMDP5 | −18.8 |
| MCODE_5 | R-HSA-5687613 | Diseases associated with surfactant metabolism | −18.1 |
| MCODE_6 | R-HSA-983189 | Kinesins | −10.8 |
| MCODE_6 | R-HSA-6811434 | COPI-dependent Golgi-to-ER retrograde traffic | −9.8 |
| MCODE_6 | R-HSA-8856688 | Golgi-to-ER retrograde transport | −9.3 |
| MCODE_7 | R-HSA-1650814 | Collagen biosynthesis and modifying enzymes | −10.5 |
| MCODE_7 | R-HSA-1474290 | Collagen formation | −10 |
| MCODE_7 | R-HSA-1474244 | Extracellular matrix organization | −7.9 |
| MCODE_8 | R-HSA-418594 | G alpha (i) signaling events | −7.8 |
| MCODE_8 | R-HSA-373076 | Class A/1 (Rhodopsin-like receptors) | −7.7 |
| MCODE_8 | R-HSA-500792 | g-protein coupled receptor (GPCR) ligand binding | −7.1 |
| MCODE_9 | GO:0000079 | regulation of cyclin-dependent protein serine/threonine kinase activity | −7.4 |
| MCODE_9 | GO:1904029 | regulation of cyclin-dependent protein kinase activity | −7.3 |
| MCODE_9 | WP179 | Cell cycle | −7.1 |
| MCODE_10 | R-HSA-8957275 | Post-translational protein phosphorylation | −7.3 |
| MCODE_10 | R-HSA-381426 | Regulation of insulin-like growth factor (IGF) transport and uptake by insulin-like growth factor binding proteins (IGFBPs) | −7.1 |
| MCODE_11 | M65 | PID FRA PATHWAY | −8.7 |
| MCODE_11 | M167 | PID AP1 PATHWAY | −7.8 |
PPI, protein-protein interaction.
Figure 5.
PPI network of SLC2A1-related differential genes. (A) PPI network of SLC2A1-related differential genes; (B) the 11 key nodes that make up this PPI network and the genes contained within. PPI, protein-protein interaction.
Figure 6.
Disease-genetics analysis of SLC2A1-related differential genes. (A) The disease-genetics analysis result showed these genes were most concentrated in recurrent tumors; (B) the tissue-specific enrichment analysis results showed that the SLC2A1-related genes were mainly enriched in lung tissue and bronchial epithelial cells.
Relationship between SLC2A1 and tumor-infiltrating immune cells (TIICs) and the role of SLC2A1 in tumor immunity
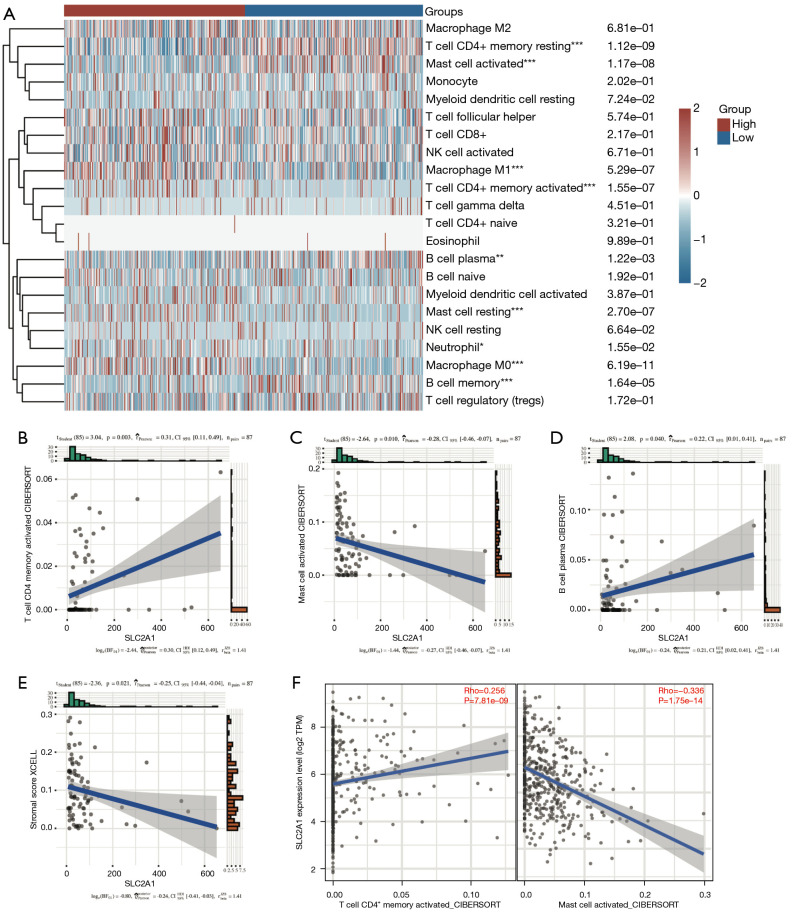
Immune infiltration analysis using CIBERSORT revealed marked differences in the infiltration of nine types of immune cells between the high and low SLC2A1 expression groups (Figure 7A). To verify this, we used GSE40419 to calculate the immune score in the TIMER database, and conducted correlation analysis between SLC2A1 and 22 immune cells by CIBERSORT. The correlation analysis results showed that three of the nine immune cells that CIBERSORT considered to be different were correlated with SLC2A1, and the trend of two of these three cells was the same as TCGA results (Figure 7B-7D, Figure S2). According to the Figure 7C,7D, SLC2A1 expression was positively correlated with activated CD4+ memory T cells (r=0.31, P=0.003) and negatively correlated with activated mast cells (r=−0.28, P=0.010). The correlation between SLC2A1 and these two types of cells in TCGA data was then evaluated using TIMER2.0, and the results were identical (Figure 7E).
Figure 7.
Relationship between SLC2A1 and tumor-infiltrating immune cells. (A) Immune infiltration analysis using CIBERSORT revealed significant differences in the infiltration of nine types of immune cells between the high and low SLC2A1 expression groups in TCGA; (B-D) three of the above nine tumor-infiltrating immune cells also exhibited a significant correlation with SLC2A1 in the GEO data, but the correlation trend of plasma B cells was contrary to that of the previous analysis; (E) SLC2A1 expression was negatively correlated with the stromal score in TIMER; (F) the correlation between SLC2A1 and the two cells in TCGA data was evaluated using TIMER2.0, and the results were the identical to those of the GEO. *, P<0.05; **, P<0.01; ***, P<0.001. TCGA, The Cancer Genome Atlas; GEO, Gene Expression Omnibus.
Additionally, we also paid attention to the immune microenvironment score, immune score, and stromal score calculated by XCELL algorithm in TIMER, and found that SLC2A1 expression was negatively correlated with the immune stromal score (r=−0.25, P=0.021) (Figure 7F). This indicated that SLC2A1 plays an important role in tumor immune cells infiltrating and it has a certain influence on the tumor immune microenvironment.
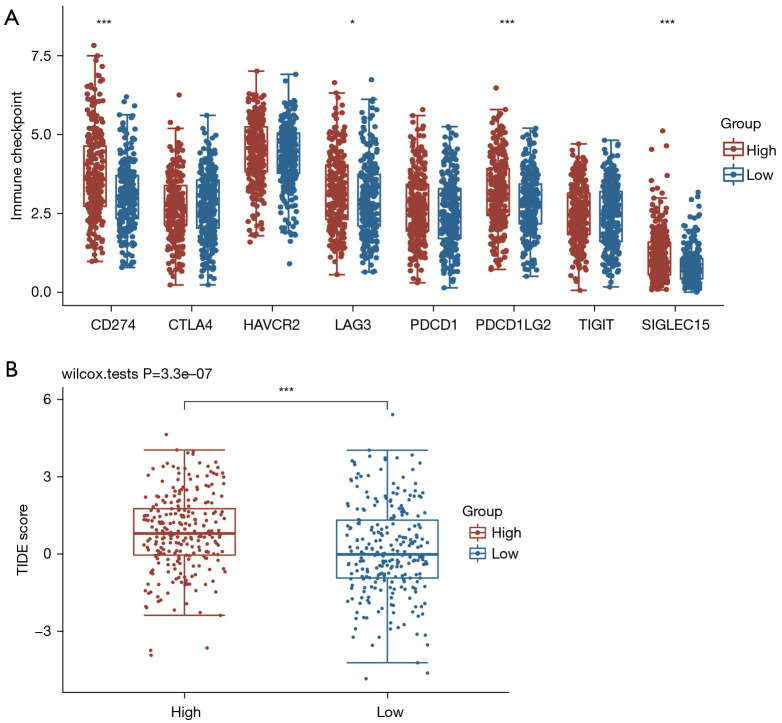
In order to explore the role of SLC2A1 in the clinical application of tumor immunity, we also compared the expression of eight immune-checkpoint-related transcripts between the high and low SLC2A1 expression groups. Additionally, the TIDE scores of these two groups were also calculated to compare the potential immune-checkpoint-blocking (ICB) response. The results showed that four of the eight immune-checkpoint-related genes were differentially expressed in both groups (Figure 8A). All four genes were highly expressed in the high SLC2A1 expression group. Similarly, the TIDE score of the high SLC2A1 expression group was markedly higher than that of the low SLC2A1 expression group (Figure 8B). This suggested that patients with high SLC2A1 expression may have a poor prognosis due to their own poor immune response to the tumor, and the effect of immunotherapy in these patients may be worse than that of patients with low SLC2A1 expression.
Figure 8.
SLC2A1 was correlated with immune-checkpoint-transcripts and immune-checkpoint-blocking. (A) Four of the eight immune-checkpoint-related genes were differentially expressed in the two groups, and all four genes were highly expressed in the high SLC2A1 expression group; (B) the TIDE score of the high SLC2A1 expression group was significantly higher than that of the low SLC2A1 expression group. *, P<0.05; ***, P<0.001. TIDE, tumor immune dysfunction and exclusion.
Patients in the high and low SLC2A1 expression groups had different sensitivities to chemotherapy drugs and targeted drugs
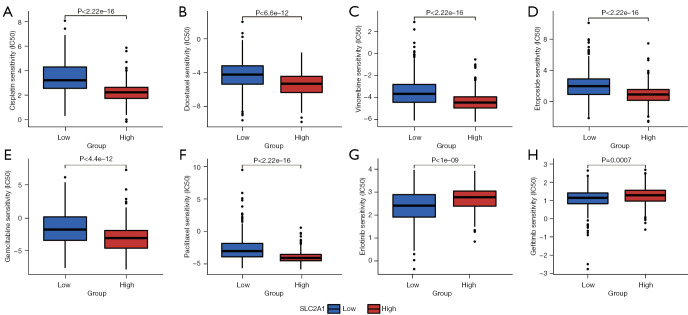
We summarized the currently commonly used chemotherapy and targeted drugs for LUAD and matched them with drugs included in the CGP database, and found that eight therapeutic drugs were included in the CGP database. We used the gene expression profile data of the samples to predict the IC50 of the two groups, and the results showed that the sensitivity of patients with low SLC2A1 expression to six chemotherapy drugs was significantly higher than that of patients with high SLC2A1 expression (Figure 9A-9F), while patients with high SLC2A1 expression were markedly more sensitive to the two targeted therapies than those with low SLC2A1 expression (Figure 9G,9H). We considered that this may be due to differences in the somatic mutations between patients with high and low SLC2A1 expression, and the mutation frequency of driver genes in patients with high SLC2A1 expression may be higher.
Figure 9.
Patients with high and low SLC2A1 expression had different sensitivities to chemotherapy drugs and targeted drugs. (A-F) The sensitivity of patients with low SLC2A1 expression to six chemotherapy drugs was significantly higher than that of patients with high SLC2A1 expression; (G,H) patients with high SLC2A1 expression were significantly more sensitive to the two targeted therapies than those with low SLC2A1 expression.
Therefore, we conducted a landscape analysis of mutations in SLC2A1 high and low expression groups using R, and the results showed that there was no notable difference in the top 10 mutant genes between the two groups (Figures S3,S4). According to the mutation frequency difference analysis between the two groups (Figure S5), there were significant differences in ALK, MET, and ROS1 mutations between the two groups. However, the mutation of EGFR, which was the target of the two targeted drugs for drug sensitivity analysis, showed no significant difference between the two groups. Therefore, we believe that this cannot explain the above drug sensitivity analysis results, and further research may be needed to determine the specific reasons.
Discussion
At present, it has been established that the growth and diffusion of a tumor depends on the characteristics of the tumor cells themselves, and is also closely related to the internal tumor microenvironment, especially the tumor immune microenvironment (31-33). Previous study (11) has shown that SLC2A1 is overexpressed in LUAD tumor tissues and has prognostic significance for patients with surgically-resected LUAD. However, the prognostic role of SLC2A1 transcription in all LUAD patients, its possible mechanism, and its role in tumor immunity have not yet been established.
In this study, SLC2A1 was found to be significantly overexpressed in LUAD tumor tissues and associated with poor prognosis. Univariate and multivariate Cox regression analyses showed that SLC2A1 is an independent prognostic biomarker of LUAD. Next, we constructed the differential expression and PPI networks of SLC2A1, and the potential mechanism of SLC2A1 in LUAD was explored. We subsequently explored the relationship between SLC2A1 and tumor immunity, and found that SLC2A1 is correlated with tumor immune invasion and immunotherapy efficacy, which may be a possible reason for the correlation between SLC2A1 and poor prognosis. Finally, the relationship between SLC2A1 and drug sensitivity was analyzed. Our study systematically revealed the role of SLC2A1 as a tumor prognostic marker in LUAD, and analyzed its potential mechanism and clinical significance from various aspects.
Through further analysis of TCGA-LUAD data, we found that SLC2A1 expression varied among T stages, N stages, and different genders. We then performed survival analysis using GEPIA and the Kaplan-Meier Plotter, and found that high SLC2A1 expression was associated with worse OS and PFS. Our results suggest that SLC2A1 has potential as a diagnostic and prognostic biomarker for LUAD. However, the biological function of SLC2A1 and its potential prognosis-related mechanism still needs to be explored.
In order to explore the potential molecular mechanism of SLC2A1 in LUAD, SLC2A1-related differential expression analysis was performed on TCGA-LUAD data and a SLC2A1 differential expression network was constructed. In total, 306 SLC2A1-related differential expression genes were screened out. GO and KEGG analyses of these genes revealed that they were mainly concentrated in cell cycle and mitosis-related pathways. The GSEA enrichment analysis results with the HALLMARK gene sets as the background showed that these genes were mainly enriched in the G2M CHECKPOINT, E2F TARGETS, MITOTIC SPINDLE, GLYCOLYSIS, and MTORC1 SIGNALING pathways. G2/M checkpoint has been reported to play a role in DNA repair in tumor cells (34). Normal cells repair DNA damage during G1 arrest, which is often deficient in cancer cells, while cancer cells repair damaged DNA depending on the G2/M checkpoint. It has been reported that the G2/M checkpoint is associated with the development of multiple tumors (35). E2F TARGETS gene sets containing genes encoding cell cycle-related targets of E2F transcription factors, which are key regulators of cell cycle checkpoints, and regulate a large number of genes related to DNA replication and cell cycle progression (36). Furthermore, it has also been found to be associated with tumor progression (37,38). Similarly, MITOTIC SPINDLE, GLYCOLYSIS (39,40), and MTORC1 SIGNALING (41,42) have all been shown to play different regulatory roles in tumor cell growth and the cell cycle. The Metascape enrichment analysis results provided more insight into protein, tissue, and disease levels. PPI showed that SLC2A1-related differential genes were mainly manifested in the resolution of sister chromatid cohesion, mitotic anaphase, and metaphase in terms of protein function, which were all associated with cell growth. In the tissue specific enrichment analysis, these genes were mainly expressed in lung tissue, bronchial epithelial cells, and the trachea. More importantly, the disease-genetics enrichment analysis results showed that the most closely related diseases were tumor recurrence and lung disease. These results directly illustrate the role of SLC2A1 in lung tumor development and perfectly explain its prognostic role in LUAD.
However, according to the analysis results, SLC2A1 may also play an important role in lung squamous cell carcinoma (LUSC). As shown in Figure 1A, the expression of SLC2A1 in lung squamous cell carcinoma tissues is significantly higher than that in normal tissues. However, we plotted the survival curves of LUSC patients with high and low SLC2A1 expression in GEPIA (Figure S6), and found no difference in survival between the two groups (logrank POS =0.22, PPFS =0.3). This suggests that SLC2A1 may be a good diagnostic indicator in LUSC, but is not associated with LUSC prognosis.
It is known that tumor immune infiltration is significantly associated with cancer prognosis (43). Therefore, we attempted to explore the relationship between SLC2A1 and LUAD in terms of tumor immunity. We found that there were significant differences in the infiltration of nine infiltrating immune cells in the high and low SLC2A1 expression groups, based on TCGA-LUAD data. After validation in the GEO data, we found that SLC2A1 was positively correlated with activated CD4+ memory T cells and negatively correlated with activated mast cells. Different immune infiltrations can lead to different outcomes in tumors (43,44). For example, activated CD4+ memory T cell infiltration has been shown to be associated with poor prognosis and immune therapy response in several cancers (45,46), as have activated mast cells (47-49). This indicates that SLC2A1 might play a vital role in regulating the tumor immune microenvironment, and affects the prognosis of tumors by regulating infiltrating immune cells.
However, it is not just immune cell infiltration that affects the body's immune response to tumors. Immune checkpoint molecules are inhibitory regulatory molecules in the immune system, which are essential for maintaining tolerance, preventing autoimmune reactions, and minimizing tissue damage by controlling the timing and intensity of immune responses (50,51). The expression of immune checkpoint molecules will inhibit the function of immune cells, so that the body cannot produce an effective anti-tumor immune response, and the tumor will form immune escape (52,53). We screened out eight genes (24-27) associated with immune checkpoint via a literature search, and found that the expressions of four genes in the SLC2A1 high expression group were significantly higher compared to the SLC2A1 low expression group. This indicates that in the SLC2A1 overexpression group, the function of immune cells is relatively suppressed and the risk of tumor immune escape is higher, which predicts a worse prognosis.
In addition, we also used the TIDE algorithm to evaluate the relationship between SLC2A1 and the efficacy of immune checkpoint inhibitors. TIDE uses a set of gene expression markers to evaluate two different tumor immune escape mechanisms, including tumor-infiltrating cytotoxic T lymphocyte (CTL) dysfunction and rejection of CTL by immunosuppressive factors. A high TIDE score is associated with poor efficacy of immunocheckpoint blocking therapy (ICB) and short survival after ICB treatment. The TIDE score of the SLC2A1 high expression group was significantly higher than that of the SLC2A1 low expression group, indicating that patients with high SLC2A1 had a relatively poor response to immune checkpoint inhibitors and a worse immunotherapy effect. These analyses strongly demonstrated that SLC2A1 is closely associated to tumor immune cell infiltration and immune checkpoint, and provided an explanation as to why patients with high SLC2A1 expression had worse prognosis in terms of tumor immunity.
Finally, we analyzed the relationship between SLC2A1 and IC50(the half maximal inhibitory concentration) for LUAD therapy from a clinical perspective. The “pRRophetic” package is an algorithm for drug response prediction based on expression matrices developed by the CGP database, which contains 138 drug actions from more than 700 cell lines (29,54). Interestingly, we found that patients with high SLC2A1 expression had remarkably lower sensitivity to chemotherapy drugs than patients with low SLC2A1 expression. This was consistent with the results of previous survival analyses of patients after chemotherapy. The Kaplan-Meier Plotter analysis showed that patients with high SLC2A1 expression group had worse OS after chemotherapy, which may be largely attributable to a low sensitivity to chemotherapy drugs. Additionally, patients with high SLC2A1 expression were more sensitive to targeted drugs, which we believe may be due to differences in somatic mutations between patients with high and low SLC2A1 expression, and the driver gene mutation frequency of patients with high SLC2A1 expression may be higher. However, subsequent mutation-related analyses refuted our hypothesis, and thus, further studies may be needed to investigate the cause of this susceptibility.
In order to avoid selection bias and increase the credibility of our research results, data from TCGA and GEO were used, and four different GEO datasets were utilized for joint analysis. However, our bioinformatics-based analysis still had limitations, and it is necessary for all research results to be verified by wet experiments. Also, the signaling pathway analyzed in this study was discovered through data mining, and its causal relationship in lung cancer needs to be verified experimentally. Finally, the number of tumor samples in the GEO dataset, which was used for validation, was relatively small. In future studies, we will expand the sample size and verify our analysis results in cell and animal models.
Conclusions
To the best of our knowledge, this is the first relatively complete study to reveal the role of SLC2A1 in LUAD prognosis and tumor immunity, and determine the related mechanisms. Our study found that high SLC2A1 expression in LUAD predicted poor prognosis and was closely related to tumor immunity, which could be used as an effective prognostic biomarker to provide a new strategy for clinical prognosis assessment and immunotherapy of LUAD.
Supplementary
The article’s supplementary files as
Acknowledgments
Funding: This study was supported by the Project of Tianjin Key Clinical Disciplines and the Project of Tianjin Health Commission (grant No. ZD20023), and the Project of Tianjin Science and Technology Innovation Bureau (grant No. 20JCYBJC01350).
Ethical Statement: The authors are accountable for all aspects of the work in ensuring that questions related to the accuracy or integrity of any part of the work are appropriately investigated and resolved. The study was conducted in accordance with the Declaration of Helsinki (as revised in 2013).
Reporting Checklist: The authors have completed the REMARK reporting checklist. Available at https://atm.amegroups.com/article/view/10.21037/atm-22-1430/rc
Conflicts of Interest: All authors have completed the ICMJE uniform disclosure form (available at https://atm.amegroups.com/article/view/10.21037/atm-22-1430/coif). The authors have no conflicts of interest to declare.
(English Language Editor: A. Kassem)
References
- 1.Siegel RL, Miller KD, Fuchs HE, et al. Cancer Statistics, 2021. CA Cancer J Clin 2021;71:7-33. 10.3322/caac.21654 [DOI] [PubMed] [Google Scholar]
- 2.Barta JA, Powell CA, Wisnivesky JP. Global Epidemiology of Lung Cancer. Ann Glob Health 2019;85:8. 10.5334/aogh.2419 [DOI] [PMC free article] [PubMed] [Google Scholar]
- 3.Devarakonda S, Masood A, Govindan R. Next-Generation Sequencing of Lung Cancers: Lessons Learned and Future Directions. Hematol Oncol Clin North Am 2017;31:1-12. 10.1016/j.hoc.2016.08.008 [DOI] [PubMed] [Google Scholar]
- 4.Kim IA, Hur JY, Kim HJ, et al. Targeted Next-Generation Sequencing Analysis for Recurrence in Early-Stage Lung Adenocarcinoma. Ann Surg Oncol 2021;28:3983-93. 10.1245/s10434-020-09276-x [DOI] [PMC free article] [PubMed] [Google Scholar]
- 5.Zhao X, Li X, Zhou L, et al. LncRNA HOXA11-AS drives cisplatin resistance of human LUAD cells via modulating miR-454-3p/Stat3. Cancer Sci 2018;109:3068-79. 10.1111/cas.13764 [DOI] [PMC free article] [PubMed] [Google Scholar]
- 6.Jin R, Wang X, Zang R, et al. Desmoglein-2 modulates tumor progression and osimertinib drug resistance through the EGFR/Src/PAK1 pathway in lung adenocarcinoma. Cancer Lett 2020;483:46-58. 10.1016/j.canlet.2020.04.001 [DOI] [PubMed] [Google Scholar]
- 7.Lin L, Yee SW, Kim RB, et al. SLC transporters as therapeutic targets: emerging opportunities. Nat Rev Drug Discov 2015;14:543-60. 10.1038/nrd4626 [DOI] [PMC free article] [PubMed] [Google Scholar]
- 8.Mo Z, Yu L, Cao Z, et al. Identification of a Hypoxia-Associated Signature for Lung Adenocarcinoma. Front Genet 2020;11:647. 10.3389/fgene.2020.00647 [DOI] [PMC free article] [PubMed] [Google Scholar]
- 9.Wang X, Shi D, Zhao D, et al. Aberrant Methylation and Differential Expression of SLC2A1, TNS4, GAPDH, ATP8A2, and CASZ1 Are Associated with the Prognosis of Lung Adenocarcinoma. Biomed Res Int 2020;2020:1807089. 10.1155/2020/1807089 [DOI] [PMC free article] [PubMed] [Google Scholar] [Retracted]
- 10.Su C, Liu WX, Wu LS, et al. Screening of Hub Gene Targets for Lung Cancer via Microarray Data. Comb Chem High Throughput Screen 2021;24:269-85. 10.2174/1386207323666200808172631 [DOI] [PubMed] [Google Scholar]
- 11.Guo W, Sun S, Guo L, et al. Elevated SLC2A1 Expression Correlates with Poor Prognosis in Patients with Surgically Resected Lung Adenocarcinoma: A Study Based on Immunohistochemical Analysis and Bioinformatics. DNA Cell Biol 2020;39:631-44. 10.1089/dna.2019.5291 [DOI] [PubMed] [Google Scholar]
- 12.Ben Bolstad (2021). preprocessCore: A collection of pre-processing.functions. Available online: https://github.com/bmbolstad/preprocessCore
- 13.Ritchie ME, Phipson B, Wu D, et al. limma powers differential expression analyses for RNA-sequencing and microarray studies. Nucleic Acids Res 2015;43:e47. 10.1093/nar/gkv007 [DOI] [PMC free article] [PubMed] [Google Scholar]
- 14.Wickham H. ggplot2: Elegant Graphics for Data Analysis. New York: Springer-Verlag, 2016. [Google Scholar]
- 15.Tang Z, Li C, Kang B, et al. GEPIA: a web server for cancer and normal gene expression profiling and interactive analyses. Nucleic Acids Res 2017;45:W98-W102. 10.1093/nar/gkx247 [DOI] [PMC free article] [PubMed] [Google Scholar]
- 16.Győrffy B, Surowiak P, Budczies J, et al. Online survival analysis software to assess the prognostic value of biomarkers using transcriptomic data in non-small-cell lung cancer. PLoS One 2013;8:e82241. Erratum in: PLoS One 2014;9:e111842. 10.1371/journal.pone.0082241 [DOI] [PMC free article] [PubMed] [Google Scholar]
- 17.Simon N, Friedman J, Hastie T, et al. Regularization Paths for Cox's Proportional Hazards Model via Coordinate Descent. J Stat Softw 2011;39:1-13. 10.18637/jss.v039.i05 [DOI] [PMC free article] [PubMed] [Google Scholar]
- 18.Therneau T (2021). A Package for Survival Analysis in R_. R package version 3.2-11. Available online: https://CRAN.R-project.org/package=survival
- 19.Wu T, Hu E, Xu S, et al. clusterProfiler 4.0: A universal enrichment tool for interpreting omics data. Innovation (N Y) 2021;2:100141. 10.1016/j.xinn.2021.100141 [DOI] [PMC free article] [PubMed] [Google Scholar]
- 20.Zhou Y, Zhou B, Pache L, et al. Metascape provides a biologist-oriented resource for the analysis of systems-level datasets. Nat Commun 2019;10:1523. 10.1038/s41467-019-09234-6 [DOI] [PMC free article] [PubMed] [Google Scholar]
- 21.Sturm G, Finotello F, List M. Immunedeconv: An R Package for Unified Access to Computational Methods for Estimating Immune Cell Fractions from Bulk RNA-Sequencing Data. Methods Mol Biol 2020;2120:223-32. 10.1007/978-1-0716-0327-7_16 [DOI] [PubMed] [Google Scholar]
- 22.Li T, Fu J, Zeng Z, et al. TIMER2.0 for analysis of tumor-infiltrating immune cells. Nucleic Acids Res 2020;48:W509-14. 10.1093/nar/gkaa407 [DOI] [PMC free article] [PubMed] [Google Scholar]
- 23.Patil I. Visualizations with statistical details: The ‘ggstatsplot' approach. Journal of Open Source Software 2021;6:3167. 10.21105/joss.03167 [DOI] [Google Scholar]
- 24.Zeng D, Li M, Zhou R, et al. Tumor Microenvironment Characterization in Gastric Cancer Identifies Prognostic and Immunotherapeutically Relevant Gene Signatures. Cancer Immunol Res 2019;7:737-50. 10.1158/2326-6066.CIR-18-0436 [DOI] [PubMed] [Google Scholar]
- 25.Ravi R, Noonan KA, Pham V, et al. Bifunctional immune checkpoint-targeted antibody-ligand traps that simultaneously disable TGFβ enhance the efficacy of cancer immunotherapy. Nat Commun 2018;9:741. 10.1038/s41467-017-02696-6 [DOI] [PMC free article] [PubMed] [Google Scholar]
- 26.Wang J, Sun J, Liu LN, et al. Siglec-15 as an immune suppressor and potential target for normalization cancer immunotherapy. Nat Med 2019;25:656-66. 10.1038/s41591-019-0374-x [DOI] [PMC free article] [PubMed] [Google Scholar]
- 27.Yi L, Wu G, Guo L, et al. Comprehensive Analysis of the PD-L1 and Immune Infiltrates of m6A RNA Methylation Regulators in Head and Neck Squamous Cell Carcinoma. Mol Ther Nucleic Acids 2020;21:299-314. 10.1016/j.omtn.2020.06.001 [DOI] [PMC free article] [PubMed] [Google Scholar]
- 28.Jiang P, Gu S, Pan D, et al. Signatures of T cell dysfunction and exclusion predict cancer immunotherapy response. Nat Med 2018;24:1550-8. 10.1038/s41591-018-0136-1 [DOI] [PMC free article] [PubMed] [Google Scholar]
- 29.Geeleher P, Cox N, Huang RS. pRRophetic: an R package for prediction of clinical chemotherapeutic response from tumor gene expression levels. PLoS One 2014;9:e107468. 10.1371/journal.pone.0107468 [DOI] [PMC free article] [PubMed] [Google Scholar]
- 30.Mayakonda A, Lin DC, Assenov Y, et al. Maftools: efficient and comprehensive analysis of somatic variants in cancer. Genome Res 2018;28:1747-56. 10.1101/gr.239244.118 [DOI] [PMC free article] [PubMed] [Google Scholar]
- 31.Hanahan D, Weinberg RA. Hallmarks of cancer: the next generation. Cell 2011;144:646-74. 10.1016/j.cell.2011.02.013 [DOI] [PubMed] [Google Scholar]
- 32.Matsushita H, Vesely MD, Koboldt DC, et al. Cancer exome analysis reveals a T-cell-dependent mechanism of cancer immunoediting. Nature 2012;482:400-4. 10.1038/nature10755 [DOI] [PMC free article] [PubMed] [Google Scholar]
- 33.Steven A, Fisher SA, Robinson BW. Immunotherapy for lung cancer. Respirology 2016;21:821-33. 10.1111/resp.12789 [DOI] [PubMed] [Google Scholar]
- 34.Matheson CJ, Backos DS, Reigan P. Targeting WEE1 Kinase in Cancer. Trends Pharmacol Sci 2016;37:872-81. 10.1016/j.tips.2016.06.006 [DOI] [PubMed] [Google Scholar]
- 35.Vera J, Raatz Y, Wolkenhauer O, et al. Chk1 and Wee1 control genotoxic-stress induced G2-M arrest in melanoma cells. Cell Signal 2015;27:951-60. 10.1016/j.cellsig.2015.01.020 [DOI] [PubMed] [Google Scholar]
- 36.Lavia P, Jansen-Dürr P. E2F target genes and cell-cycle checkpoint control. Bioessays 1999;21:221-30. [DOI] [PubMed] [Google Scholar]
- 37.Bracken AP, Ciro M, Cocito A, et al. E2F target genes: unraveling the biology. Trends Biochem Sci 2004;29:409-17. 10.1016/j.tibs.2004.06.006 [DOI] [PubMed] [Google Scholar]
- 38.Tian W, Yang X, Yang H, et al. GINS2 Functions as a Key Gene in Lung Adenocarcinoma by WGCNA Co-Expression Network Analysis. Onco Targets Ther 2020;13:6735-46. 10.2147/OTT.S255251 [DOI] [PMC free article] [PubMed] [Google Scholar]
- 39.Feng J, Li J, Wu L, et al. Emerging roles and the regulation of aerobic glycolysis in hepatocellular carcinoma. J Exp Clin Cancer Res 2020;39:126. 10.1186/s13046-020-01629-4 [DOI] [PMC free article] [PubMed] [Google Scholar]
- 40.Ganapathy-Kanniappan S, Geschwind JF. Tumor glycolysis as a target for cancer therapy: progress and prospects. Mol Cancer 2013;12:152. 10.1186/1476-4598-12-152 [DOI] [PMC free article] [PubMed] [Google Scholar]
- 41.Ben-Sahra I, Manning BD. mTORC1 signaling and the metabolic control of cell growth. Curr Opin Cell Biol 2017;45:72-82. 10.1016/j.ceb.2017.02.012 [DOI] [PMC free article] [PubMed] [Google Scholar]
- 42.Takahara T, Amemiya Y, Sugiyama R, et al. Amino acid-dependent control of mTORC1 signaling: a variety of regulatory modes. J Biomed Sci 2020;27:87. 10.1186/s12929-020-00679-2 [DOI] [PMC free article] [PubMed] [Google Scholar]
- 43.Pan Y, Sha Y, Wang H, et al. Comprehensive analysis of the association between tumor-infiltrating immune cells and the prognosis of lung adenocarcinoma. J Cancer Res Ther 2020;16:320-6. 10.4103/jcrt.JCRT_954_19 [DOI] [PubMed] [Google Scholar]
- 44.Iglesia MD, Parker JS, Hoadley KA, et al. Genomic analysis of immune cell infiltrates across 11 tumor types. J Natl Cancer Inst 2016;108:djw144. 10.1093/jnci/djw144 [DOI] [PMC free article] [PubMed] [Google Scholar]
- 45.Gadi D, Griffith A, Tyekucheva S, et al. A T cell inflammatory phenotype is associated with autoimmune toxicity of the PI3K inhibitor duvelisib in chronic lymphocytic leukemia. Leukemia 2022;36:723-32. 10.1038/s41375-021-01441-9 [DOI] [PMC free article] [PubMed] [Google Scholar]
- 46.Zou W, Li L, Wang Z, et al. Up-regulation of S100P predicts the poor long-term survival and construction of prognostic signature for survival and immunotherapy in patients with pancreatic cancer. Bioengineered 2021;12:9006-20. 10.1080/21655979.2021.1992331 [DOI] [PMC free article] [PubMed] [Google Scholar]
- 47.Qiu P, Guo Q, Yao Q, et al. Characterization of Exosome-Related Gene Risk Model to Evaluate the Tumor Immune Microenvironment and Predict Prognosis in Triple-Negative Breast Cancer. Front Immunol 2021;12:736030. 10.3389/fimmu.2021.736030 [DOI] [PMC free article] [PubMed] [Google Scholar]
- 48.Fan L, Ru J, Liu T, et al. Identification of a Novel Prognostic Gene Signature From the Immune Cell Infiltration Landscape of Osteosarcoma. Front Cell Dev Biol 2021;9:718624. 10.3389/fcell.2021.718624 [DOI] [PMC free article] [PubMed] [Google Scholar]
- 49.Zhang J, Yin J, Luo L, et al. Integrative Analysis of DNA Methylation and Transcriptome Identifies a Predictive Epigenetic Signature Associated With Immune Infiltration in Gliomas. Front Cell Dev Biol 2021;9:670854. 10.3389/fcell.2021.670854 [DOI] [PMC free article] [PubMed] [Google Scholar]
- 50.Zha C, Meng X, Li L, et al. Neutrophil extracellular traps mediate the crosstalk between glioma progression and the tumor microenvironment via the HMGB1/RAGE/IL-8 axis. Cancer Biol Med 2020;17:154-68. 10.20892/j.issn.2095-3941.2019.0353 [DOI] [PMC free article] [PubMed] [Google Scholar]
- 51.Dermani FK, Samadi P, Rahmani G, et al. PD-1/PD-L1 immune checkpoint: Potential target for cancer therapy. J Cell Physiol 2019;234:1313-25. 10.1002/jcp.27172 [DOI] [PubMed] [Google Scholar]
- 52.Li B, Chan HL, Chen P. Immune Checkpoint Inhibitors: Basics and Challenges. Curr Med Chem 2019;26:3009-25. 10.2174/0929867324666170804143706 [DOI] [PubMed] [Google Scholar]
- 53.Pardoll DM. The blockade of immune checkpoints in cancer immunotherapy. Nat Rev Cancer 2012;12:252-64. 10.1038/nrc3239 [DOI] [PMC free article] [PubMed] [Google Scholar]
- 54.Geeleher P, Cox NJ, Huang RS. Clinical drug response can be predicted using baseline gene expression levels and in vitro drug sensitivity in cell lines. Genome Biol 2014;15:R47. 10.1186/gb-2014-15-3-r47 [DOI] [PMC free article] [PubMed] [Google Scholar]
Associated Data
This section collects any data citations, data availability statements, or supplementary materials included in this article.
Supplementary Materials
The article’s supplementary files as


