

Abstract
Following the sudden widespread of the novel coronavirus (COVID‐19) which first appeared in Wuhan city. Remdesivir (REM) was the first medicine licensed by the US Food and Drug Administration (FDA) for COVID‐19 infected hospitalized patients. Hence, there was an urgent demand for the optimization of efficient selective and sensitive methods to be developed for the determination of REM in pharmaceuticals as well as biological samples. A sensitive and simple green spectrofluorimetric method has been developed to determine REM in pharmaceutical formulation, in addition to, spiked human plasma. The technique involves measuring the native fluorescence of REM in distilled water at 410 nm followed by excitation at 241 nm, giving a linear relationship over the range 50.00–500.00 ng/mL, and then improving the sensitivity of REM through micellar formation using 2.00% w/v sodium dodecyl sulfate (SDS). A linear relationship has been obtained over the range 10.00–350.00 ng/mL having detection and quantitation limits of 2.34 and 7.10 ng/mL, respectively. Different analytical parameters have been carefully studied. A validation study has been conducted successfully in accordance with the FDA and the International Council for Harmonization of Technical Requirements for Pharmaceuticals for Human Use (ICH) guidelines. The developed methods' greenness was assessed utilizing a greenness profile and analytical eco‐scale standards. Both methods were discovered to be environmentally friendly and could be successfully used for the determination of the studied drugs in pharmaceutical formulation and human plasma with good accuracy and high precision. As a result, the developed spectrofluorimetric methods could be ideally suited for determination of REM in quality control and medicinal laboratories.
Keywords: COVID‐19, human plasma, remdesivir, spectrofluorimetry
The development of successful methods for remdesivir (REM) analysis represents a great priority regarding COVID‐19 frightening spread. This research has determined REM by two simple ways; the first one, by measuring native REM fluorescence as an aqueous solution, while the second one, determines its solution in sodium dodecyl sulfate aqueous solution. They have the advantages of being very simple and sensitive covering wide linearity range (10.00–500.00 ng/mL).

1. INTRODUCTION
Coronavirus pandemic is considered the greatest challenge for humanity in the current century. The fast and frightening global spread caused a huge number of critical cases and deaths all over the world, which exceeded 493 million confirmed cases and 6.1 million deaths of COVID‐19.[ 1 ] Different vaccines have been formulated that have been approved for emergency use but unfortunately most lack sufficient efficacy and safety studies.[ 2 ] Several therapeutic protocols that include many anti‐viral agents have been studied to reduce hospitalization and severe symptoms of COVID‐19.[ 3 ] One of the most promising antiviral agents in managing severe cases is remdesivir (REM) which was first developed for the Ebola virus by Gilead Sciences.[ 4 ] REM (Figure 1) is chemically identified as 2‐ethylbutyl(2S)‐2‐[[[(2R,3S,4R,5R)‐5‐(4‐aminopyrrolo[2,1‐f][1,2,4]triazin‐7‐yl)‐5‐cyano‐3,4‐dihydroxyoxolan‐2‐yl]methoxy‐phenoxyphosphoryl]amino]propanoate. It acts as an RNA‐dependent RNA polymerase (RdRp) inhibitor; the enzyme responsible for coronavirus replication.[ 5 ] Currently, this molecule has exhibited activity against different RNA pathogenic viruses such as MERS‐CoV, Nipah and SARS‐CoV.[ 6 , 7 ] Thus, it has been emergency authorized to be utilized against COVID‐19 in many countries like the United States, Taiwan, Canada, Japan, Australia, Egypt, India, South Korea, United Arab Emirates and Europe and hence has led to a significant increase in its production.[ 8 ]
FIGURE 1.

Chemical structure of remdesivir (REM)
Up to date, few liquid chromatographic methods using mass spectrometry (MS) or photodiode array (PDA) detectors have been reported for the determination of REM alone in biological samples[ 9 , 10 ] or in combination with its metabolites.[ 11 , 12 , 13 ] Also, thin‐layer chromatography (TLC)‐densitometric method has been utilized to determine REM and favipiravir as a binary mixture[ 14 ] and an electrochemical method for the determination of REM using Squaraine Dye – Ag2O2. [ 15 ] However, the previously reported chromatographic and electrochemical methods require highly sophisticated instruments and expensive reagents. Spectrofluorimetric analysis is a suitable solution for the sophisticated instrumentation of liquid chromatography and electrochemical systems which have large operating costs, time consumption and harm to environment. This technique has afforded favorable criteria with respect to high sensitivity, accuracy, simplicity and low cost.[ 16 , 17 , 18 , 19 ] However, only one spectrofluorimetric technique has been recently reported for analyzing REM depending on measuring its fluorescence intensity at pH 4 using a Britton Robinson buffer.[ 20 ]
Accordingly, developing successful methods for REM analysis represents a great priority owing to the frightening spread of COVID‐19. This research, has determined REM by two simple ways; the first one, by measuring fluorescence of REM as aqueous solution, while the second one, determines its solution in sodium dodecyl sulfate (SDS) aqueous solution. The utilization of surfactants has a positive impact on analysis with respect to improvement or induction of fluorescence in addition to chromatographic resolution.[ 21 , 22 , 23 , 24 , 25 , 26 ] SDS above its critical micellar concentration (CMC) has shown improved sensitivity in this research work. The developed methods have numerous advantages such as being very simple without tedious sample pretreatment or analysis steps using available inexpensive solvents (distilled water or SDS) compared to Britton Robinson buffer and pH adjustment in reported spectroflourimetric method[ 20 ] and the sophisticated steps required for chromatographic or electrochemical analysis[ 9 , 10 , 11 , 12 , 13 , 14 , 15 ] that need well‐trained personnel. The methods save time since the fluorescence intensity is analyzed instantly. Also, they have the advantage of covering a wider linearity range for determination of REM (10.00–500.00 ng/mL) that can be easily used in daily quality control analysis for raw material, dosage form, and human spiked plasma. Also taken into account are the requirements to employ greener methods that were scientifically validated to remove the usage of harmful chemicals and hazardous solvents while remaining environmentally friendly.
2. EXPERIMENTAL
2.1. Apparatus
The following apparatus has been used throughout the investigation:
PerkinElmer UK type LS 45 (PerkinElmer, Beaconsfield, UK) luminescence spectrometer, fitted with a 150 W xenon arc lamp, grating monochromators were tuned at 10 nm for excitation and emission, utilizing a 1 cm quartz cuvette. FL WinlabTM application software was used to control the spectrometer.
Sonicator (Bender and Hobein, Bransonic 220, GmbH, Germany).
Analytical balance (digital) (AG 29; Mettler Toledo, Glattbrugg, Switzerland).
Laboratory centrifuge 4000c/s (Bremsen ECCO, Germany).
Water bath with thermostatic control (Salvis AG, Emmen, Switzerland)
2.2. Materials and methods
REM with claimed purity of 100.68 ± 1.04 was kindly gifted by EVA Pharma (Giza, Egypt) in accordance with the reported high‐performance liquid chromatography (HPLC) method.[ 10 ] Tween 80 and SDS were purchased from El Nasr Chemical Company (Abu‐Zabaal, Cairo, Egypt) while, cetyl trimethyl ammonium bromide (CTAB) was purchased from Danochemo (Copenhagen, Denmark). Aqueous solutions of SDS, CTAB and Tween 80 were produced as 2.00% w/v, 2.00% w/v and 2.00% v/v, respectively. Analytical grade methanol, ethanol, acetonitrile, acetone and propyl alcohol were obtained from El Nasr Chemical Company (Abu‐Zabaal, Cairo, Egypt). Plasma samples were obtained from the National Blood Bank in Egypt and were kept in the refrigerator at −20°Ϲ. Distilled water was obtained from Nahda University Laboratory, Beni Suef, Egypt.
2.3. Pharmaceutical dosage form
Remdesivir‐Rameda® lyophilized powder (claimed 100.00 mg/vial for intravenous injection, batch no. 203242) (Rameda Pharmaceuticals Company, Giza, Egypt) was obtained from the local market.
2.4. Standard solutions
REM stock standard solution of 1.00 mg/mL was obtained by weighing 100.00 mg in an 100‐mL volumetric flask, then shaking well with 20.00 mL ethanol. Finally distilled water has been added up to the mark. A working standard solution of 10.00 μg/mL REM was developed by serial dilutions using distilled water as diluting solvent.
2.5. General analytical procedures
For the first method, aliquots of REM working solutions were used to prepare serial dilutions ranging from 10.00 to 500.00 ng/mL into a series of 10‐mL volumetric flasks using distilled water as diluting solvent. While the second method, 2.5 mL from 2.00% w/v SDS, was first transferred and mixed well then the volumes were made to the mark using distilled water as diluting solvent. For each method, the difference in relative fluorescence intensity (RFI) for each flask was evaluated at 410 nm followed by excitation at 241 nm in comparison to an identically treated blank. The calibration curves were created by plotting RFI versus the concentration of REM in ng/mL and then computing the associated linear regression equations.
2.6. Pharmaceutical formulation analysis
In a 100‐mL volumetric flask, an amount of the lyophilized powder corresponding to 10.0 mg of REM was transferred, shaken well with 20.00 mL distilled water, then the volume was completed to the mark using the same solvent. Working sample solution of 10.00 μg/mL of REM was developed by additional dilutions using distilled water and then the previously mentioned procedures were followed.
2.7. Spiked human plasma samples procedures
Samples of drug‐free human plasma were subjected to Eppendorf tubes, and then spiked with REM stock solution to obtain serial dilutions of 50.00, 100.00, 200.00, 300.00 and 350.00 ng/mL. Acetonitrile was used as a protein denaturation agent by adding 2 mL to each sample, and then the tubes were vortex mixed for 1 min. Samples were centrifuged for 30 min at 4000 rpm. The clear supernatants were isolated and moved to 10‐mL volumetric flasks and warmed on a water path until evaporation of the organic solvent. Residues are reconstituted with water to the mark. Simultaneously, a blank experiment was carried out.
3. RESULTS AND DISCUSSION
REM has a remarkable native fluorescence activity in aqueous solution, therefore, the purpose of this study is to develop green, simple, economical and very sensitive spectrofluorimetric methods for determination of REM in raw material, pharmaceutical formulation and human plasma by studying different factors affecting its fluorescence using cheap available solvents without tedious sample pretreatment and steps compared to reported methods. The first method involves detecting REM's native fluorescence in distilled water at 410 nm followed by excitation at 241 nm (Figure 2). Lately, surfactants have been used to enhance the intensity of drug fluorescence based on the formation of rigid microenvironments that limit fluorophores freedom and increase radiative species.[ 27 , 28 ] Therefore, different surfactants were tested. It was found that 2.00% w/v SDS exhibited favorable enhancement of REM fluorescence intensity compared to other investigated surfactants as well as distilled water (Figure 2), providing instant effect and increasing method sensitivity (method 2).
FIGURE 2.

The fluorescence spectra of 200.00 ng/mL remdesivir (REM), where (A) and (B) are the excitation and emission spectra of its aqueous solution, respectively, (C) and (D) are the excitation and emission spectra of REM in 2.00% w/v sodium dodecyl sulfate (SDS) aqueous solution, respectively, and (E) and (F) are blank excitation and emission
3.1. Experimental parameters optimization
REM fluorescence intensity using SDS has been enhanced by 1.34 times compared to the fluorescence intensity obtained from its aqueous solution. Therefore, several experimental parameters such as; surfactant type, SDS volume, diluting solvent type, interaction time and temperature have been studied and precisely optimized to achieve the optimum conditions for both methods.
3.1.1. Effect of different surfactant
Different surfactants above their CMC concentrations were tested including 2.00% w/v SDS and CTAB and 2.00% v/v Tween 80 as representative examples of anionic, non‐ionic and cationic surfactants, respectively. It was found that CTAB and Tween 80 significantly reduced REM native fluorescence while, SDS imparts obvious fluorescence enhancement (Figure 3). Hence, SDS has been chosen for this study. This might be credited to the ability of SDS negative sulfonyl group to form a complex with the amino group acidic proton of REM. Additionally, decreased collisions and electrostatic attractions between REM molecules as a result of micellar binding play a synergistic role in fluorescence enhancement.[ 29 ]
FIGURE 3.

The effect of different surfactants (2.50 mL of 2.00% w/v or v/v solution of each) on the relative fluorescence intensity of remdesivir (REM) (300.00 ng/mL)
3.1.2. Effect of the SDS volume
The effect of several volumes of 2.00% w/v SDS on fluorescence intensity was investigated. It was discovered that increasing the amount of 2% w/v SDS increased the intensity of REM fluorescence till 1.5 mL, and then the fluorescence intensity held stable till 3.00 mL, as seen in Figure 4. Accordingly, 2.5 mL was selected as the best volume of SDS for further analysis.
FIGURE 4.
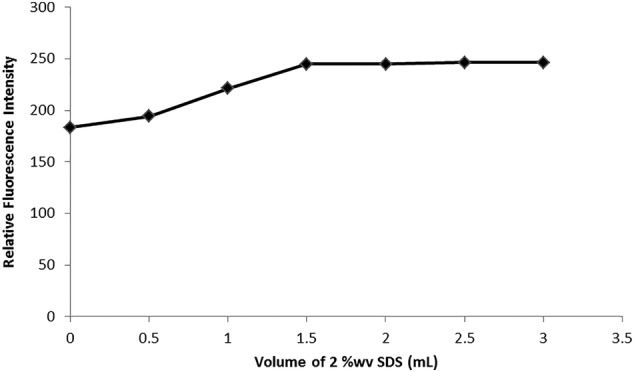
The effect of sodium dodecyl sulfate (SDS) volume (2.00%w/v) on the relative fluorescence intensity of remdesivir (REM) (300.00 ng/mL)
3.1.3. Diluting solvent effect
Several solvents were tested including; distilled water, propyl alcohol, acetonitrile, ethanol, methanol, and acetone. Solutions in water have shown the best results giving several advantages of the developed methods with concern of greenness and low cost (Figures 5 and 6). The great decline of fluorescence intensity in the different studied organic solvents could be due to the denaturation and destructive effect of organics on the formed micelles.
FIGURE 5.

The effect of diluting solvent on the relative fluorescence intensity of remdesivir (REM) (300.00 ng/mL)
FIGURE 6.

The effect of diluting solvent on the relative fluorescence intensity of remdesivir (REM) [300.00 ng/mL in 2.00% w/v solution of sodium dodecyl sulfate (SDS)]
3.1.4. Effect of time
The effects of several incubation durations on REM and SDS were investigated. The intensity of REM fluorescence was enhanced instantly and stayed steady for over 2 h (see Supporting Information, Figure S1).
3.1.5. Temperature effect
A water bath with temperature control was used to study different incubation temperatures (25–100°C) on the reaction between REM and SDS. An inverse proportion was noticed between temperature and fluorescence intensity. It could be interpreted by that the higher internal conversion process has happened by increasing the temperature resulting in the excited singlet state being deactivated in a non‐radiative manner.[ 30 ] Therefore, the experimental investigations were carried out at room temperature.
3.2. Validation of the proposed methods
The proposed methods were successfully validated in accordance with the International Council for Harmonization of Technical Requirements for Pharmaceuticals for Human Use (ICH) and the US Food and Drug Administration (FDA) criteria.[ 31 , 32 ]
3.2.1. Linearity
Linearity ranges have been obtained of 50.00 to 500.00 ng/mL and 10.00 to 350.00 ng/mL for method 1 and method 2, respectively. Linear regression equation parameters are presented in Table 1. The developed approaches were shown to have high correlation coefficients, demonstrating their reliability. Small intercept and slope standard deviations were recorded, indicating limited dispersion of points around the calibration curves.
TABLE 1.
Analytical parameters for determination of remdesivir (REM) by the proposed spectrofluorimetric methods
| Parameters | Method 1 | Method 2 |
|---|---|---|
| Linearity (ng/mL) | 50.00–500.00 | 10.00–350.00 |
| Correlation coefficient (r) | 0.9998 | 0.9999 |
| Determination coefficient (r 2) | 0.9997 | 0.9999 |
| Slope (b) | 0.5906 | 0.8159 |
| Intercept (a) | 6.6705 | 2.7847 |
| Standard deviation of slope | 0.004 | 0.003 |
| Standard deviation of intercept | 1.31 | 0.58 |
| LOD (limit of detection) (ng/mL) | 7.31 | 2.34 |
| LOQ (limit of quantitation) (ng/mL) | 22.15 | 7.10 |
3.2.2. Accuracy
Each technique was tested with three replicates of five distinct REM concentrations covering its linearity range. Regression equations for each method were used for computing concentrations that were given as percentage recovery and the findings demonstrating the established methods' high accuracy (Table 2).
TABLE 2.
Evaluation of the accuracy of the proposed methods in determining remdesivir (REM)
| Parameters | Method 1 | Method 2 | ||||
|---|---|---|---|---|---|---|
| Taken (ng/mL) | Found a (ng/mL) | Recovery (%) | Taken (ng/mL) | Found a (ng/mL) | Recovery (%) | |
| 1 | 100.00 | 99.42 | 99.41 | 40 | 40.83 | 102.10 |
| 2 | 200.00 | 201.81 | 100.90 | 70 | 71.69 | 102.41 |
| 3 | 250.00 | 252.44 | 100.97 | 120 | 120.72 | 100.60 |
| 4 | 300.00 | 301.64 | 100.54 | 200 | 200.14 | 100.10 |
| 5 | 500.00 | 493.82 | 98.76 | 300 | 299.45 | 99.81 |
| Mean | 100.12 | 100.99 | ||||
| Standard deviation | 0.98 | 1.18 | ||||
| Percent relative standard deviation | 0.98 | 1.20 | ||||
Average of three determinations.
3.2.3. Precision
Intra‐day (repeatability) and inter‐day studies have been used to determine precision. Three different REM concentrations within the linearity range representing the low, mid and high ranges (100.00, 200.00 and 300.00 ng/mL for method 1 and 40.00, 120.00 and 200.00 ng/mL for method 2) have been investigated as triplicates. Relative standard deviations (RSDs) were computed and found to be less than 2.00% demonstrating the precision of the developed methods (Table 3).
TABLE 3.
Precision study for the developed methods
| Parameters | Method 1 | Method 2 | |||||
|---|---|---|---|---|---|---|---|
| 100.00 ng/mL | 200.00 ng/mL | 300.00 ng/mL | 40.00 ng/mL | 120.00 ng/mL | 200.00 ng/mL | ||
| Intra‐day | 1 | 98.70 | 101.15 | 101.64 | 101.77 | 100.67 | 99.73 |
| 2 | 99.71 | 100.23 | 99.44 | 102.51 | 100.27 | 100.23 | |
| 3 | 99.83 | 101.32 | 100.55 | 101.96 | 100.86 | 100.24 | |
| Mean | 99.41 | 100.90 | 100.54 | 102.10 | 100.60 | 100.10 | |
| SD | 0.62 | 0.58 | 1.10 | 0.38 | 0.29 | 0.29 | |
| %RSD | 0.63 | 0.58 | 1.10 | 0.37 | 0.29 | 0.29 | |
| Inter‐day | 1 | 99.83 | 100.23 | 100.55 | 101.77 | 100.67 | 99.73 |
| 2 | 101.90 | 99.75 | 99.77 | 100.97 | 100.10 | 99.10 | |
| 3 | 99.90 | 97.97 | 97.99 | 101.58 | 99.86 | 98.85 | |
| Mean | 100.52 | 98.86 | 99.44 | 101.44 | 100.20 | 99.22 | |
| SD | 1.16 | 1.27 | 1.31 | 0.42 | 0.42 | 0.45 | |
| %RSD | 1.15 | 1.27 | 1.32 | 0.41 | 0.42 | 0.46 | |
SD, standard deviation; %RSD, percent relative standard deviation.
3.2.4. Sensitivity
Sensitivity was evaluated through determination of limit of detection (LOD) and limit of quantitation (LOQ). Intercept standard deviation (σ) and slope (b) for each method were exploited for calculation of both LOD; (3.3*σ)/Slope and LOQ; (10*σ)/Slope. The obtained LOD and LOQ were 7.30 and 22.14 ng/mL for method 1 and 2.34 and 7.09 ng/mL for method 2, demonstrating the good sensitivity developed by the methods (Table 1).
3.2.5. Robustness
Robustness represents the capacity of the methods to stay unaffected upon small but deliberate variations in the experimental variables. The proposed methods have the advantage of being very simple, so only one variable (2.00% w/v SDS) for method 2 needed to be evaluated. Small changes were made in SDS volume (2.5 ± 0.3 mL) and it was observed that this variation had no discernible influence on the intensity of REM fluorescence as RSD values were 0.97 and 1.02 for 2.2 and 2.8 mL, respectively, proving the robustness of the proposed method.
3.3. Application to pharmaceutical formulation
Upon application of the developed methods to REM vials, good recoveries were obtained that have shown no significant differences by comparing with the other reported method[ 10 ] using student t‐test and F‐test at 95% confidence level (Table 4). The accuracy of the developed methods was further tested using a standard addition technique. The previously examined dosage form solutions were spiked with three different standard concentrations of REM. Total drug concentrations were quantified and satisfactory results were obtained, revealing the developed methods' great accuracy (Table 4).
TABLE 4.
Evaluation of remdesivir (REM) in its pharmaceutical formulation by the developed spectrofluorimetric methods with application of standard addition technique, and statistical comparison of the obtained results using the reported high‐performance liquid chromatography (HPLC) method[ 10 ]
| Pharmaceutical formulation | Methods | Found a (% ± SD) | Standard addition technique | Reported method a | t‐Test c | F‐ Test c | |
|---|---|---|---|---|---|---|---|
| Added (ng/mL) | Recovery (%) b | ||||||
| Remdesivir‐Rameda® for intravenous injection (100 ng/mL) | Method 1 | 101.10 ± 0.60 | 50 | 99.41 | 100.68 ± 0.61 | 1.077 | 1.039 |
| 100 | 99.91 | ||||||
| 200 | 98.48 | ||||||
| Mean (% ± standard deviation) | 99.27 ± 0.72 | ||||||
| Method 2 | 100.27 ± 0.90 | 50 | 99.22 | 0.831 | 2.139 | ||
| 100 | 99.84 | ||||||
| 200 | 99.01 | ||||||
| Mean (% ± standard deviation) | 99.36 ± 0.42 | ||||||
Mean of five determinations.
Mean of three determinations.
The tabulated values of t‐test and F‐test at 0.05% are 2.306 and 6.388, respectively.
3.4. Application to spiked human plasma
It has been evidenced that plasma components have much less interfering effect and REM has shown excellent recoveries and hence high sensitivity (see Figure S2 and Table 5).
TABLE 5.
Application of the proposed methods to spiked human plasma samples
| Parameters | Taken (ng/mL) | Method 1 | Method 2 | ||
|---|---|---|---|---|---|
| Found a (ng/mL) | Recovery (%) | Found a (ng/mL) | Recovery (%) | ||
| 1 | 50.00 | 49.87 | 99.74 | 49.18 | 98.37 |
| 2 | 100.00 | 99.27 | 99.27 | 98.87 | 98.87 |
| 3 | 200.00 | 197.25 | 98.62 | 198.22 | 99.11 |
| 4 | 300.00 | 295.73 | 98.57 | 295.42 | 98.47 |
| 5 | 350.00 | 341.78 | 97.65 | 347.17 | 99.19 |
| Mean | 98.77 | 98.80 | |||
| Standard deviation | 0.79 | 0.37 | |||
| Percent relative standard deviation | 0.80 | 0.37 | |||
Average of three determinations.
3.5. Greenness assessment of the proposed method
Currently, development of green methods is just as crucial as its sensitivity. It ensures that human and environmental elements are protected from chemical harm and dangerous effects. The analytical approach is deemed ultimately green by eliminating the use of harmful hazardous solvents, derivatization operations, energy use, and waste. The use of specialist tools to assess the greenness of established analytical procedures is strongly advised. In order to analyze the greenness of the developed spectroflourimetric methods, the greenness profile and eco‐scale approach were studied.[ 33 , 34 ]
3.5.1. Greenness profile of the developed methods
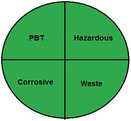
The developed methods greenness profile was evaluated in accordance with National Environmental Method Index (NEMI).[ 33 ] The pictograms showed that the developed methods fit all of the requirements for being classified as a green method (Table 6). Water and SDS utilized in the developed methods were considered non‐persistent, bio‐accumulative and toxic solvents (PBT). The pH of the developed methods was around 7 and the waste cannot exceed 50 mg or mL in volume. As a result of these factors, the developed spectrofluorimetric methods passed all four of the greenness profile quadrants and were deemed environmentally green.
TABLE 6.
Greenness assessment of the proposed methods by analytical eco‐scale and NEMI
| Eco‐scale | NEMI pictogram | ||||
|---|---|---|---|---|---|
| Parameters | Method 1 | Method 2 | Method 1 | Method 2 | |
| Penalty points | Penalty points | ||||
| Reagents | Water | 0 | 0 |
|

|
| SDS | — | 0 | |||
| Instrument | 1 | 1 | |||
| Occupational hazard | 0 | 0 | |||
| Waste | 6 | 6 | |||
| Total penalty points | 7 | 7 | |||
| Analytical eco‐scale score | 93 | 93 | |||
NEMI, National Environmental Method Index; SDS, sodium dodecyl sulfate; PBT, non‐persistent, bio‐accumulative and toxic solvents.
3.5.2. Analytical eco‐scale
The score of the eco‐scale is calculated by assigning penalty points to all of the elements of the approved methods, including the amount of reagents, consumption of energy, occupational hazards, and the amount of waste according to the following equation (score of eco‐scale = 100 − total penalty).[ 34 ] The analytical approach is considered exceptional green if the score is more than 75. Both developed spectrofluorimetric methods received an eco‐scale score of 93, indicating the excellent greenness of the developed methods (Table 6).
4. CONCLUSION
New, green, sensitive, accurate and simple spectrofluorimetric methods have been established and fully validated for REM determination in raw material, pharmaceutical formulation and biological fluids. The first technique depends on its native fluorescence with studying different factors affecting its fluorescence. However, the second method relies on the use of anionic surfactant SDS to enhance REM native fluorescence intensity. They have the advantages of being rapid, non‐pollutant and cost‐effective compared with other reported methods that require sophisticated instruments and well‐trained personnel. They can be used in daily quality control laboratories for the successful determination of REM in its vial formulation and human plasma.
Supporting information
Figure S1: The effect of reaction time on the relative fluorescence intensity of the reaction product between REM (300 ng/mL) and SDS (2% w/v).
Figure S2: The fluorescence spectra of spiked human plasma with REM (200.00) ng/mL, where: (A) and (B) are the excitation and emission spectra of REM aqueous solution, respectively, (C) and (D) are the excitation and emission spectra of REM aqueous solution in 2.00% w/v SDS, respectively and (E) and (F) are plasma blank excitation and emission.
Attia T. Z., Boushra J. M., Abdel Hakiem A. F., Lashien A. S., Noureldeen D. A. M., Luminescence 2022, 37(7), 1192. 10.1002/bio.4274
REFERENCES
- 1. World Health Organization , 2022. COVID‐19 Weekly Epidemiological Update, 5 April 2022. https://www.who.int/docs/default-source/coronaviruse/situation-reports/20220405_weekly_epi_update_86.pdf?sfvrsn=3f01a460_4&download=true
- 2. Wise J., Covid‐19: The E484K mutation and the risks it poses, British Medical Journal Publishing Group, London, UK: 2021. [DOI] [PubMed] [Google Scholar]
- 3. Scavone C., Mascolo A., Rafaniello C., Sportiello L., Trama U., Zoccoli A., Bernardi F. F., Racagni G., Berrino L., Castaldo G., Coscioni E., Rossi F., Capuano A., Brit. J. Pharmacol. 2022, 179(10), 2128. 10.1111/bph.15452 [DOI] [PMC free article] [PubMed] [Google Scholar]
- 4. Eastman R. T., Roth J. S., Brimacombe K. R., Simeonov A., Shen M., Patnaik S., Hall M. D., ACS Cent. Sci. 2020, 6, 672. [DOI] [PMC free article] [PubMed] [Google Scholar]
- 5. Gordon C. J., Tchesnokov E. P., Woolner E., Perry J. K., Feng J. Y., Porter D. P., Götte M., J. Biol. Chem. 2020, 295, 6785. [DOI] [PMC free article] [PubMed] [Google Scholar]
- 6. Agostini M. L., Andres E. L., Sims A. C., Graham R. L., Sheahan T. P., Lu X., Smith E. C., Case J. B., Feng J. Y., Jordan R., Ray A. S., MBio 2018, 9(2), e00221. 10.1128/mBio.00221-18 [DOI] [PMC free article] [PubMed] [Google Scholar]
- 7. Lo M. K., Feldmann F., Gary J. M., Jordan R., Bannister R., Cronin J., Patel N. R., Klena J. D., Nichol S. T., Cihlar T., Zaki S. R., Sci. Transl. Med. 2019, 11(494), eaau9242. 10.1126/scitranslmed.aau9242 [DOI] [PMC free article] [PubMed] [Google Scholar]
- 8. Lamb Y. N., Drugs. 2020, 1(80), 1355. [DOI] [PMC free article] [PubMed] [Google Scholar]
- 9. Nguyen R., Goodell J. C., Shankarappa P. S., Zimmerman S., Yin T., Peer C. J., Figg W. D., J. Chromatogr., B 2021, 1171, 122641. [DOI] [PMC free article] [PubMed] [Google Scholar]
- 10. Pasupuleti R. R., Tsai P. C., Ponnusamy V. K., Pugazhendhi A., Process Biochem. 2021, 102, 150. [DOI] [PMC free article] [PubMed] [Google Scholar]
- 11. Avataneo V., De Nicolò A., Cusato J., Antonucci M., Manca A., Palermiti A., Waitt C., Walimbwa S., Lamorde M., Di Perri G., D'Avolio A., J. Antimicrob. Chemother. 2020, 75, 1772. [DOI] [PMC free article] [PubMed] [Google Scholar]
- 12. Alvarez J.‐C., Moine P., Etting I., Annane D., Larabi I. A., Clin. Chem. Lab. Med. (CCLM) 2020, 58(9), 1461. [DOI] [PubMed] [Google Scholar]
- 13. Xiao D., John Ling K. H., Tarnowski T., Humeniuk R., German P., Mathias A., Chu J., Chen Y. S., van Ingen E., Anal. Biochem. 2021, 617, 114118. [DOI] [PMC free article] [PubMed] [Google Scholar]
- 14. Noureldeen D. A., Boushra J. M., Lashien A. S., Hakiem A. F. A., Attia T. Z., Microchem. J. 2022, 174, 107101. [DOI] [PMC free article] [PubMed] [Google Scholar]
- 15. Tkach V. V., Kushnir М. V., de Oliveira S. C., Ivanushko J. G., Velyka A. V., Molodianu A. F., Yagodynets P. I., Kormosh Z. O., Vaz dos Reis L., Luganska O. V., Palamarek K. V., Biointerface Res. Appl. Chem. 2021, 11, 9201. [Google Scholar]
- 16. Omar M. A., Abdel‐Lateef M. A., Ali R., Derayea S. M., J. Lumin. 2018, 33, 1249. [DOI] [PubMed] [Google Scholar]
- 17. Abdel‐Lateef M. A., Ali R., Omar M. A., Derayea S. M., RSC Adv. 2019, 9, 34256. [DOI] [PMC free article] [PubMed] [Google Scholar]
- 18. Abdel‐Lateef M. A., Almahri A., Derayea S. M., Samir E., Rev. Anal. Chem. 2020, 39, 222. [Google Scholar]
- 19. Abdel‐Lateef M. A., Almahri A., Chem. Pap. 2022, 76, 741. [Google Scholar]
- 20. Elmansi H., Ibrahim A. E., Mikhail I. E., Belal F., Anal. Methods 2021, 13(23), 2596. 10.1039/D1AY00469G [DOI] [PubMed] [Google Scholar]
- 21. Esteve‐Romero J., Simó‐Alfonso E. F., Garcia‐Alvarez‐Coque M. C., Ramis‐Ramos G., Trends. Analyt. Chem. TRAC. 1995, 14, 29. [Google Scholar]
- 22. Aydın B. M., Aydin B., Acar M., Arik M., Onganer Y., Dyes Pigm. 2009, 81, 156. [Google Scholar]
- 23. Yang H.‐M., Wang Y. S., Li J. H., Li G. R., Wang Y., Tan X., Xue J. H., Xiao X. L., Kang R. H., Anal. Chim. Acta 2009, 636, 51. [DOI] [PubMed] [Google Scholar]
- 24. Abdel‐Lateef M. A., Almahri A., Spectrochim. Acta a Mol. Biomol. Spectrosc. 2021, 258, 119806. [DOI] [PubMed] [Google Scholar]
- 25. Abdel‐Lateef M. A., Ali R., Omar M. A., Derayea S. M., J. Lumin. 2020, 35, 486. [DOI] [PubMed] [Google Scholar]
- 26. Abdel‐Lateef M. A., Omar M. A., Ali R., Derayea S. M., Spectrochim. Acta a Mol. Biomol. Spectrosc. 2019, 206, 57. [DOI] [PubMed] [Google Scholar]
- 27. McLntire G. L., Dorsey J. G., Crit. Rev. Anal. Chem. 1990, 21, 257. [Google Scholar]
- 28. Hinze W. L., Singh H. N., Baba Y., Harvey N. G., Trends. Analyt. Chem. TRAC. 1984, 3, 193. [Google Scholar]
- 29. Alarfaj N. A., El‐Tohamy M. F., J. Lumin. 2013, 28, 190. [DOI] [PubMed] [Google Scholar]
- 30. Skoog D. A., West D. M., Holler F. J., Crouch S. R., Fundamentals of analytical chemistry, Cengage Learning, Philadelphia, USA: 2013. [Google Scholar]
- 31. ICH, I , Q2 (R1) : Validation of analytical procedures: text and methodology, in International Conference on Harmonization, Geneva, Switzerland, 2005. [Google Scholar]
- 32. Food and Drug Administration , Bioanalytical method validation. http://www.fda.gov/cder/guidance/4252fnl.pdf, 2001.
- 33. Keith L. H., Gron L. U., Young J. L., Chem. Rev. 2007, 107, 2695. [DOI] [PubMed] [Google Scholar]
- 34. Van Aken K., Strekowski L., Patiny L., Beilstein J., Org. Chem. 2006, 2, 3. [DOI] [PMC free article] [PubMed] [Google Scholar]
Associated Data
This section collects any data citations, data availability statements, or supplementary materials included in this article.
Supplementary Materials
Figure S1: The effect of reaction time on the relative fluorescence intensity of the reaction product between REM (300 ng/mL) and SDS (2% w/v).
Figure S2: The fluorescence spectra of spiked human plasma with REM (200.00) ng/mL, where: (A) and (B) are the excitation and emission spectra of REM aqueous solution, respectively, (C) and (D) are the excitation and emission spectra of REM aqueous solution in 2.00% w/v SDS, respectively and (E) and (F) are plasma blank excitation and emission.