
Figure 2.
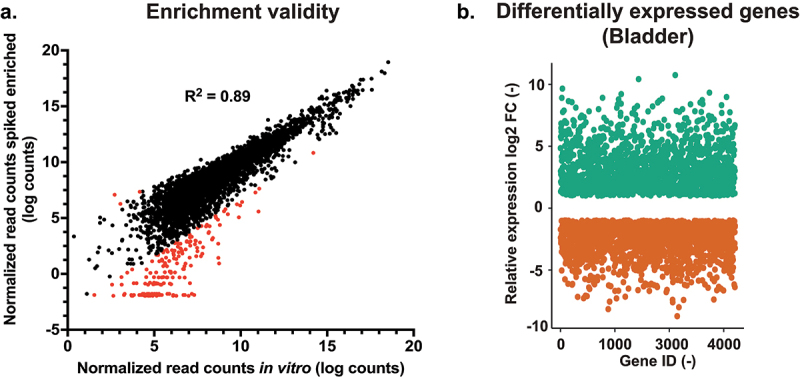
RNA enrichment validity and differential expression between in vivo and in vitro conditions. (a) Quality of enrichment was assessed by correlating the normalized read counts of the enriched in vitro samples (enriched from a mix with RNA from a non-infected kidney) and the non-enriched in vitro samples. Red-labelled data points indicate enrichment bias. (b) Differential expression diagram: more than 1000 genes are up- and downregulated (Log2(fc) ≥1 and ≤1) compared to in vitro conditions. FC: fold-change.