

Abstract
Background
Incidence of drug poisoning deaths has increased during the coronavirus disease 2019 (COVID‐19) pandemic. Previous research has established that risks differ for drug poisoning death according to occupation, and that workers also have a different risk for exposure to and death from COVID‐19. This study sought to determine whether workers in certain occupations had drug poisoning mortality rates that increased in 2020 (the first year of the COVID‐19 pandemic) compared to the average mortality rate for workers in those occupations during the previous 3 years.
Methods
Death certificates of Massachusetts residents who died from drug poisonings in 2017–2020 were obtained. Average mortality rates of drug poisoning according to occupation during the 2017–2019 period were compared to mortality rates in 2020.
Results
Between the 2017–2019 period and 2020, mortality rates of drug poisoning increased significantly for workers in three occupational groups: food preparation and serving; healthcare support; and transportation and material moving. In these occupations, most of the increases in 2020 compared to 2017–2019 occurred in months after COVID‐19 pandemic cases and deaths increased in Massachusetts.
Conclusion
Mortality rates from drug poisonings increased substantially in several occupations in 2020 compared to previous years. Further research should examine the role of occupational factors in this increase in drug poisoning mortality rates during the COVID‐19 pandemic. Particular attention should be given to determine the role that exposure to severe acute respiratory syndrome coronavirus 2, work stress, and financial stress due to job insecurity played in these increases.
Keywords: COVID‐19, mortality, occupation, opioids
1. INTRODUCTION
Although overdose deaths have been increasing since the late 90s, in recent years the increasing trend had begun to plateau. 1 This plateauing reversed during the coronavirus disease 2019 (COVID‐19) pandemic, when drug overdose mortality increased, primarily driven by opioid‐related overdoses. 2 Overdose deaths increased most drastically in the months following the implementation of nationwide lockdowns. 3 The timing of the increase suggests that the pandemic itself, the effects of lockdowns, and the associated economic downturn may have been important causative factors in the increases in drug overdose deaths.
Workers in different occupations have a different risk for opioid and other drug‐related deaths. This risk has been found to be especially elevated among manual, blue‐collar workers. 4 , 5 , 6 , 7 , 8 , 9 , 10 , 11 Nationally, workers in six occupations were found to have significantly elevated proportional mortality ratios for opioid poisonings: construction; extraction; food preparation and serving; healthcare practitioners; healthcare support; and personal care and service. 5 In Massachusetts, workers in nine occupations were found to have significantly elevated opioid‐related mortality rates: construction and extraction; farming, fishing, and forestry; material moving; installation, maintenance, and repair; transportation; production; food preparation and serving related; building and grounds cleaning and maintenance; and healthcare support occupations. 4 In the Massachusetts study, construction and extraction and farming, fishing, and forestry workers stood out as having opioid‐related mortality rates over five times higher than the average for all workers. 4 With respect to trends in opioid‐related mortality, in Massachusetts workers in almost all occupations, were found to have increased rates. Some occupations had notably high trends. For example, farming, fishing, and forestry workers had an average annual percent change (AAPC) in mortality rates between 2000 and 2015 of 9.9%, and food preparation and serving workers had an AAPC of 8.2%. 4 A variety of factors have been suggested to contribute to the differential risk for opioid and other drug poisoning deaths by occupation including work‐related pain, 12 , 13 occupational injuries, 4 , 14 , 15 , 16 , 17 and job insecurity. 18
During the pandemic, increases in drug overdose deaths may be different for workers in different occupations. Stress from exposure to severe acute respiratory syndrome coronavirus 2 (SARS‐CoV‐2), seeing co‐workers sick with the disease, and the risk of exposing family and friends to the disease may contribute to these increases. Workers in certain occupations including healthcare; transportation; services; cleaning; and public safety were shown to be at high risk for contracting COVID‐19 in the early days of the pandemic. 19 , 20 Additionally, certain occupations were shown to be at an elevated risk for exposure to infections like SARS‐CoV‐2 including healthcare, service, and transportation workers. 21 Because workers of color, particularly Black and Hispanic workers are more likely to be employed in occupations with a high risk of exposure to infections like SARS‐CoV‐2, occupational exposures may be an important contributor to the disproportionate impact of COVID‐19 on people of color. 22 Furthermore, communities with more workers employed in occupations and industries with a high risk for infection tend to have higher rates of COVID‐19. 23 , 24 , 25 Studies from the United States and other countries suggest that many of these same occupations have had an elevated risk for COVID‐19 mortality. 26 , 27 , 28 , 29
Differential risks for drug overdose death according to occupation during the pandemic may also be due to unemployment or the threat of unemployment. The fear of losing work during the economically precarious situation of the pandemic may have increased the risk of drug overdose death due to increases in job insecurity. 18 Nationally, unemployment increased drastically in 2020, from less than 4% before the pandemic to over 14% at its peak in April, after which unemployment declined quickly, but did not return to its pre‐pandemic levels. 30 In Massachusetts, unemployment followed a similar pattern, however, the peak in Massachusetts in April was slightly higher at 16%. 31 As previously mentioned, being unemployed or not in the labor force may be a risk factor for drug overdose death. 32 , 33 , 34 Additionally, the risk of a drug overdose may have been impacted by changes in the risk of occupational injuries, a likely risk factor for opioid use, 4 , 9 , 12 , 13 , 14 , 15 , 16 , 17 , 18 among essential workers due to working more hours and having heavier workloads.
This study sought to determine whether workers in certain occupations had drug poisoning mortality rates that increased during 2020 (the first year of the COVID‐19 pandemic) compared to the average mortality rate for workers in those occupations during the previous 3 years (2017–2019). Among occupations with increases in drug poisoning deaths, we also examine the monthly trends in mortality to observe whether any increases occurred more during the months after widespread of COVID‐19 in Massachusetts.
2. METHODS
Death certificate data for all deaths occurring in Massachusetts from 2017 to 2020 were obtained from the Massachusetts Registry of Vital Records and Statistics. Deaths involving drug poisoning were identified by selecting deaths that had any of the following International Classification of Diseases (Tenth Revision) (ICD‐10) codes as the underlying cause of death: X40–X45, Y10–Y15, Y45, Y47, and Y49. These ICD‐10 codes correspond to unintentional poisonings. Table S1 provides details about the substances categorized by these codes. We have used a wide definition of poisonings to capture the deaths from a wide variety of substances. This same definition has been previously utilized especially in the literature examining “deaths of despair,” which have been contributing to increased mortality, of which drug poisonings are the cause of death with the highest number. 7 , 9 , 10 , 35 , 36
Specific variables obtained from death certificates included cause(s) of death, year of death, usual occupation, usual industry, age, sex, educational attainment, and race/ethnicity. Death certificate occupation and industry data refer to the “usual” occupation and industry of the decedent, meaning the occupation and industry that they tended to work during their life. They may not have necessarily been working in these industries and occupations at the time of death. 37 In this analysis, we assumed that this usual occupation represented the occupation they were working at the time of death. Deaths were restricted to those occurring to MA residents between the ages of 16 and 64. Anyone with usual occupation or industry information that indicated that they were unemployed or not in the labor force was excluded.
Information about usual occupation and industry from the death certificate was coded using the National Institute for Occupational Safety and Health (NIOSH) Industry and Occupation Computerized Coding System (NIOCCS). Occupations were categorized using the 2012 Major Occupation Census Codes. Data about the number of workers employed in Massachusetts according to occupation, age, sex, educational attainment, and race/ethnicity were obtained from the 2017 to 2020 Massachusetts American Community Survey. 38 These numbers were matched with the death counts to compute mortality rates.
We computed numbers, percentage, and average annual mortality rates according to usual occupation, age, sex, race/ethnicity, and educational attainment stratified according to deaths that occurred in 2017–2019 and deaths occurring in 2020. To determine whether changes in rates between 2017–2019 and 2020 were significantly different according to occupation, we constructed Poisson regression models using SAS version 9.3. In these models, we computed the interaction between occupation and time period (2017–2019 vs. 2020). The number of workers was treated as an offset. In the model, for each usual occupation, the exponent of the interaction term (the rate ratio) represented how many times more or less the change in rates between the two time periods was for that particular usual occupation compared with the change for all other workers. No other variables were included in these models. Example SAS code is shown in Figure S1. We also examined mortality rates by month in 2020 compared with the average annual monthly mortality rates during the 2017–2019 period for all workers and for workers in occupations with a significant increase in mortality rates.
2.1. Sensitivity analysis
Because of the rapid increases in unemployment in 2020 and the fact that in many cases this unemployment would not be reflected on death certificates, we examine whether there were significant differences in changes in mortality rates when 2019 employment data was used as the denominator to calculate mortality rates. We performed this analysis using the same parameters described above for calculating rate ratios by occupation.
3. RESULTS
As shown in Table 1, between 2017–2019 and 2020 the mortality rate for drug poisonings increased slightly in Massachusetts from 48.8 deaths per 100,000 worker years (95% confidence interval [CI]: 47.4–50.1) to 50.0 (95% CI: 47.6–52.4). Mortality rates declined among workers aged 16–34 and 45–54. The decline for workers aged 25–34 was statistically significant. The mortality rate increased statistically significantly by 30% for those between the ages of 35–44. Mortality rates were also highest among workers in the 35–44 age group in 2020. There was a slight increase in drug poisoning mortality for those aged 55–64. Mortality rates were over three times higher among males compared to females in both time periods. Rates did not change dramatically between the two time periods for either males or females. During the 2017–2019 time period, mortality rates were highest among Hispanic and White, non‐Hispanic workers. In 2020, mortality rates increased substantially for Black, non‐Hispanic workers resulting in mortality rates higher than those of White, non‐Hispanic workers and nearly as high as rates among Hispanic workers. During both time periods, mortality rates were multiple times higher among those with a high school education or less compared to those with some college or more. Rates increased nonsignificantly among workers with a high school education or less and decreased non‐significantly for those with some college education or more.
Table 1.
Number and mortality rate of drug poisoning deaths according to age, sex, race/ethnicity, and educational attainment among Massachusetts working residents, 2017–2019 compared with 2020
| 2017–2019 | 2020 | |||||||
|---|---|---|---|---|---|---|---|---|
| Age group | n (%) | Worker‐years | Deaths per 100,000 worker‐years (95% CI) | n (%) | Worker‐years | Deaths per 100,000 worker‐years (95% CI) | Rate ratio (95% CI)1 | P value |
| 16–24 | 268 (5.4) | 1,416,490 | 18.9 (16.7–21.2) | 60 (3.7) | 406,299 | 14.8 (11.0–18.5) | 0.76 (0.57–1.02) | 0.0600 |
| 25–34 | 1504 (30.3) | 2,444,062 | 61.5 (58.4–64.6) | 428 (26.4) | 816,311 | 52.4 (47.5–57.4) | 0.78 (0.68–88) | <0.0001 |
| 35–44 | 1294 (26.1) | 2,100,321 | 61.6 (58.3–65.0) | 523 (32.2) | 690,431 | 75.7 (69.3–82.2) | 1.30 (1.15–1.47) | <0.0001 |
| 45–54 | 1144 (23.0) | 2,247,506 | 50.9 (48–53.9) | 343 (21.1) | 687,129 | 49.9 (44.6–55.2) | 0.94 (0.82–1.08) | 0.4121 |
| 55–64 | 754 (15.2) | 1,967,806 | 38.3 (35.6–41.1) | 268 (16.5) | 643,865 | 41.6 (36.6–46.6) | 1.07 (0.92–1.25) | 0.3841 |
| Sex | ||||||||
| Female | 1067 (21.5) | 5,026,977 | 21.2 (20.0–22.5) | 383 (23.6) | 1,610,089 | 23.7 (21.3–26.1) | 1.11 (0.98–1.27) | 0.1100 |
| Male | 3897 (78.5) | 5,149,208 | 75.7 (73.3–78.1) | 1,240 (76.4) | 1,633,946 | 75.9 (71.7–80.1) | 0.90 (0.79–1.02) | 0.1100 |
| Race/ethnicity | ||||||||
| American Indian/Alaska Native/Other, non‐Hispanic | 64 (1.3) | 281,396 | 22.7 (17.2–28.3) | 26 (1.6) | 139,662 | 18.6 (11.5–25.8) | 0.79 (0.50–1.25) | 0.3104 |
| Asian, non‐Hispanic | 38 (0.8) | 721,852 | 5.3 (3.6–6.9) | 17 (1.0) | 252,996 | 6.7 (3.5–9.9) | 1.24 (0.70–2.20) | 0.4642 |
| Black, non‐Hispanic | 248 (5.0) | 717,767 | 34.6 (30.3–38.9) | 120 (7.4) | 205,565 | 58.4 (47.9–68.8) | 1.70 (1.36–2.14) | <0.0001 |
| Hispanic | 599 (12.1) | 1,140,889 | 52.5 (48.3–56.7) | 229 (14.1) | 368,427 | 62.2 (54.1–70.2) | 1.18 (1.00–1.39) | 0.0469 |
| White, non‐Hispanic | 4015 (80.9) | 7,314,281 | 54.9 (53.2–56.6) | 1,230 (75.8) | 2,277,385 | 54.0 (51.0–57.0) | 0.80 (0.70–0.92) | 0.0015 |
| Educational attainment | ||||||||
| High school or less | 3599 (72.5) | 2,820,673 | 127.6 (123.4–131.8) | 1,159 (71.5) | 802,831 | 144.4 (136.1–152.7) | 1.11 (0.98–1.25) | 0.1092 |
| Some college or more | 1365 (27.5) | 7,355,512 | 18.6 (17.6–19.5) | 463 (28.5) | 2,441,204 | 19.0 (17.2–20.7) | 0.90 (0.80–1.02) | 0.1092 |
| Total | 4964 | 10,176,185 | 48.8 (47.4–50.1) | 1,622 | 3,244,035 | 50.0 (47.6–52.4) | ||
Note: Bold indicates rate ratios with a p value less than 0.05.
Abbreviation: CI, confidence interval.
Reference group is all other workers.
As shown in Table 2, during both time periods, workers in several occupations had mortality rates higher than the average for all workers including construction and extraction; farming, forestry, and fishing; installation, repair, and maintenance; building and grounds cleaning and maintenance; food preparation and serving related; transportation and material moving; production; and personal care and services. These occupations are consistent with occupations that have been documented to have elevated rates of drug poisoning or overdose deaths in Massachusetts in previous studies. 4 , 7
Table 2.
Drug poisoning mortality rates according to occupation among Massachusetts working residents 2017–2019 compared to 2020
| 2017–2019 | 2020 | |||||||
|---|---|---|---|---|---|---|---|---|
| Occupation | n (%) | Worker‐years | Deaths per 100,000 worker‐years (95% CI) | n (%) | Worker‐years | Deaths per 100,000 worker‐years (95% CI) | Rate ratio (95% CI)1, 2 | p value |
| Architecture and engineering | 44 (0.9) | 246,605 | 17.8 (12.6–23.1) | 9 (0.6) | 88,304 | 10.2 (3.5–16.9) | 0.55 (0.27–1.14) | 0.1073 |
| Arts, design, entertainment, sports, and media | 75 (1.5) | 241,911 | 31.0 (24.0–38.0) | 26 (1.6) | 79,140 | 32.9 (20.2–45.5) | 1.03 (0.66–1.62) | 0.8836 |
| Building and grounds cleaning and maintenance | 297 (6.0) | 335,982 | 88.4 (78.3–98.5) | 107 (6.6) | 97,212 | 110.1 (89.2–130.9) | 1.23 (0.98–1.54) | 0.0797 |
| Business and financial operations | 69 (1.4) | 664,448 | 10.4 (7.9–12.8) | 26 (1.6) | 237,745 | 10.9 (6.7–15.1) | 1.02 (0.65–1.61) | 0.9291 |
| Community and social services | 74 (1.5) | 214,122 | 34.6 (26.7–42.4) | 19 (1.2) | 71,302 | 26.6 (14.7–38.6) | 0.75 (0.45–1.24) | 0.2643 |
| Computer and mathematical | 41 (0.8) | 468,484 | 8.8 (6.1–11.4) | 10 (0.6) | 166,569 | 6.0 (2.3–9.7) | 0.66 (0.33–1.33) | 0.2474 |
| Construction and extraction | 1286 (25.9) | 462,312 | 278.2 (263.0–293.44) | 391 (24.1) | 132,979 | 294.0 (264.9–323.2) | 1.01 (0.89–1.15) | 0.8637 |
| Education, training, and library | 49 (1.0) | 722,244 | 6.8 (4.9–8.7) | 12 (0.7) | 252,789 | 4.7 (2.1–7.4) | 0.68 (0.36–1.27) | 0.2257 |
| Farming, forestry, and fishing | 71 (1.4) | 22,855 | 310.7 (238.4–382.9) | 17 (1.0) | 8,401 | 202.4 (106.2–298.6) | 0.63 (0.37–1.08) | 0.0920 |
| Food preparation and serving | 517 (10.4) | 565,887 | 91.4 (83.5–99.2) | 177 (10.9) | 133,304 | 132.8 (113.2–152.3) | 1.45 (1.21–1.73) | <0.0001 |
| Healthcare practitioners and technical | 101 (2.0) | 693,402 | 14.6 (11.7–17.4) | 33 (2.0) | 221,900 | 14.9 (9.8–19.9) | 1.00 (0.67–1.48) | 0.9835 |
| Healthcare support | 133 (2.7) | 334,101 | 39.8 (33.0–46.6) | 61 (3.8) | 110,373 | 55.3 (41.4–69.1) | 1.37 (1.01–1.86) | 0.0464 |
| Installation, repair, and maintenance | 253 (5.1) | 216,523 | 116.8 (102.4–131.2) | 80 (4.9) | 75,221 | 106.4 (83.0–129.7) | 0.88 (0.68–1.14) | 0.3520 |
| Life, physical and social services | 17 (0.3) | 212,151 | 8.0 (4.2–11.8) | 6 (0.4) | 88,885 | 6.8 (1.3–12.2) | 0.82 (0.32–2.07) | 0.6702 |
| Management | 233 (4.7) | 1,226,899 | 19.0 (16.6–21.4) | 80 (4.9) | 427,653 | 18.7 (14.6–22.8) | 0.95 (0.73–1.23) | 0.7059 |
| Office and administrative support | 328 (6.6) | 1,046,032 | 31.4 (28.0–34.8) | 102 (6.3) | 315,830 | 32.3 (26.0–38.6) | 1.01 (0.80–1.27) | 0.9492 |
| Personal care and services | 224 (4.5) | 343,965 | 65.1 (56.6–73.7) | 60 (3.7) | 83,985 | 71.4 (53.4–89.5) | 1.07 (0.80–1.43) | 0.6485 |
| Production | 284 (5.7) | 352,654 | 80.5 (71.2–89.9) | 75 (4.6) | 95,552 | 78.5 (60.7–96.3) | 0.95 (0.73–1.23) | 0.6709 |
| Protective service | 45 (0.9) | 211,310 | 21.3 (15.1–27.5) | 19 (1.2) | 60,815 | 31.2 (17.2–45.3) | 1.44 (0.84–2.47) | 0.1866 |
| Sales and related | 376 (7.6) | 901,515 | 41.7 (37.5–45.9) | 136 (8.4) | 271,797 | 50.0 (41.6–58.4) | 1.19 (0.97–1.46) | 0.1006 |
| Transportation and material moving | 430 (8.7) | 563,072 | 76.4 (69.1–83.6) | 174 (10.7) | 177,766 | 97.9 (83.3–112.4) | 1.28 (1.06–1.54) | 0.0092 |
| All workers | 4964 | 10,176,185 | 48.8 (47.4–50.1) | 1622 | 3,244,035 | 50.0 (47.6–52.4) | ||
Note: Bold indicates rate ratios with a p‐value less than 0.05. Workers in legal occupations are not shown because deaths among these workers were less than 5 in at least one of the time periods. Deaths and worker‐years do not sum to 100%.
Abbreviation: CI, confidence interval
Reference group is workers in all other occupations.
No covariates were included in models to calculate rate ratio.
Between the 2017–2019 period and 2020, mortality rates increased significantly (p < = 0.05) for workers in three occupation groups: food preparation and serving; healthcare support; and transportation and material moving. Workers in other occupations had notable, although not significant, increases in mortality including building and grounds cleaning and maintenance; protective service; and sales workers.
During 2020 in Massachusetts, cases of COVID‐19 increased steadily through March and April, reaching a peak in late April. Cases remained relatively low through November when they began to increase dramatically reaching a new peak in late December. 39 In late March, a stay‐at‐home advisory was issued closing non‐essential industries. 40 A phased re‐opening of these industries began in mid‐May 41
With respect to monthly rates for all workers, noticeable increases in mortality (defined as a 10% or greater relative increase in mortality rates between 2017–2019 and 2020) were observed in February, April, May, and June 2020 compared with the average mortality rate for those months in the 2017–2019 period (Figure 1). Food preparation and serving workers had noticeable increases in mortality rates throughout 2020 except in August and November. Food preparation and serving workers' mortality rates were over 100% higher in February, April, and May (Figure 2). Healthcare support workers had noticeable increases in January through March, June through September, November, and December (Figure 3). Among transportation and material moving workers, there were noticeable mortality increases in February through June and August (Figure 4).
Figure 1.
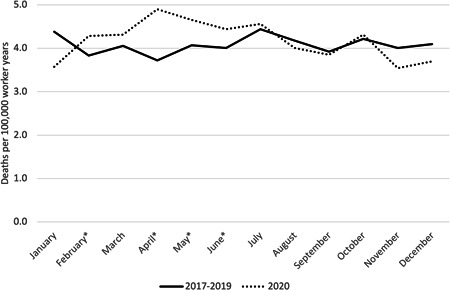
Drug poisonings mortality rates among all workers by Month, Massachusetts residents, 2017–2019 average compared with 2020. *Months with a 10% or greater relative increase in mortality rates between 2017–2019 and 2020.
Figure 2.
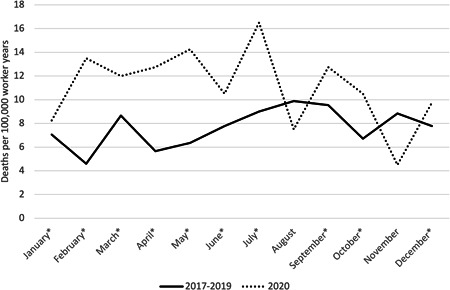
Drug poisonings mortality rates among food preparation and serving workers by month, Massachusetts residents, 2017–2019 average compared to 2020, *Months with a 10% or greater relative increase in mortality rates between 2017–2019 and 2020
Figure 3.
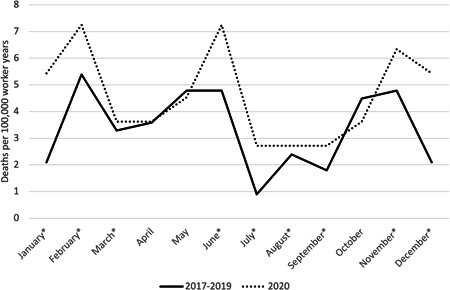
Drug poisonings mortality rates among healthcare support workers by month, Massachusetts residents, 2017–2019 average compared to 2020. *Months with a 10% or greater relative increase in mortality rates between 2017–2019 and 2020.
Figure 4.
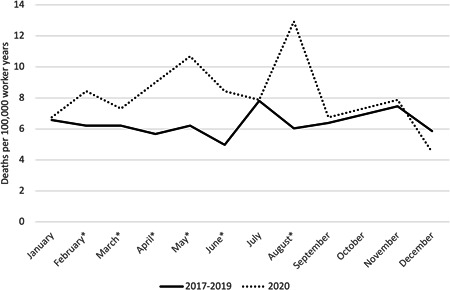
Drug poisonings mortality rates among transportation and material moving workers by month, Massachusetts residents, 2017–2019 average compared with 2020. *Months with a 10% or greater relative increase in mortality rates between 2017–2019 and 2020.
3.1. Sensitivity analysis
As shown in Table S2, when using employment in 2019 as a denominator there were not any occupations identified as having a significant increase in mortality rates. Workers in transportation and material moving and healthcare support occupations did have increases in mortality and nearly significant p‐values when the 2019 denominator was used. Workers in food preparation and serving occupations did not have increases in mortality when the 2019 denominator was used.
4. DISCUSSION
The findings from this study suggest that increases in drug poisoning deaths during the COVID‐19 pandemic may have been higher among certain occupations. In particular, these deaths increased substantially among food preparation and serving; healthcare support; and transportation and material moving workers. Among these occupations, increases were mostly higher in months that coincided with the pandemic, compared to the average mortality rates during those same months during the preceding three years. In some instances, mortality was elevated in the pre‐pandemic months. These increases could have been due to chance or other factors that changed in 2020.
These increases in mortality could be due to the stress from the pandemic, both due to the potential of being exposed to SARS‐CoV‐2 and the financial and social effects of the pandemic. Previous research suggests that workers in the occupation groups with significant increases in drug poisoning mortality face more exposure to SARS‐CoV‐2 and/or high mortality rates from COVID‐19 than workers in other occupations. 21 , 22 , 26 , 27 , 42 Most of these workers are also likely employed in essential industries, thus increasing the risk of exposure. 43 A recent study found that frontline workers were more likely to report symptoms of anxiety and depression compared to other workers. 44 Particularly among healthcare workers, there is emerging evidence that infection with COVID‐19 can have negative mental health consequences. 45 , 46 Further potential mechanisms that may link the pandemic to stress among workers include long work hours for many essential workers and increased demands for delivery workers due to more people working from home. 47
The fact that workers in occupations with increases in drug poisoning deaths also likely had disproportionate exposure to SARS‐CoV‐2 is supported by the fact that each occupation had significantly elevated mortality rates from COVID‐19 in Massachusetts in 2020. 26 Healthcare support workers had the highest rate, followed by transportation and material moving; and food preparation and service workers. 26 However, workers in these occupations may also have exposure to different risk factors that increased their risk for severe illness when contracting COVID‐19. Most healthcare support and transportation workers are employed in essential industries. Previous research has suggested that workers in essential industries may be at a higher risk for severe COVID‐19 due to having a higher prevalence of underlying risk factors compared to workers in other industries. 47 Work environment factors may increase the prevalence of these underlying risk factors among workers. 48 Additionally, workers seeing co‐workers sick with COVID‐19 and dying from the disease may have increased stress. Especially in the case of healthcare support workers, the exposure to patients infected with SARS‐CoV‐2 may have further exacerbated stress.
The fact that healthcare support workers had an increase in drug poisoning mortality, but healthcare practitioners did not have such an increase may be due to several factors. In this study, healthcare support workers had a higher drug poisoning rate in the pre‐pandemic period compared with other workers consistent with other studies. 7 , 9 Occupational factors including injuries may contribute to higher pain and use of opioids among healthcare support workers. 9 Therefore, the effects of the pandemic may have had more of an impact on healthcare support workers because there was a higher proportion of workers at risk due to these factors. Another potential contributing factor is that a higher proportion of healthcare practitioners were able to work from home during the pandemic (such as through telemedicine) compared to healthcare support workers. While previous research finds that a low proportion of both healthcare practitioners and support jobs were likely to be able to work from home, the share was higher among healthcare practitioners. 49
Several occupation groups that would be expected to have higher exposure to SARS‐CoV‐2 were not found to have significant increases in drug poisoning death. Baker et al. 21 identified seven occupation groups with frequent exposure to infections greater than the average for all workers. Of those seven occupations, only one (healthcare support) had significant increases in drug poisoning deaths in this study. Of the other five occupations, only two had a substantial but not significant increase (building and grounds cleaning and maintenance; protective services) and four did not increase substantially or declined (healthcare practitioners and technical; personal care and service; community and social services; and education, training, and library). Additionally, while all three of the occupations with significant increases in drug poisoning deaths during the pandemic had among the highest mortality rates from COVID‐19 in Massachusetts, 26 there were seven other occupations with elevated mortality rates that did not have significant increases in drug poisoning mortality. Of these seven occupations, only one had a substantial but not significant increase (protective services) and six did not increase substantially or declined (production; construction and extraction; installation, maintenance, and repair; personal care and service; arts, design, entertainment, sports, and media; and community and social service). 26 These findings suggest that while the effects of the pandemic, especially in occupations with higher exposure to SARS‐CoV‐2 may be an important contributor to increases in drug poisoning mortality, other factors are relevant as well.
Another factor that may contribute to differential occupational increases in drug poisoning deaths is unemployment and financial strain. Unemployment increased dramatically during the early days of the COVID‐19 pandemic. 30 Unemployment and not being in the labor force are likely to risk factors for drug poisoning death. 32 , 33 , 34 The potential impact of unemployment is different depending on the occupation being considered. In particular, nationally the unemployment rate increased over three times among food preparation and serving workers during the pandemic. 30 Unemployment for transportation and material moving and building and grounds cleaning workers did increase in 2020, but this increase was smaller than for many other occupations. 50 Although directions for filling out death certificates instruct to never enter unemployed as part of the occupation or industry information, in some cases, a decedent will be listed as unemployed on their death certificate. If workers in some occupations are less likely to be coded as unemployed than others even if that is their current work status, this could bias the findings towards overestimating mortality among those occupations. Such misclassification may explain some of the increases in mortality among food preparation and serving workers. Because of the large increase in the unemployment rate among this occupation in 2020, the denominator for the number of workers in 2020 was much lower than in previous years. If unemployment among these workers was not being represented on their death certificates (as would be correct with respect to the guidance for filling out death certificates), the rate will be elevated. When using 2019 workers as a denominator, there was not a significant increase in poisoning mortality rates among food preparation and serving workers, suggesting that the decrease in the denominator in 2020 may have contributed to the rate increase (Table S2). Additionally, in some cases industry and occupation will not be reported on the death certificate at all, even if the worker was employed at any point during their life. This rate of underreporting may differ with respect to age, gender, and race/ethnicity. Such underreporting could contribute to the underestimation of mortality rates in this study because workers without occupation information will be excluded. 51
Previous research has demonstrated that occupational injuries are a likely risk factor for drug overdose deaths. 4 , 9 , 12 , 13 , 14 , 15 , 16 , 17 , 18 In Massachusetts, among the four occupations with significant increases in drug overdose deaths, two (healthcare support and building and grounds cleaning) had increases in the rate of occupational injuries and illnesses in 2020 compared with previous years. 52 It should be noted that some of these increases may be driven by increases in occupational illnesses (primarily COVID‐19), which contributed to increases in occupational injuries and illnesses rates in 2020. 53 However, when specific injuries that are connected to pain and opioid use are considered using data from the Bureau of Labor Statistics Survey of Occupational Injuries and Illnesses increases among some of these occupations are noted. For example, in Massachusetts, healthcare support workers had a 17% increase in the rate musculoskeletal disorders (MSDs) in 2020 compared with 2019, while food preparation and serving workers in Massachusetts had a 22% increase in MSDs. Although transportation and material moving workers overall did not have increases in MSDs, workers in several detailed transportations and material moving occupations nationwide (Massachusetts specific data is not available for detailed occupations) did have increases in MSDs in 2020 including ambulance drivers and attendants. 52 These increases in MSDs injuries and associated pain may have increased the risk for drug overdoses. 54
There are a variety of other factors that may have contributed to increases in the risk of drug poisoning deaths during the pandemic. The pandemic interrupted the availability of treatment for substance use disorders, 55 workers in certain occupations may have been more vulnerable to these disruptions due to the nature of their employer‐provided healthcare. Additionally, it is possible that the pandemic resulted in changes in the potency of drugs being taken or even the types of drugs being consumed. For example, it is possible that workers may have transitioned from taking prescription opioids to more potent fentanyl. A recent report from the Massachusetts Department of Public Health documented increases in poisoning deaths involving fentanyl among workers in the pre‐pandemic years, paralleling similar trends nationwide. 56 Finally, due to the pandemic, people using drugs may have had less access to emergency treatment and opioid reversal medication like naloxone. 57 It is conceivable that exposure to these factors may have been differential by occupation. Further research should examine how these factors may have affected workers.
Notably, the three occupation groups found to have an increase in the risk for drug poisoning deaths during the pandemic in this study are also occupations that have been shown to disproportionately employ workers of color using nationwide data. 58 It has already been established that workers of color are more likely to be employed in occupations with increased risk of SARS‐CoV‐2 exposure and that there are elevated rates of COVID‐19, hospitalization, and death among people of color. 59 Additionally, in Massachusetts, while the rate of drug opioid‐related deaths have been declining among White, non‐Hispanic residents, they have been increasing among Black, non‐Hispanic, and Hispanic residents. 60 Similar increases in drug poisoning mortality were observed among Black workers in this study. The extent to which occupational factors, including occupational exposure to SARS‐CoV‐2, have contributed to these increases should be investigated further.
This study has limitations. Massachusetts is not the ideal state to study occupational factors related to increases in drug poisoning deaths because Massachusetts had a lower increase in drug overdose deaths compared to the national average. 2 This lower increase in drug poisoning deaths likely resulted in the study being underpowered contributing to the fact that few p values for the calculated rate ratios were less than the traditional significance level of 0.05. Furthermore, comparisons were made for each of the 22 occupations included in the analysis, some of the significant results may have been due to chance. Additionally, death certificate occupation information refers to the usual occupation of the worker and not necessarily the occupation that they were working at the time of death. 37 Any difference between usual and current occupation can result in differences in the rates for these occupations. Studies suggest that there is generally a match between usual and current occupation. 61 , 62
Further research should examine how occupational factors may have contributed to increases in drug poisoning deaths during the COVID‐19 pandemic. This study should focus on both documenting changes in poisoning death rates by occupation nationally and in different states and also determining the role played by two likely contributors to these increases: exposure to SARS‐CoV‐2 at the workplace and related stressors and unemployment/job insecurity.
CONFLICTS OF INTEREST
The authors declare no conflicts of interest.
DISCLOSURE BY AJIM EDITOR OF RECORD
John Meyer declares that he has no conflict of interest in the review and publication decision regarding this article.
AUTHOR CONTRIBUTIONS
Devan Hawkins conceived of this study, acquired data, performed the initial analysis, and drafted the paper. Anh Tuan Phan performed additional analysis, created tables, and reviewed and edited drafts of the paper. Both authors approve this version of the manuscript and agree to be accountable for all aspects of the work.
INSTITUTION AND ETHICS APPROVAL AND INFORMED CONSENT
This project was considered exempt from review by the MCPHS University Institutional Review Board because it was conducted with previously collected, deidentified data.
Supporting information
Figurementary Figure 1. Example SAS code for regression analysis.
Supporting information.
Supporting information.
ACKNOWLEDGMENT
This study was partially funded by the MCPHS University Summer Undergraduate Research Fellowship (SURF) Program. The funder had no influence on the conduct of the study.
Hawkins D, Phan AT. Changes in drug poisoning mortality before and after the COVID‐19 pandemic by occupation in Massachusetts. Am J Ind Med. 2022;65:556‐566. 10.1002/ajim.23369
DATA AVAILABILITY STATEMENT
The data in this report is publicly available data. It can be obtained by making a public data requested to the Massachusetts Registry of Vital Records and Statistics.
REFERENCES
- 1. Hedegaard H, Miniño AM, Warner M. Drug overdose deaths in the United States, 1999‐2018. 2020. [PubMed]
- 2. CDC . (2021, September 15). Products ‐ vital statistics rapid release ‐ provisional drug overdose data. Centers for Disease Control and Prevention. Accessed September 26, 2021. https://www.cdc.gov/nchs/nvss/vsrr/drug-overdose-data.htm
- 3. Friedman J, Akre S. COVID‐19 and the drug overdose crisis: uncovering the deadliest months in the United States, January‒July 2020. Am J Public Health. 2021;111:e1‐e8. 10.2105/AJPH.2021.306256 [DOI] [PMC free article] [PubMed] [Google Scholar]
- 4. Hawkins D, Roelofs C, Laing J, Davis L. Opioid‐related overdose deaths by industry and occupation—Massachusetts, 2011‐2015. Am J Ind Med. 2019;62(10):815‐825. [DOI] [PubMed] [Google Scholar]
- 5. Morano LH, Steege AL, Luckhaupt SE. Occupational patterns in unintentional and undetermined drug‐involved and opioid‐involved overdose deaths—United States, 2007–2012. Morbidity and Mortality Weekly Report. 2018;67(33):925‐930. [DOI] [PMC free article] [PubMed] [Google Scholar]
- 6. Tiesman HM, Konda S, Cimineri L, Castillo DN. Drug overdose deaths at work, 2011–2016. Inj Prev. 2019;25(6):577‐580. [DOI] [PMC free article] [PubMed] [Google Scholar]
- 7. Hawkins D, Davis L, Punnett L, Kriebel D. Disparities in the deaths of despair by occupation, Massachusetts, 2000 to 2015. J Occup Environ Med. 2020;62(7):484‐492. [DOI] [PubMed] [Google Scholar]
- 8. Scagos R, Lasher L, Viner‐Brown S. Accidental or undetermined opioid‐involved drug overdose deaths in Rhode Island and usual occupation–higher rates observed in natural resources, construction, and maintenance occupations. R I Med J. 2019;102(8):46‐48. [PubMed] [Google Scholar]
- 9. Kaki S, Hawkins D. Deaths of despair among healthcare workers, Massachusetts, 2011 to 2015. J Occup Environ Med. 2021;63(6):449‐455. [DOI] [PMC free article] [PubMed] [Google Scholar]
- 10. Fulmer S, Jain S, Kriebel D. Commercial fishing as an occupational determinant of opioid overdoses and deaths of despair in two Massachusetts Fishing Ports, 2000–2014. New Solutions. 2021;31:10482911211023476‐258. [DOI] [PubMed] [Google Scholar]
- 11. Rayhall C, Hawkins D. OccupaTional Differences In Deaths Of Despair In The United States, Using Data From The Using The National Occupational Mortality Surveillance System. J Occup Environ Med. 2021;64:356‐360. [DOI] [PubMed] [Google Scholar]
- 12. Webster BS, Verma SK, Gatchel RJ. Relationship between early opioid prescribing for acute occupational low back pain and disability duration, medical costs, subsequent surgery and late opioid use. Spine. 2007;32(19):2127‐2132. [DOI] [PubMed] [Google Scholar]
- 13. Franklin GM, Rahman EA, Turner JA, Daniell WE, Fulton‐Kehoe D. Opioid use for chronic low back pain: a prospective, population‐based study among injured workers in Washington state, 2002‐2005. Clin J Pain. 2009;25(9):743‐751. [DOI] [PubMed] [Google Scholar]
- 14. Applebaum KM, Asfaw A, O'Leary PK, Busey A, Tripodis Y, Boden LI. Suicide and drug‐related mortality following occupational injury. Am J Ind Med. 2019;62(9):733‐741. [DOI] [PMC free article] [PubMed] [Google Scholar]
- 15. Nkyekyer EW, Fulton‐Kehoe D, Spector J, Franklin G. Opioid and benzodiazepine use before injury among workers in Washington State, 2012 to 2015. J Occup Environ Med. 2018;60(9):820‐826. [DOI] [PubMed] [Google Scholar]
- 16. Martin CJ, Jin C, Bertke SJ, Yiin JH, Pinkerton LE. Increased overall and cause‐specific mortality associated with disability among workers' compensation claimants with low back injuries. Am J Ind Med. 2020;63(3):209‐217. [DOI] [PMC free article] [PubMed] [Google Scholar]
- 17. Dong XS, Brooks RD, Cain CT. Prescription opioid use and associated factors among US construction workers. Am J Ind Med. 2020;63(10):868‐877. [DOI] [PubMed] [Google Scholar]
- 18. Hawkins D, Punnett L, Davis L, Kriebel D. The Contribution of Occupation‐Specific Factors to the Deaths of Despair, Massachusetts, 2005–2015. Ann Work Expo Health. 2021;65:819‐832. [DOI] [PubMed] [Google Scholar]
- 19. Lan FY, Wei CF, Hsu YT, Christiani DC, Kales SN. Work‐related COVID‐19 transmission in six Asian countries/areas: a follow‐up study. PLoS One. 2020;15(5):e0233588. [DOI] [PMC free article] [PubMed] [Google Scholar]
- 20. Le D, Hawkins D. Variation in Employment in Healthcare Occupations and County‐Level Differences in COVID‐19 Cases in the United States of America. J Occup Environ Med. 2021;63(7):629‐631. [DOI] [PMC free article] [PubMed] [Google Scholar]
- 21. Baker MG, Peckham TK, Seixas NS. Estimating the burden of United States workers exposed to infection or disease: a key factor in containing risk of COVID‐19 infection. PLoS One. 2020;15(4):e0232452. [DOI] [PMC free article] [PubMed] [Google Scholar]
- 22. Hawkins D. Differential occupational risk for COVID‐19 and other infection exposure according to race and ethnicity. Am J Ind Med. 2020;63(9):817‐820. [DOI] [PMC free article] [PubMed] [Google Scholar]
- 23. Hawkins D. Social determinants of COVID‐19 in Massachusetts, United States: an ecological study. J Prev Med Pub Health. 53, 2020:22022 <4. [DOI] [PMC free article] [PubMed] [Google Scholar]
- 24. Figueroa JF, Wadhera RK, Lee D, Yeh RW, Sommers BD. Community‐level factors associated with racial and ethnic disparities in COVID‐19 rates In Massachusetts: study examines community‐level factors associated with racial and ethnic disparities in COVID‐19 rates in Massachusetts. Health Aff. 2020;39(11):1984‐1992. [DOI] [PMC free article] [PubMed] [Google Scholar]
- 25. Tieskens K, Patil P, Levy JI, et al. Time‐varying associations between COVID‐19 case incidence and community‐level sociodemographic, occupational, environmental, and mobility risk factors in Massachusetts. Research Square. 2021. :rs‐3. [DOI] [PMC free article] [PubMed] [Google Scholar]
- 26. Hawkins D, Davis L, Kriebel D. COVID‐19 deaths by occupation, Massachusetts, March 1–July 31, 2020. Am J Ind Med. 2021;64(4):238‐244. [DOI] [PMC free article] [PubMed] [Google Scholar]
- 27. Chen YH, Glymour M, Riley A, et al. Excess mortality associated with the COVID‐19 pandemic among Californians 18–65 years of age, by occupational sector and occupation: March through November 2020. PLoS One. 2021;16(6):e0252454. [DOI] [PMC free article] [PubMed] [Google Scholar]
- 28. Billingsley S, Brandén M, Aradhya S, Drefahl S, Andersson G, Mussino E. Deaths in the frontline: occupation‐specific COVID‐19 mortality risks in Sweden. Scand J Work, Environ Health. 2020;48:52‐60. [DOI] [PMC free article] [PubMed] [Google Scholar]
- 29. Mutambudzi M, Niedwiedz C, Macdonald EB, et al. Occupation and risk of severe COVID‐19: prospective cohort study of 120 075 UK Biobank participants. Occup Environ Med. 2021;78(5):307‐314. [DOI] [PMC free article] [PubMed] [Google Scholar]
- 30. Falk G. Unemployment Rates During the COVID‐19 Pandemic. Congressional Research Service; 2020. [Google Scholar]
- 31. Bureau of Labor Statistics . (2021). Local Area Unemployment Statistics ‐ Massachusetts. U.S. Bureau of Labor Statistics. Accessed December 18, 2021. https://data.bls.gov/timeseries/LASST250000000000003?amp%253bdata_tool=XGtable%26output_view=data%26include_graphs=true
- 32. Gutin I, Hummer RA. Occupation, employment status, and “despair”‐associated mortality risk among working‐aged US adults, 1997–2015. Prev Med. 2020;137:106129. [DOI] [PMC free article] [PubMed] [Google Scholar]
- 33. Monnat SM. Deaths of despair from the cities to the hollers: explaining spatial differences in US drug, alcohol, and suicide mortality rates. Paper prepared by the Population Research Institute at Pennsylvania State University for the 2017 Population Association of America Annual Meeting. 2017.
- 34. Eisen EA, Chen KT, Elser H, et al. Suicide, overdose and worker exit in a cohort of Michigan autoworkers. J Epidemiol Community Health. 2020;74(11):907‐912. [DOI] [PMC free article] [PubMed] [Google Scholar]
- 35. Case A, Deaton A. Rising morbidity and mortality in midlife among white non‐Hispanic Americans in the 21st century. Proc Natl Acad Sciences. 2015;112(49):15078‐15083. [DOI] [PMC free article] [PubMed] [Google Scholar]
- 36. Case A, Deaton A. Mortality and morbidity in the 21st century. Brookings Pap Econ Act. 2017;2017:2017 397‐476. [DOI] [PMC free article] [PubMed] [Google Scholar]
- 37. Hawkins D. Understanding the role of work in mortality: making the best use of available US death certificate occupation data and opportunities for improvements. J Occup Environ Med. 2021;63(6):503‐507. [DOI] [PubMed] [Google Scholar]
- 38. US Census Bureau . (2021, December 15). American Community Survey (ACS). Census.gov. Accessed February 14, 2022. https://www.census.gov/programs-surveys/acs
- 39. Centers for Disease Control and Prevention . (2021). CDC Covid Data tracker. Centers for Disease Control and Prevention. Accessed December 18, 2021. https://covid.cdc.gov/covid-data-tracker/#trends_dailycases%26territory-select=25%26leftAxis=New_case%26rightAxis=select
- 40. Solis S (2020, March 23). Mass. gov. Charlie Baker issues stay at home advisory, closes all non‐essential businesses. Masslive. Retrieved December 18, 2021, from https://www.masslive.com/coronavirus/2020/03/coronavirus-causes-massachusetts-gov-charlie-baker-to-issue-stay-at-home-advisory-closing-all-non-essential-businesses.html
- 41. Boston CBS. (2020, May 18). Here's how Massachusetts will reopen under governor Charlie Baker's plan. CBS Boston. Accessed December 18, 2021. https://boston.cbslocal.com/2020/05/18/massachusetts-reopening-plan-governor-charlie-baker-press-conference-update-businesses-list
- 42. Gamio L. The workers who face the greatest coronavirus risk. N Y Times. 2020;15:33. [Google Scholar]
- 43. Tomer A, Kane JW. How to protect essential workers during COVID‐19. Brookings Report, Brookings Institute March. 2020. :34. [Google Scholar]
- 44. Perez‐Lopez DJ (2022, February 2). Vaccinated adults report symptoms of anxiety or depression less frequently than the unvaccinated. Census.gov. Accessed February 6, 2022. https://www.census.gov/library/stories/2022/02/frontline-workers-more-likely-to-report-symptoms-of-anxiety-depressive-disorder.html?utm_campaign=20220202msacos1ccstors%26utm_medium=email%26utm_source=govdelivery
- 45. Buselli R, Corsi M, Veltri A, Baldanzi S, Chiumiento M, Del Lupo E, Cristaudo A. Quarantine and mental health challenges for occupational medicine: the case report of a nurse infected with SARS‐CoV‐2. Workplace Health Safety. 2022;70(1):43‐49. [DOI] [PubMed] [Google Scholar]
- 46. Buselli R, Baldanzi S, Corsi M, et al. Psychological care of health workers during the COVID‐19 outbreak in Italy: preliminary report of an occupational health department (AOUP) responsible for monitoring hospital staff condition. Sustainability. 2020;12(12):5039. [Google Scholar]
- 47. Selden TM, Berdahl TA. Risk of severe COVID‐19 among workers and their household members. JAMA Internal Med. 2021;181(1):120‐122. [DOI] [PMC free article] [PubMed] [Google Scholar]
- 48. Silver SR, Li J, Boal WL, Shockey TL, Groenewold MR. Prevalence of underlying medical conditions among selected essential critical infrastructure workers—behavioral risk factor surveillance system, 31 states, 2017–2018. Morbid Mortal Weekly Rep. 2020;69(36):1244‐1249. [DOI] [PMC free article] [PubMed] [Google Scholar]
- 49. Dingel JI, Neiman B. How many jobs can be done at home? J Public Econ. 2020;189:104235. [DOI] [PMC free article] [PubMed] [Google Scholar]
- 50. BLS . (2021, September 3). A‐30. unemployed persons by occupation and sex. U.S. Bureau of Labor Statistics. Accessed September 26, 2021. https://www.bls.gov/web/empsit/cpseea30.htm.
- 51. Peterson C, Schumacher PK, Steege AL. Demographic considerations in analyzing decedents by usual occupation. Am J Ind Med. 2020;63(8):663‐675. [DOI] [PMC free article] [PubMed] [Google Scholar]
- 52. Bureau of Labor Statistics . (2021). IIF databases ‐ Massachusetts. U.S. Bureau of Labor Statistics. Accessed December 18, 2021. https://www.bls.gov/iif/data.htm
- 53. Bureau of Labor Statistics . (2021, November 3). Employer‐reported workplace injuries and illnesses – 2020. Bureau of Labor Statistics. Accessed December 18, 2021. https://www.bls.gov/news.release/pdf/osh.pdf
- 54. Kowalski‐McGraw M, Green‐McKenzie J, Pandalai SP, Schulte PA. Characterizing the interrelationships of prescription opioid and benzodiazepine drugs with worker health and workplace hazards. J Occup Environ Med. 2017;59(11):1114‐1126. [DOI] [PMC free article] [PubMed] [Google Scholar]
- 55. Henderson R, McInnes A, Mackey L, et al. Opioid use disorder treatment disruptions during the early COVID‐19 pandemic and other emergent disasters: a scoping review addressing dual public health emergencies. BMC Public Health. 2021;21(1):1‐11. [DOI] [PMC free article] [PubMed] [Google Scholar]
- 56. Massachusetts Department of Public Health Occupational Health Surveillance Program (2021); Opioid‐related Overdose Deaths in Massachusetts by Industry and Occupation, 2016‐2017. Retrieved December 18, 2021, from https://www.mass.gov/doc/opioid-related-overdose-deaths-by-industry-and-occupation-2016-2017-0/download
- 57. Linas BP, Savinkina A, Barbosa C, et al. A clash of epidemics: Impact of the COVID‐19 pandemic response on opioid overdose. J Subst Abuse Treat. 2021;120:108158. [DOI] [PMC free article] [PubMed] [Google Scholar]
- 58. BLS . (2021, January 22). 2020 annual averages ‐ employed persons by detailed occupation, sex, race, and Hispanic or Latino ethnicity. U.S. Bureau of Labor Statistics. Accessed September 26, 2021. https://www.bls.gov/cps/cpsaat11.htm
- 59. CDC . (2021). Risk for COVID‐19 infection, hospitalization, and death by Race/Ethnicity. Centers for Disease Control and Prevention. Accessed September 26, 2021. https://www.cdc.gov/coronavirus/2019-ncov/covid-data/investigations-discovery/hospitalization-death-by-race-ethnicity.html
- 60. MA DPH . (2021, May). Opioid‐related overdose deaths, all intents, ma residents – demographic data highlights. Accessed September 26, 2021. https://www.mass.gov/doc/opioid-related-overdose-deaths-demographics-may-2021/download
- 61. Luckhaupt SE, Cohen MA, Calvert GM. Concordance between current job and usual job in occupational and industry groupings: assessment of the 2010 national health interview survey. J Occup Environ Med/Am Coll Occup Environ Med. 2013;55(9):1074‐1090. [DOI] [PMC free article] [PubMed] [Google Scholar]
- 62. Olsen GW, Brondum J, Bodner KM, et al. Occupation and industry on death certificates of long‐term chemical workers: Concordance with work history records. Am J Ind Med. 1990;17(4):465‐481. [DOI] [PubMed] [Google Scholar]
Associated Data
This section collects any data citations, data availability statements, or supplementary materials included in this article.
Supplementary Materials
Figurementary Figure 1. Example SAS code for regression analysis.
Supporting information.
Supporting information.
Data Availability Statement
The data in this report is publicly available data. It can be obtained by making a public data requested to the Massachusetts Registry of Vital Records and Statistics.