

Abstract
The development of versatile and sensitive biotools to quantify specific SARS‐CoV‐2 immunoglobulins in SARS‐CoV‐2 infected and non‐infected individuals, built on the surface of magnetic microbeads functionalized with nucleocapsid (N) and in‐house expressed recombinant spike (S) proteins is reported. Amperometric interrogation of captured N‐ and S‐specific circulating total or individual immunoglobulin (Ig) isotypes (IgG, IgM, and IgA), subsequently labelled with HRP‐conjugated secondary antibodies, was performed at disposable single or multiplexed (8×) screen‐printed electrodes using the HQ/HRP/H2O2 system. The obtained results using N and in‐house expressed S ectodomains of five SARS‐CoV‐2 variants of concern (including the latest Delta and Omicron) allow identification of vulnerable populations from those with natural or acquired immunity, monitoring of infection, evaluation of vaccine efficiency, and even identification of the variant responsible for the infection.
Keywords: Immune Response, Electroanalytical Bioplatforms, Omicron, SARS-Cov-2, Viral Antigens
A multiplexed amperometric bioplatform can detect and quantify total and isotype N‐ and S‐specific anti‐SARS‐CoV‐2 serum immunoglobulins within 75 minutes. The platform was used to analyze the global and isotype‐specific immune response of COVID‐19 convalescent and vaccinated individuals, and to detect variant‐specific S antibodies from variants of concern.
Introduction
Over the last two decades, after SARS‐CoV and MERS‐CoV, Severe Acute Respiratory Syndrome Coronavirus 2 (SARS‐CoV‐2) is the third coronavirus causing severe acute respiratory disease in humans.[ 1 , 2 , 3 ] In contrast to the limited MERS and SARS infections in few countries, Coronavirus Disease 2019 (COVID‐19) caused by SARS‐CoV‐2 has affected the whole world, causing a collapse of healthcare systems and millions of deaths worldwide. [4]
The detection of the body's natural immune response to SARS‐CoV‐2 facilitates contact tracing, the surveillance of the general population to prevent potential future outbreaks and to establish “herd immunity” in populations. In addition, such detection can help in the management of overall health status and, more importantly, to provide insight into immunity to future infections.[ 5 , 6 ] With the global spread of SARS‐CoV‐2, feasible, accurate, and scalable detection systems are imperative to combat it efficiently and safely, and ideally they could be operated outside healthcare institutions. [7] With the recent emergence of new and more infectious SARS‐CoV‐2 variants,[ 8 , 9 ] versatile assays are needed for an accurate analysis of specific neutralizing antibodies.
The high throughput and low workload that characterize serological assays have given rise to more classical diagnostic methodologies, including nucleic acid testing. [10] Accurate, rapid, and large‐scale identification of infected individuals is one of the most recent and prominent issues related to the COVID‐19 pandemic. [11] Molecular assays, with PCR‐based methods as the gold standard, show exceptional attributes for the identification of acute infection, but remain unsuitable for large‐scale screening purposes. The monitoring of SARS‐CoV‐2 specific antibodies against its antigenic spike (S) and nucleocapsid (N) structural proteins is necessary not only for a better understanding of the course of the disease, but also to contribute to epidemiological studies and assess vaccine efficacy. Considering SARS‐CoV as a reference model, antibodies against the nucleocapsid protein are the most sensitive for diagnosing infection through serologic analysis, as they are produced earlier than antibodies against other viral antigens. [12] However, the SARS‐CoV spike antigen is considered the best target for neutralizing antibodies and vaccine development, appearing later than those against the nucleocapsid antigen.
Similarly, specific antibodies against the SARS‐CoV‐2 nucleocapsid protein can be considered as a relatively early diagnostic biomarker, as their detection is useful in identifying individuals who have had a recent or previous COVID‐19 infection,[ 12 , 13 ] while the presence of specific antibodies against the spike antigen correlates well with neutralization.[ 14 , 15 , 16 ]
The detection of IgAs against S‐ and N‐SARS‐CoV‐2 proteins has been less explored compared to IgG‐ and IgM‐based serological assays.[ 17 , 18 , 19 , 20 , 21 , 22 ] However, kinetics studies of the antibody response have shown an early appearance of IgAs. [23] Furthermore, it has been reported that the early SARS‐CoV‐2‐specific humoral response was dominated by this antibody isotype, which contributes to SARS‐CoV‐2 neutralization to a larger extent than IgG. [24] These observations, together with the high sensitivity provided by SARS‐CoV‐2 specific IgA detection,[ 25 , 26 ] evidence the emerging role of IgA interrogation in the diagnosis of COVID‐19. [27]
In terms of the technologies explored for the interrogation of COVID‐19 related biomarkers, electrochemical biosensors have enormous potential because they enable the implementation of rapid, affordable, and facile infectious disease tests that can operate at the multiplexed and multiomics level either in the laboratory or, more importantly, in a field setting for expediting and improving clinical decision making. Among the more recently reported studies, the following can be highlighted: the detection of SARS‐CoV‐2 specific S antigen and S‐specific IgGs and IgMs using a paper‐based electrochemical platform functionalized with graphene oxide and detection by square wave voltammetry, [28] the use of streptavidin‐coated carbon screen‐printed electrodes (SPEs) and chronoamperometry [29] for the detection of S‐specific IgGs and IgMs, the preparation of an antifouling nanocomposite, comprising graphene oxide, bovine albumin serum, and glutaraldehyde, for the simultaneous determination of SARS‐CoV‐2 RNA and specific antibodies involving CRISPR‐based technology and serological assays, respectively, [30] and the use of magnetic beads (MBs) combined with carbon black screen‐printed electrodes for the detection of N‐ or S‐SARS‐CoV‐2 proteins. [31] However, to our knowledge, there are no reports describing an electrochemical multianalyte platform combining the remarkable advantages exhibited by MBs modified with in‐house expressed viral antigens coupled to SPEs as transducers to allow the simultaneous screening of the humoral immune response against SARS‐CoV‐2 Wuhan D614G (B.1 variant) and currently circulating variants of concern from both a global and specific perspective. Accordingly, we have developed the first multiplexed platform that combines protein engineering and electrochemical transduction to detect the presence of total and isotype N‐ and S‐specific anti‐SARS‐CoV‐2 serum Igs in as little as 75 minutes, with high reliability.
The proposed methodology has been successfully applied to decipher the global and isotype‐specific immune response of COVID‐19 convalescent patients and vaccinated individuals. More importantly, we used the bioplatforms to detect variant‐specific S antibodies by employing in‐house expressed S‐proteins from variants of concern recognized by the World Health Organization (WHO). To do that, the murine sera from animals immunized with Wuhan D614G S variant and human sera from patients infected with SARS‐CoV‐2 in the first wave in Spain (March–June 2020) were surveyed with purified‐to‐homogeneity S variants: B.1 (Wuhan D614G), Alpha containing the E484K mutation (Alpha E484K), Kappa, Delta, and Omicron. Importantly, the proposed methodology has been successfully applied to discriminate between variant‐specific immunized animals as well as between convalescent and vaccinated subjects, demonstrating that the bioplatforms can detect variant‐specific antibodies.
Results and Discussion
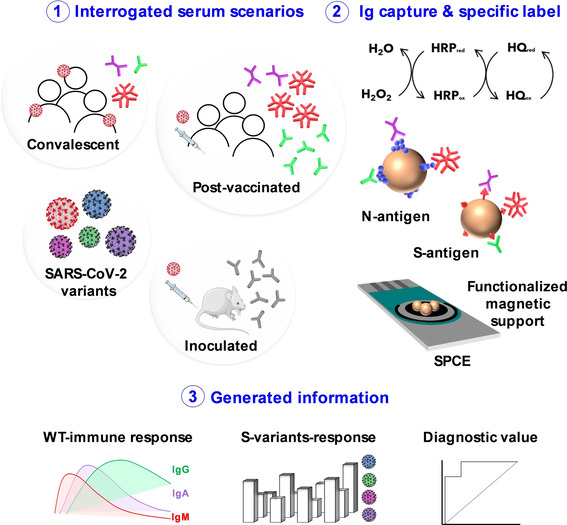
The rationale for the developed bioplatforms for the determination of total or isotype N‐ and S‐specific anti‐SARS‐CoV‐2 serum Igs relies on the use of MBs covalently functionalized with the corresponding viral antigen (commercial or in‐house expressed recombinant proteins) for the efficient capture of the specific Igs (Scheme 1). The determination of a single Ig isotype or the total of the three isotypes was performed by their selective enzymatic labelling with the corresponding HRP‐conjugated secondary antibody or an antibody cocktail. In all cases, the resulting magnetic bioconjugates were captured on the working electrode surface of disposable electrode platforms and amperometric detection was employed using the H2O2/hydroquinone (HQ) system. The variation in the measured cathodic current arising from the enzymatic reduction of H2O2 mediated by HQ was proportionally related to the concentration of Igs.
Scheme 1.

Fundamentals of the bioplatforms developed for the determination of total (IgG+IgM+IgA) and isotype‐specific serum Igs against N and S WT and SARS‐CoV‐2 emergent variants by exploiting the use of MBs modified with N and in‐house expressed S ectodomains of SARS‐CoV‐2 variants with amperometric detection at disposable single or multiplexed SP8CEs.
Evaluation of Key Experimental Variables
Key experimental variables for the implementation of immunoassays using N‐Ms‐IgG (Mouse COVID 19 N Coronavirus Monoclonal Antibody) or S‐Rb‐IgG (Rabbit COVID 19 S RBD Coronavirus Polyclonal Antibody) standard solutions were optimized. Other experimental conditions involved in the electrochemical measurements were the same as those optimized in previous studies.[ 32 , 33 , 34 ] The ratio between the amperometric responses measured in the presence of a fixed concentration of standards (50 ng mL−1 N‐Ms‐IgG or 250 ng mL−1 S‐Rb‐IgG, S signal) and in their absence (B signal), i.e., the S/B ratio, was taken as the selection criterion for the variables summarized in Table S1 (in the Supporting Information), where the evaluated range for each variable is also indicated.
As illustrative examples, the results obtained in the optimizations of the N‐ and S‐antigen concentrations for their covalent immobilization on activated MBs (Figure S1A, B, respectively), of the steps used to perform the immunoassay for the determination of N‐Ms‐IgG (Figure S1C), and in the optimization of the secondary antibody concentration for the enzymatic labelling of S‐Rb‐IgG captured on S‐MBs (Figure S1D) and the related discussion are given in the Supporting Information.
Analytical and Operational Characteristics
Under the selected experimental conditions summarized in Table S1, the analytical and operational characteristics of the bioplatforms developed for the single amperometric determination of the S‐ and N‐specific human Igs (hIgs) isotypes standards are summarized in Table 1 and the calibration plots displayed in Figure 1. These analytical characteristics show very high sensitivity for the determination of N‐ and S‐specific human Igs isotypes. Since normal serum levels of this type of Igs are in the μg mL−1 range, [35] it can be concluded that the developed bioplatforms exhibit enough sensitivity for their determination in serum and even in other biofluids, such as saliva. Zeng et al. [36] have recently used chemiluminescence to estimate the change in the concentration of N‐ and S‐specific IgGs, IgMs and IgAs of SARS‐CoV‐2 21 days after infection, and they reported mean values between 8.84 and 149.37 μg mL−1 for the three isotypes. These concentrations are three orders of magnitude higher than the LODs and LOQs (limit of detection and quantification, respectively) provided by the developed biotools. When compared with the available ELISA methodologies for the determination of these specific Igs, the developed bioplatforms are competitive in terms of sensitivity, simplicity, assay time, affordable cost, and compatibility with multiplexed point‐of‐care (POC) determinations. Indeed, ELISA kits for the detection of IgGs in human serum against these two viral antigens provide LOD values of about 5 IU mL−1, which, considering that 0.115 U mL−1 IgG=1 mg dL−1, correspond to μg mL−1 concentrations, which are three orders of magnitude larger than those achieved with the developed bioplatforms. In addition, the ELISA methodologies require multiple washing steps, lengthy incubation, and bulky and expensive equipment for detection, making it labor‐intensive, time consuming, and limited to laboratory settings.
Table 1.
Analytical and operational characteristics obtained with the developed bioplatforms for the single amperometric determination of isotype (IgG, IgM and IgA) N‐ and S‐specific anti‐SARS‐CoV‐2 hIgs standards.
|
|
S‐specific |
N‐specific |
||||
|---|---|---|---|---|---|---|
|
Parameter |
IgG |
IgM |
IgA |
IgG |
IgM |
IgA |
|
Linear range [ng mL−1] |
0.4–50 |
1.1–100 |
1.2–25 |
0.1–10 |
0.3–10 |
0.4–10 |
|
r |
0.998 |
0.998 |
0.990 |
0.991 |
0.996 |
0.994 |
|
Slope [nA mL ng−1] |
(54±2) |
(20.4±0.5) |
(19±1) |
(449±23) |
(271±9) |
(155±8) |
|
Intercept [nA] |
(157±34) |
(101±18) |
(133±13) |
(276±106) |
(74±45) |
(52±39) |
|
LOD [ng mL−1][a] |
0.1 |
0.3 |
0.3 |
0.05 |
0.07 |
0.1 |
|
LOQ [ng mL−1][b] |
0.4 |
1.1 |
1.2 |
0.1 |
0.3 |
0.4 |
|
RSD (n=5) [%] |
3.3 |
8.6 |
7.4 |
3.0 |
3.2 |
5.8 |
[a] 3×sb/m. [b] 10×sb/m with sb: standard deviation of 10 amperometric measurements obtained in the absence of standard; m slope value of the calibration plot in buffered solution.
Figure 1.
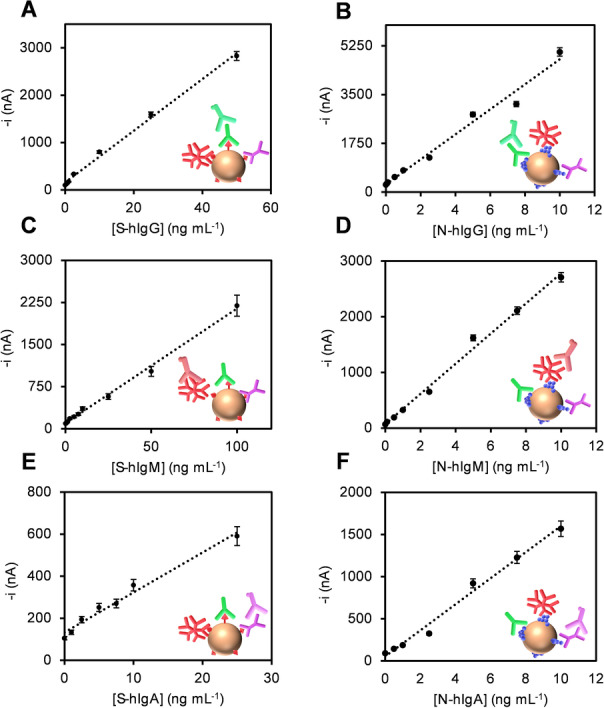
Calibration plots constructed with the developed bioplatforms for the single amperometric determination of isotype (IgG, IgM and IgA) S‐ (A, C, E) and N‐ (B, D, F) specific anti‐SARS‐CoV‐2 hIgs standards.
Moreover, the relative standard deviation (RSD) values shown in Table 1 were calculated from the measurements made with five different bioplatforms manufactured in the same way, for 25, 50, and 10 ng mL−1 S‐hIgG, ‐hIgM, and ‐hIgA, and for 2.5 ng mL−1 N‐hIgG, ‐hIgM, and ‐hIgA, respectively. The RSD values confirmed the acceptable reliability of the protocols used for the preparation of the magnetic bioconjugates and the amperometric detection at the bioplatforms.
Furthermore, bioplatforms constructed with N‐ and S‐MBs that were stored after their preparation in filtered PBS at 4 °C provided similar S/B ratios for 50 and 250 ng mL−1 N‐Ms‐IgG and S‐Rb‐IgG standards 9 and 14 days, respectively, after preparation of the modified MBs. This allows their preparation in advance and the simplification of the working protocol, shortening the assay time required for the determination to as little as 75 min.
Analysis of the Humoral Immune Responses in Serum Samples from Uninfected, Infected, and Vaccinated Individuals
The potential of the developed bioplatforms to discriminate SARS‐CoV‐2 PCR‐confirmed infected (n=12, PC) from non‐infected (n=12, NC) individuals was evaluated by determining the serum levels of N‐ and S‐SARS‐CoV‐2 specific immunoglobulins. In all cases, human sera samples were 1000‐fold diluted. This dilution factor was selected based on the comparison of the slope values of the calibration plots constructed with the N‐ and S‐specific isotypes standards in buffered solutions and with diluted serum samples of a non‐infected individual (NC_4). As it can be seen in Table S2 in the Supporting Information, a 1000‐fold dilution factor allowed no apparent matrix effect to occur. Furthermore, this dilution factor ensured that the signals obtained from most of the analyzed samples fell within the linear range provided by the bioplatforms for each Ig isotype. S‐ and N‐specific IgGs and IgMs levels were tested to check the ability of the bioplatforms to detect past and current COVID‐19 infections, respectively. IgGs against N‐ or S‐SARS‐CoV‐2 specific proteins were observed in most of the infected individuals, whereas only non‐infected samples NC_5 and NC_6 were positive to N‐specific IgGs (Figure 2A). Furthermore, only 3 out of 12 serum samples from infected individuals showed N‐specific IgMs, with 5 out of 12 also possessing S‐specific IgMs, which indicated that these patients might still have a current infection with COVID‐19 at the time of sample collection (Figure 2B). The measured S‐ and N‐specific IgAs levels in the serum samples were lower than those of IgGs and IgMs for COVID‐19 infected patients, highlighting that patients without IgMs were not IgAs‐positive (Figure 2C). Regarding the total immunoglobulin content (Figure 2D), N‐ and S‐Igs were detected in all serum samples from infected individuals except in one sample (PC_3), whereas very low signals were obtained for non‐infected individuals’ serum samples, except for samples NC_5 and NC_6, which showed Igs levels against N protein similar to those of the less reactive samples from infected individuals. Moreover, owing to the absence of matrix effects for 1000×‐diluted serum samples, the single levels of the six isotypes of target Igs were quantified by simple interpolation of the amperometric responses provided by the bioplatforms (displayed in Figure 2) into the corresponding calibration plot (Figure 1). The resulting Igs concentrations are summarized in Table 2.
Figure 2.

Amperometric signals provided by the developed bioplatforms for the serological detection of isotype (IgG (A), IgM (B), and IgA (C)) and total (D) S‐ and N‐specific anti‐SARS‐CoV‐2 Igs in 1000×‐diluted serum samples from non‐infected (NC) and infected (PC) individuals. The presence of negative bars is due to the fact that in all cases the given amperometric responses are obtained after subtracting the signals recorded for each serum sample with the unmodified‐MBs (no viral antigen immobilized) to correct for the nonspecific adsorption of hIgs on the MBs.
Table 2.
Concentrations[a] of S‐ and N‐specific anti‐SARS‐CoV‐2 IgG, IgM, and IgA, in μg mL−1, as determined with the developed bioplatforms.
|
|
S‐specific |
N‐specific |
||||
|---|---|---|---|---|---|---|
|
Subject |
IgG |
IgM |
IgA |
IgG |
IgM |
IgA |
|
NC_1 |
ND[b] |
ND |
ND |
ND |
ND |
1.0±0.1 |
|
NC_2 |
ND |
1.3±0.2 |
ND |
ND |
0.053±0.004 |
ND |
|
NC_3 |
0.89±0.03 |
ND |
ND |
0.85±0.06 |
ND |
ND |
|
NC_4 |
ND |
ND |
ND |
ND |
ND |
0.21±0.04 |
|
NC_5 |
ND |
ND |
ND |
1.5±0.2 |
0.16±0.01 |
0.23±0.04 |
|
NC_6 |
ND |
ND |
ND |
1.7±0.2 |
0.068±0.005 |
0.59±0.09 |
|
NC_7 |
ND |
ND |
ND |
ND |
ND |
0.032±0.003 |
|
NC_8 |
ND |
ND |
ND |
ND |
ND |
ND |
|
NC_9 |
ND |
ND |
ND |
ND |
0.038±0.004 |
ND |
|
NC_10 |
ND |
ND |
ND |
0.31±0.02 |
0.25±0.02 |
ND |
|
NC_11 |
ND |
ND |
ND |
ND |
ND |
ND |
|
NC_12 |
ND |
ND |
ND |
ND |
0.057±0.004 |
ND |
|
PC_1 |
59±6 |
73±17 |
107±21 |
1.5±0.2 |
ND |
0.6±0.1 |
|
PC_2 |
135±13 |
31±7 |
1.5±0.2 |
1.4±0.1 |
0.85±0.09 |
ND |
|
PC_3 |
ND |
ND |
ND |
1.9±0.1 |
ND |
ND |
|
PC_4 |
47±4 |
ND |
ND |
4.8±0.5 |
ND |
0.013±0.002 |
|
PC_5 |
9.6±0.9 |
ND |
ND |
3.5±0.3 |
ND |
0.8±0.1 |
|
PC_6 |
107±10 |
58±11 |
10±0.2 |
8.9±0.9 |
2.9±0.3 |
8±2 |
|
PC_7 |
15±1 |
ND |
ND |
6.0±0.6 |
ND |
0.34±0.05 |
|
PC_8 |
35±3 |
1.9±0.3 |
0.25±0.04 |
3.9±0.3 |
ND |
0.60±0.07 |
|
PC_9 |
84±9 |
68±14 |
5.5±0.9 |
25±3 |
ND |
4.8±0.6 |
|
PC_10 |
13±1 |
ND |
ND |
2.5±0.2 |
ND |
0.40±0.06 |
|
PC_11 |
121±14 |
73±16 |
13±3 |
8.2±0.8 |
5.0±0.4 |
4.2±0.8 |
|
PC_12 |
123±12 |
ND |
ND |
5.4±0.4 |
ND |
0.9±0.2 |
|
Cutoff value [μg mL−1][c] |
5.25 |
1.60 |
0.15 |
1.1 |
0.55 |
0.25 |
[a] Mean value±t×s/√n, n=3, α=0.05. [b] Non‐detectable. [c] Cutoff value estimated in serum samples by ROC curves to discriminate NC and PC individuals.
The diagnostic ability of the bioplatforms to detect COVID‐19 patients was analyzed by means of ROC curves. Individual ROC curves showed that the detection of total Igs against N and S proteins, as well as the detection of S‐ and N‐specific IgGs, S‐specific IgMs, and S‐specific IgAs, are highly diagnostic for COVID‐19 infection, with sensitivity, specificity, and AUC higher than 80 % (Figure S2 in the Supporting Information). Importantly, the combination of S‐ and N‐specific immunoglobulins increased the diagnostic ability, reaching 100 % sensitivity, specificity, and AUC based on the detection of N‐ and S‐specific IgGs (Figure S3A). It is worth noting the significant improvement in diagnostic sensitivity (see Figure S3B) by targeting IgMs or IgAs when MBs are modified with a mixture of N and S antigens (protocol described in the section “Preparation of the magnetic conjugates” in the Supporting Information). However, it is important to note that although this alternative would simplify the multiplexed determination, it would not make it possible to discriminate the Igs specific to each viral protein, which remains essential, considering the different roles played by both proteins and the interest in their specific determination due to the incessant appearance of variants mostly mutated in the S protein rather than the N protein.
It is important to note the good agreement between the quantitative results provided by the bioplatforms with the concentrations reported by other authors for the target Igs (8.84—149.37 μg mL−1 for S‐ and N‐specific Igs) [36] as well as for S‐specific Igs with the qualitative Luminex methodology used in the clinical routine (Table S3, ROC curves data summarized in Table S4 and bioplatforms–Luminex correlation plots displayed in Figure S4). Conversely, a poor correlation between the results provided by the bioplatforms and Luminex was observed for N‐specific Igs. Interestingly, ROC curves for N‐specific Igs were much better with the bioplatforms over Luminex, obtaining at the same time quantitative Igs levels. All these results confirmed the suitability of the developed bioplatforms to quantify the levels of target Igs in an affordable way and with the possibility of use at the POC. In addition, the analysis of these quantitative results by the ROC curves allowed the establishment of the cut‐off values shown in Table 2 for each specific isotype, to discriminate between COVID‐19 infected and non‐infected individuals. All these data show the usefulness of the developed bioplatforms for the serological discrimination between non‐infected and infected COVID‐19 individuals and between the latter according to the neutralizing antibody loading they have generated.
Moreover, the potential of the bioplatforms for a more complete monitoring of the immune response was evaluated by using an eight‐electrode SPCE array able to monitor in a single platform and a single experiment the total content of Igs and the individual IgG, IgM, and IgA against the two viral proteins tested. Accordingly, eight different batches of MBs were individually modified with the viral protein antigens (four with S‐ and four with N‐) and the total Igs or isotypes specific to them were captured from the analyzed serum sample and detected through their enzymatic labelling with the corresponding HRP‐conjugated secondary antibody or antibody cocktail. The corresponding magnetic bioconjugates were captured on each working electrode (WEs1–WEs8) of the SP8CE and the eight amperometric responses were recorded simultaneously. Four SP8CEs were used: two for the analysis of sera from a healthy individual and a COVID‐19 infected patient, and two more SP8CEs to monitor the background current obtained in each case after incubation of the corresponding and properly diluted serum sample with unmodified MBs. The results are displayed in Figure 3 and, as expected, the amperometric responses provided by both arrays for each viral antigen/Ig(s) were consistent with those obtained at the single platforms showing larger amperometric responses in all cases for the infected individual.
Figure 3.
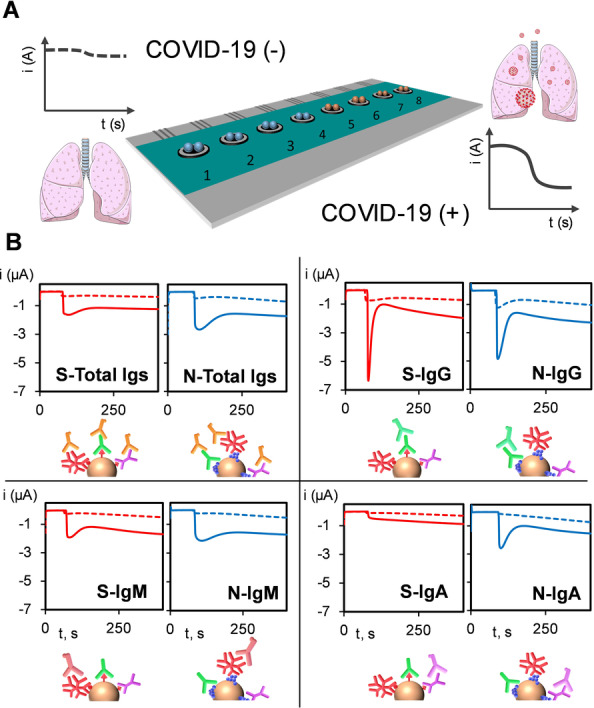
Schematic diagram of the disposable SP8CEs multiplexed platform used showing the capture of the corresponding modified MBs onto each sensing unit (1–8) (A) and real amperometric traces recorded for 1000×‐diluted sera from a representative healthy individual (dashed line) and a COVID‐19‐infected patient (solid line) (B) for the detection of total S‐ and N‐specific anti‐SARS‐CoV‐2 Igs (top left), and specific IgG (top right), IgM (bottom left), and IgA (bottom right).
In addition, the bioplatforms were used to monitor the IgGs and IgMs levels against S and N antigens in vaccinated (positive and negative for SARS‐CoV‐2) vs. non‐vaccinated (negative for SARS‐CoV‐2) individuals. The corresponding quantitative results are summarized in Table 3. Figure 4 shows individuals immunized with either AstraZeneca or Pfizer‐BioNTech vaccines who had recovered from the infection possessed considerably higher S‐IgG levels than vaccinated individuals who had not been infected with SARS‐CoV‐2. However, no significant differences were observed when N‐IgG levels were compared and IgMs did not provide useful results. Quantitative results in Table 3 are consistent with the fact that S‐specific Igs, which play a key role in neutralizing activity of SARS‐CoV‐2 virus, can be induced by vaccination, thus providing information on the vaccine response.[ 37 , 38 ] Conversely, N‐specific Igs responses were considerably lower than those of S protein in convalescent vaccinated individuals. These results suggest the feasibility of the bioplatforms to quantify natural antibodies developed after COVID‐19 infection or antibodies developed after vaccination.
Table 3.
Concentrations[a] of IgG and IgM S‐ and N‐specific anti‐SARS‐CoV‐2 Igs, in μg mL−1, determined with the developed bioplatforms in serum samples from vaccinated (either positive, COVID+, or negative, COVID−, for SARS‐CoV‐2) and non‐vaccinated (negative for SARS‐CoV‐2 and control of the assay) individuals.
|
|
S‐specific |
N‐specific |
||
|---|---|---|---|---|
|
Subject |
IgG |
IgM |
IgG |
IgM |
|
Non‐vaccinated (COVID−) |
ND[b] |
ND |
ND |
0.23±0.02 |
|
Pfizer BioNTech (COVID−) |
35±3 |
ND |
1.6±0.2 |
ND |
|
Pfizer BioNTech (COVID+) |
154±17 |
ND |
0.44±0.04 |
ND |
|
AstraZeneca (COVID+) |
179±20 |
ND |
0.93±0.07 |
ND |
[a] Mean value±t×s/√n, n=3, α=0.05. [b] Non‐detectable.
Figure 4.
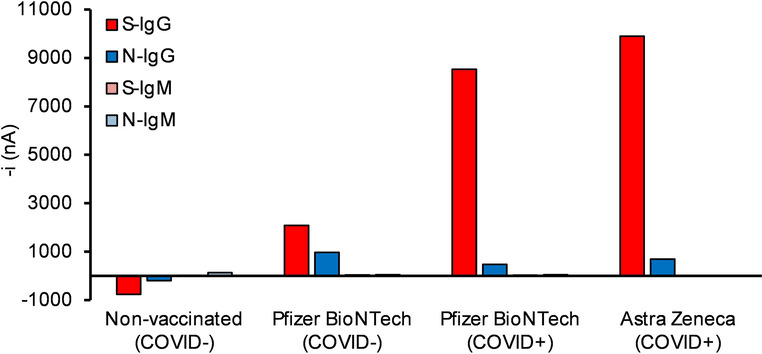
Comparison of the amperometric signals provided by the developed bioplatforms for the serological detection of S‐ and N‐specific anti‐SARS‐CoV‐2 isotypes (IgG and IgM) in 1000×diluted serum from vaccinated (either positive or negative for SARS‐CoV‐2) and non‐vaccinated (negative for SARS‐CoV‐2 and control of the assay) individuals.
Detection of Variant‐Specific S Antibodies
We employed the bioplatform to analyze the IgG immune response to different S variants. Three different sera from—1) 10 mice immunized with S Wuhan D614G variant, 2) individuals convalescent from COVID‐19 infection during the first wave in Spain, and 3) individuals vaccinated with Pfizer BioNTech and AstraZeneca SARS‐CoV‐2 vaccines—were analyzed to evaluate their response against S variants of Wuhan D614G, Alpha E484K, Delta, Kappa, and Omicron (Figure 5). IgGs from mice immunized with S Wuhan D614G variant (Figure 5A) were able to recognize the Alpha E484K, Kappa, and Delta S variants at a lower extent than the Wuhan D614G S variant. Remarkably, the Omicron S variant was the least recognized (Figure 5B). Moreover, the bioplatform was able to detect a different immune response for the different variants in convalescent (Figure 5C) and vaccinated (Figure 5D) individuals. More importantly, it was observed that IgGs produced against the S Wuhan variant recognized the Alpha, Kappa and Delta S variants to a lower extent, with the Omicron variant as the least recognized, for individuals infected with SARS CoV‐2. However, sera from vaccinated individuals showed the lowest recognition of the Delta and Omicron variants in contrast to the Alpha E484K and Kappa variants whose recognition was more similar to that observed for the Wuhan D614G S variant.
Figure 5.

Analysis of the S‐specific IgGs against five Spike variants. Amperometric signals provided by the developed bioplatforms using MBs modified with in‐house expressed S ectodomains of SARS‐CoV‐2 variants (Wuhan D614G, Alpha E484K, Kappa, Delta, and Omicron). Specific S‐IgGs from sera of 10 immunized mice with the S Wuhan D614G variant (WT in the figure) were measured using five Spike variants (Wuhan D614G, Alpha E484K, Kappa, Delta, and Omicron) (A and B). Pool of five sera from individuals infected with SARS‐CoV‐2 in the first wave in Spain and non‐infected as control were surveyed for IgG response against the five indicated Spike variants (C). Serum from individuals vaccinated with the indicated vaccines (with positive or negative infection to Covid (COVID+ and COVID−, respectively) and non‐vaccinated (NV) was surveyed for IgG response to the Spike variants (D).
These results agree with Delta and Omicron SARS‐CoV‐2 variants’ immune escape and reinfection, with the Omicron variant more likely to reinfect than Delta variant.[ 39 , 40 ] In addition, these results also support the bioplatforms’ availability to detect any variant that may arise and their potential to identify the variant responsible for the infection. These bioplatforms can also be used to evaluate the efficacy of vaccines and the possibility of reinfection, depending on the amount of neutralizing antibodies, thus allowing the implementation of personalized vaccination strategies.
Conclusion
We have developed amperometric bioplatforms suitable for monitoring SARS‐CoV‐2 humoral immune response through the detection and quantification of isotype‐specific antibodies against S and N proteins. The bioplatforms were employed to detect antibodies in sera from individual either infected or vaccinated with Pfizer‐BioNTech or AstraZeneca. The bioplatforms were also useful in detecting specific antibodies to different Spike variants as surrogate markers of variant‐specific infection of different individuals. This is important for predicting the future status of the pandemic, monitoring new emergent variants, determining whether vaccinated individuals maintain an important level of antibodies able to block these new variants, and even determining whether new vaccinations are needed, which could help prevent possible future outbreaks of the pandemic.
Moreover, since it is well known that viral load peaks several days after infection and can remain above the infectious threshold for up to a month after infection, the high sensitivity and quantitative ability of the bioplatforms would allow longitudinal assessments to detect early infections when viral load is still low, due to the amplification factor by the immune system, and to ensure that patients are isolated for a sufficient period of time to avoid premature re‐entry into the community.
It is also important to highlight the high versatility of the developed methodology owing to the use of in‐house expressed variants, thus allowing the rapid screening of new variants, and electrochemical transducers, which makes it possible, in a simple way, to utilize disposable multiplexed electrode substrates with large working sensor units (currently commercially available with up to 96). These highly multiplexed electrochemical devices will open the door to provide even more complete information on the humoral immune response (e.g. by interrogating, globally or individually, Igs against other SARS‐CoV‐2 antigens) or regarding different key aspects of COVID‐19 disease in addition to the immune response, such as viral infection and disease severity by interrogating specific signatures of biomarkers at multiomics level: viral RNA and antigenic receptor/proteins and proteins/cytokines related to the infection severity. These devices would provide information of great relevance for: 1) identifying vulnerable populations or those with natural or acquired immunization; 2) allowing timely detection of exaggerated responses of the immune system thus minimizing their fatal consequences; and 3) performing epidemiological studies on the variant responsible for the infection and the efficacy of available vaccines against the variants already identified and the possible emergent ones envisioned by experts.
Furthermore, the simplicity of the developed bioplatforms and their compatibility with the use of amperometric detectors at the point of care, such as the glucometer, mean that, unlike ELISA and Luminex methodologies, they can be used in any environment, including congregate settings or even at home.
Experimental Section
Apparatus and electrodes, reagents and solutions, patient sera, design, cloning, expression, and purification of Spike variants, SDS‐PAGE and Western Blot (WB) analysis, mouse Wuhan D614G Spike variant immunization and mouse serum samples, preparation of the magnetic bioconjugates, amperometric measurements, Luminex assay, and statistical analysis, are described in detail in the Supporting Information.
Conflict of interest
The authors declare no conflict of interest.
1.
Supporting information
As a service to our authors and readers, this journal provides supporting information supplied by the authors. Such materials are peer reviewed and may be re‐organized for online delivery, but are not copy‐edited or typeset. Technical support issues arising from supporting information (other than missing files) should be addressed to the authors.
Supporting Information
Acknowledgements
The financial support of PID2019‐103899RB‐I00 (Spanish Ministerio de Ciencia e Innovación) Research Project and the TRANSNANOAVANSENS‐CM Program from the Comunidad de Madrid (Grant S2018/NMT‐4349) is gratefully acknowledged. R.B. acknowledges the financial support of the PI20CIII/00019 grant from the AES‐ISCIII program. R.M.T.‐R. acknowledges Talento‐Contract from Comunidad de Madrid (2019‐T2/IND‐15965). A.M.‐C. acknowledges a FPU predoctoral contract supported by the Spanish Ministerio de Educación, Cultura y Deporte. V.M. acknowledges the financial support of the COV20_00679 grant of the COVID‐19 Research Call (ISCIII‐Spanish Ministry of Science and Innovation).
R. M. Torrente-Rodríguez, A. Montero-Calle, C. San Bartolomé, O. Cano, M. Vázquez, M. Iglesias-Caballero, A. Corral-Lugo, M. J. McConnell, M. Pascal, V. Mas, J. M. Pingarrón, R. Barderas, S. Campuzano, Angew. Chem. Int. Ed. 2022, 61, e202203662; Angew. Chem. 2022, 134, e202203662.
Contributor Information
Prof. José M. Pingarrón, Email: pingarro@quim.ucm.es.
Dr. Rodrigo Barderas, Email: r.barderasm@isciii.es.
Dr. Susana Campuzano, Email: susanacr@quim.ucm.es.
Data Availability Statement
The data that support the findings of this study are available from the corresponding author upon reasonable request.
References
- 1. Lee N., Hui D., Wu A., Cameron P., Joynt G. M., Ahuja A., Yung M. Y., Leung C. B., To K. F., Lui S. F., Szeto C. C., Chung S., Sung J. J. Y., N. Engl. J. Med. 2003, 348, 1986–1994. [DOI] [PubMed] [Google Scholar]
- 2. Graham R. L., Baric R. S., J. Virol. 2010, 84, 3134–3146. [DOI] [PMC free article] [PubMed] [Google Scholar]
- 3. Su S., Wong G., Shi W., Liu J., Lai A. C. K., Zhou J., Liu W., Bi Y., Gao G. F., Trends Microbiol. 2016, 24, 490–502. [DOI] [PMC free article] [PubMed] [Google Scholar]
- 4. Zhou P., Yang X. L., Wang X.-G., Hu B., Zhang L., Zhang W., Si H.-R., Zhu Y., Li B., Huang C.-L., Chen H.-D., Chen J., Luo Y., Guo H., Jiang R.-D., Liu M.-Q., Chen Y., Shen X.-R., Wang X., Zheng X.-S., Zhao K., Chen Q.-J., Deng F., Liu L.-L., Yan B., Zhan F.-X., Wang Y.-Y., Xiao G.-F., Shi Z.-L., Nature 2020, 579, 270–273. [DOI] [PMC free article] [PubMed] [Google Scholar]
- 5. Kissler S. M., Tedijanto C., Goldstein E., Grad Y. H., Lipsitch M., Science 2020, 368, 860–868. [DOI] [PMC free article] [PubMed] [Google Scholar]
- 6. Harvey R. A., Rassen J. A., Kabelac C. A., Turenne W., Leonard S., Klesh R., Meyer W. A., Kaufman H. W., Anderson S., Cohen O., Petkov V. I., Cronin K. A., Van Dyke A. L., Lowy D. R., Sharpless N. E., Penberthy L., JAMA Intern. Med. 2021, 181, 672–679. [DOI] [PMC free article] [PubMed] [Google Scholar]
- 7. Xun G., Lane S. T., Petrov V. A., Pepa B. E., Zhao H., Nat. Commun. 2021, 12, 2905. [DOI] [PMC free article] [PubMed] [Google Scholar]
- 8. Tian D., Sun Y. H., Zhou J. M., Ye Q., J. Med. Virol. 2022, 94, 847–857. [DOI] [PMC free article] [PubMed] [Google Scholar]
- 9. Harvey W. T., Carabelli A. M., Jackson B., Gupta Ravindra K., Thomson E. C., Harrison E. M., Ludden C., Reeve R., Rambaut A., Peacock S. J., Robertson D. L., Nat. Rev. Microbiol. 2021, 19, 409–424. [DOI] [PMC free article] [PubMed] [Google Scholar]
- 10. Fu Y., Pan Y., Li Z., Li Y., Front. Microbiol. 2021, 11, 603058. [DOI] [PMC free article] [PubMed] [Google Scholar]
- 11.F. Muecksch, H. Wise, K. Templeton, B. Batchelor, M. Squires, K. McCance, L. Jarvis, K. Malloy, E. Furrie, C. Richardson, J. MacGuire, I. Godber, A. Burns, S. Mavin, F. Zhang, F. Schmidt, P. Bieniasz, S. Jenks, T. Hatziioannou, medRxiv 2021 10.1101/2021.07.02.21259939. [DOI]
- 12.P. D. Burbelo, F. X. Riedo, C. Morishima, S. Rawlings, D. Smith, S. Das, J. R. Strich, D. S. Chertow, R. T. Davey, J. I. Cohen, medRxiv 2020, 10.1101/2020.04.20.20071423. Update in: J. Infect. Dis. 2020 May 19: PMID: 32511445; PMCID: PMC7239070. [DOI]
- 13. Li T., Wang L., Wang H., Li X., Zhang S., Xu Y., Wei W., Front. Cell. Infect. Microbiol. 2020, 10, 470. [DOI] [PMC free article] [PubMed] [Google Scholar]
- 14. Premkumar L., Segovia-Chumbez B., Jadi R., Martínez D. R., Raut R., Markmann A. J., Cornaby C., Barelt L., Weiss S., Park Y., Edwards C. E., Weimer E., Scherer E. M., Rouphael N., Edupuganti S., Weiskopf D., Tse L. V., Hou Y. J., Margolis D., Sette A., Collins M. H., Schmitz J., Baric R. S., de Silva A. M., Sci. Immunol. 2020, 5, eabc8413. [DOI] [PMC free article] [PubMed] [Google Scholar]
- 15. Houlihan C. F., Beale R., Comment 2020, 20, 1350–1351. [DOI] [PMC free article] [PubMed] [Google Scholar]
- 16. Pang N. Y.-L., Pang A. S.-R., Chow V. T., Wang D.-Y., Military Med. Res. 2021, 8, 47. [DOI] [PMC free article] [PubMed] [Google Scholar]
- 17. Long Q.-X., Liu B.-Z., Deng H.-J., Wu G.-C., Deng K., Chen Y.-K., Liao P., Qiu J.-F., Lin Y., Cai X.-F., Wang D.-Q., Hu Y., Ren J.-H., Tang N., Xu Y.-Y., Yu L.-H., Mo Z., Gong F., Zhang X.-L., Tian W.-G., Hu L., Zhang X.-X., Xiang J.-L., Du H.-X., Liu H.-W., Lang C.-H., Luo X.-H., Wu S.-B., Cui X.-P., Zhou Z., Zhu M.-M., Wang J., Xue C.-J., Li X.-F., Wang L., Li Z.-J., Wang K., Niu C.-C., Yang Q.-J., Tang X.-J., Zhang Y., Liu X.-M., Li J.-J., Zhang D.-C., Zhang F., Liu P., Yuan J., Li Q., Hu J.-L., Chen J., Huang A. L., Nat. Med. 2020, 26, 845–848. [DOI] [PubMed] [Google Scholar]
- 18. Ma H., Zeng W., He H., Zhao D., Jiang D., Zhou P., Cheng L., Li Y., Ma X., Jin T., Cell. Mol. Immunol. 2020, 17, 773–775. [DOI] [PMC free article] [PubMed] [Google Scholar]
- 19. Zhou C., Bu G., Sun Y., Ren C., Qu M., Gao Y., Zhu Y., Wang L., Sun L., Li Y., J. Med. Virol. 2021, 93, 2857–2866. [DOI] [PubMed] [Google Scholar]
- 20. Hou H., Wang T., Zhang B., Luo Y., Mao L., Wang F., Wu S., Sun Z., Clin. Transl. Immunol. 2020, 9, e1136. [DOI] [PMC free article] [PubMed] [Google Scholar]
- 21. Ruano-Gallego D., García-Villadangos M., Moreno-Paz M., Gómez-Elvira J., Postigo M., Simón-Sacristán M., Reyburn H. T., Carolis C., Rodrigo N., Microb. Biotechnol. 2021, 14, 1228–1236. [DOI] [PMC free article] [PubMed] [Google Scholar]
- 22. Liu P., Zong Y., Jiang S., Yu X., ACS Omega 2021, 6, 9667–9671. [DOI] [PMC free article] [PubMed] [Google Scholar]
- 23. Zervou F. N., Louie P., Stachel A., Zacharioudakis I. M., Ortiz-Mendez Y., Thomas K., Aguero-Rosenfeld M. E., J. Med. Virol. 2021, 93, 5409–5415. [DOI] [PMC free article] [PubMed] [Google Scholar]
- 24. Sterlin D., Mathian A., Miyara M., Mohr A., Anna F., Claër L., Quentric P., Fadlallah J., Devilliers H., Ghillani P., Gunn C., Hockett R., Mudumba S., Guihot A., Luyt C.-E., Mayaux J., Beurton A., Fourati S., Bruel T., Schwartz O., Lacorte J.-M., Yssel H., Parizot C., Dorgham K., Charneau P., Amoura Z., Gorochov G., Sci. Transl. Med. 2021, 13, eabd2223. . [DOI] [PMC free article] [PubMed] [Google Scholar]
- 25. Padoan A., Csiacovelli L., Basso D., Negrini D., Zuin S., Cosma C., Faggian D., Matricardi P., Plebani M., Clin. Chim. Acta 2020, 507, 164–166. [DOI] [PMC free article] [PubMed] [Google Scholar]
- 26. Montesinos I., Gruson D., Kabamba B., Dahma H., Van den Wijngaert S., Reza S., Carbone V., Vandenberg O., Gulbis B., Wolff F., Rodriguez-Villalobos H., J. Clin. Virol. 2020, 128, 104413. [DOI] [PMC free article] [PubMed] [Google Scholar]
- 27. Infantino M., Manfredi M., Grossi V., Lari B., Fabbri S., Benucci M., Fortini A., Damiani A., Mobilia E. M., Panciroli M., Pancani S., Pesce G., J. Med. Virol. 2021, 93, 1436–1442. [DOI] [PMC free article] [PubMed] [Google Scholar]
- 28. Yakoh A., Pimpitak U., Rengpipat S., Hirankarn N., Chailapakul O., Chaiyo S., Biosens. Bioelectron. 2021, 176, 112912. [DOI] [PMC free article] [PubMed] [Google Scholar]
- 29. Peng R., Pan Y., Li Z., Qin Z., Rini J. M., Liu X., Biosens. Bioelectron. 2022, 197, 113762. [DOI] [PMC free article] [PubMed] [Google Scholar]
- 30.H. de Puig, S. S. Timilsina, J. Rainbow, P. Jolly, D. Najjar, N. Durr, G. Alter, J. Z. Li, X. G. Yu, D. R. Walt, P. Estrela, J. J. Collins, D. E. Ingber, medRxiv 2021, 10.1101/2021.09.01.21262387. [DOI]
- 31. Fabiani L., Saroglia M., Galatà G., De Santis R., Fillo S., Luca V., Faggioni G., D'Amore N., Regalbuto E., Salvatori P., Terova G., Moscone D., Lista F., Arduini F., Biosens. Bioelectron. 2021, 171, 112686. [DOI] [PMC free article] [PubMed] [Google Scholar]
- 32. Eguílaz M., Moreno-Guzmán M., Campuzano S., González-Cortés A., Yáñez-Sedeño P., Pingarrón J. M., Biosens. Bioelectron. 2010, 26, 517–522. [DOI] [PubMed] [Google Scholar]
- 33. Conzuelo F., Gamella M., Campuzano S., Pinacho D. G., Reviejo A. J., Marco M. P., Pingarrón J. M., Biosens. Bioelectron. 2012, 36, 81–88. [DOI] [PubMed] [Google Scholar]
- 34. Esteban-Fernández de Ávila B., Escamilla-Gómez V., Campuzano S., Pedrero M., Salvador J. P., Marco M. P., Pingarrón J. M., Sens. Actuators B 2013, 188, 212–220. [Google Scholar]
- 35. Stiehm E. R., Fudenberg H. H., Pediatrics 1966, 37, 715–727. [PubMed] [Google Scholar]
- 36. Zeng W., Ma H., Ding C., Yang Y., Sun Y., Huang X., He W., Xiang Y., Gao Y., Jin T., Sig. Transduct. Target Ther. 2021, 6, 35. [DOI] [PMC free article] [PubMed] [Google Scholar]
- 37. Burbelo P. D., Riedo F. X., Morishima C., Rawlings S., Smith D., Das S., Strich J. R., Chertow D. S., Davey R. T., Cohen J. I., J. Infect. Dis. 2020, 222, 206–213. [DOI] [PMC free article] [PubMed] [Google Scholar]
- 38. Prendecki M., Clarke C., Brown J., Cox A., Gleeson S., Guckian M., Randell P., Pria A. D., Lightstone L., Xu X.-N., Barclay W., McAdoo S. P., Kelleher P., Willicombe M., Lancet 2021, 397, 1178–1181. [DOI] [PMC free article] [PubMed] [Google Scholar]
- 39. Ingraham N. E., Ingbar D. H., Clin. Transl. Med. 2021, 11, e685. [DOI] [PMC free article] [PubMed] [Google Scholar]
- 40.L. Lu, B. Wing-Yee Mok, L. L. Chen, J. Man-Chun Chan, O. Tak-Yin Tsang, B. Hoi-Shiu Lam, V. Wai-Man Chuang, A. Wing-Ho Chu, W. M. Chan, J. Daniel, B. Pui-Chun Chan, R. Zhang, C. Chik-Yan Yip, V. Chi-Chung Cheng, K. H. Chan, D. Y. Jin, I. Fan-Ngai Hung, K. Y. Yuen, H. Chen, K. Kai-Wang, Clin. Infect. Dis. 2021, Dec 16, 10.1093/cid/ciab1041. [DOI]
Associated Data
This section collects any data citations, data availability statements, or supplementary materials included in this article.
Supplementary Materials
As a service to our authors and readers, this journal provides supporting information supplied by the authors. Such materials are peer reviewed and may be re‐organized for online delivery, but are not copy‐edited or typeset. Technical support issues arising from supporting information (other than missing files) should be addressed to the authors.
Supporting Information
Data Availability Statement
The data that support the findings of this study are available from the corresponding author upon reasonable request.